
|
|||||
|
 | |
| |
| |
| |
| |
| |
|
Gene: BLNK |
Gene summary for BLNK |
| Gene information | Species | Human | Gene symbol | BLNK | Gene ID | 29760 |
| Gene name | B cell linker | |
| Gene Alias | AGM4 | |
| Cytomap | 10q24.1 | |
| Gene Type | protein-coding | GO ID | GO:0001775 | UniProtAcc | Q8WV28 |
Top |
Malignant transformation analysis |
| Identification of the aberrant gene expression in precancerous and cancerous lesions by comparing the gene expression of stem-like cells in diseased tissues with normal stem cells |
| Entrez ID | Symbol | Replicates | Species | Organ | Tissue | Adj P-value | Log2FC | Malignancy |
| 29760 | BLNK | HTA11_7663_2000001011 | Human | Colorectum | SER | 6.81e-03 | 7.25e-01 | 0.0131 |
| 29760 | BLNK | HTA11_7696_3000711011 | Human | Colorectum | AD | 9.91e-04 | 3.07e-01 | 0.0674 |
| 29760 | BLNK | HTA11_99999965104_69814 | Human | Colorectum | MSS | 6.42e-07 | 6.73e-01 | 0.281 |
| 29760 | BLNK | HTA11_99999974143_84620 | Human | Colorectum | MSS | 2.73e-08 | -3.68e-01 | 0.3005 |
| 29760 | BLNK | A015-C-203 | Human | Colorectum | FAP | 1.84e-08 | -2.30e-01 | -0.1294 |
| 29760 | BLNK | A002-C-201 | Human | Colorectum | FAP | 3.16e-03 | -1.60e-01 | 0.0324 |
| 29760 | BLNK | A001-C-108 | Human | Colorectum | FAP | 6.27e-03 | -1.58e-01 | -0.0272 |
| 29760 | BLNK | A002-C-205 | Human | Colorectum | FAP | 5.33e-07 | -2.43e-01 | -0.1236 |
| 29760 | BLNK | A015-C-006 | Human | Colorectum | FAP | 7.04e-06 | -3.51e-01 | -0.0994 |
| 29760 | BLNK | A002-C-114 | Human | Colorectum | FAP | 7.34e-05 | -2.31e-01 | -0.1561 |
| 29760 | BLNK | A015-C-104 | Human | Colorectum | FAP | 9.04e-09 | -2.14e-01 | -0.1899 |
| 29760 | BLNK | A001-C-014 | Human | Colorectum | FAP | 1.24e-02 | -1.42e-01 | 0.0135 |
| 29760 | BLNK | A002-C-016 | Human | Colorectum | FAP | 4.20e-09 | -2.62e-01 | 0.0521 |
| 29760 | BLNK | A015-C-002 | Human | Colorectum | FAP | 5.60e-07 | -3.82e-01 | -0.0763 |
| 29760 | BLNK | A002-C-116 | Human | Colorectum | FAP | 5.19e-11 | -2.88e-01 | -0.0452 |
| 29760 | BLNK | A014-C-008 | Human | Colorectum | FAP | 6.40e-04 | -1.81e-01 | -0.191 |
| 29760 | BLNK | A018-E-020 | Human | Colorectum | FAP | 3.41e-07 | -2.46e-01 | -0.2034 |
| 29760 | BLNK | F034 | Human | Colorectum | FAP | 7.48e-07 | -2.66e-01 | -0.0665 |
| 29760 | BLNK | CRC-1-8810 | Human | Colorectum | CRC | 4.28e-08 | -3.84e-01 | 0.6257 |
| 29760 | BLNK | CRC-3-11773 | Human | Colorectum | CRC | 3.23e-06 | -3.18e-01 | 0.2564 |
| Page: 1 2 3 4 |
| Tissue | Expression Dynamics | Abbreviation |
| Colorectum (GSE201348) |  | FAP: Familial adenomatous polyposis |
| CRC: Colorectal cancer | ||
| Colorectum (HTA11) |  | AD: Adenomas |
| SER: Sessile serrated lesions | ||
| MSI-H: Microsatellite-high colorectal cancer | ||
| MSS: Microsatellite stable colorectal cancer | ||
| Esophagus | 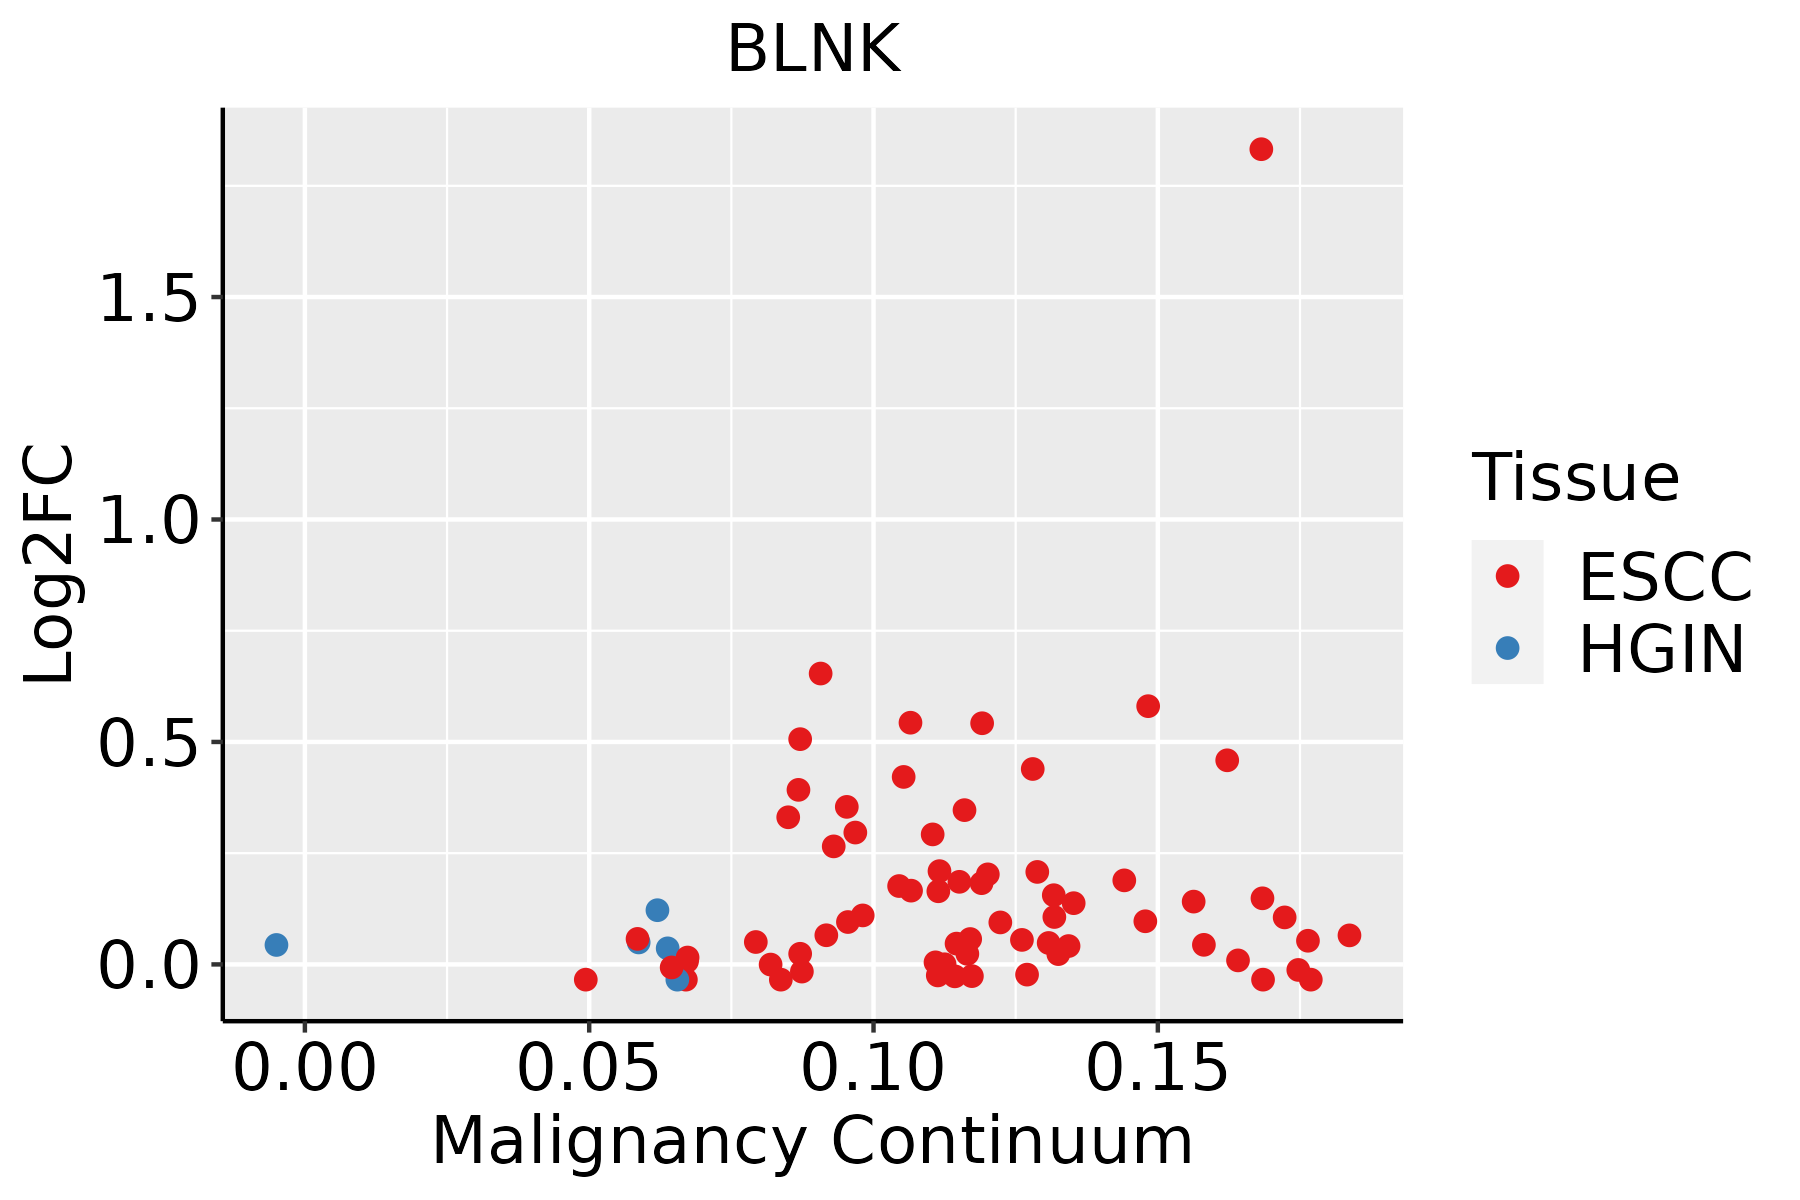 | ESCC: Esophageal squamous cell carcinoma |
| HGIN: High-grade intraepithelial neoplasias | ||
| LGIN: Low-grade intraepithelial neoplasias | ||
| Oral Cavity | 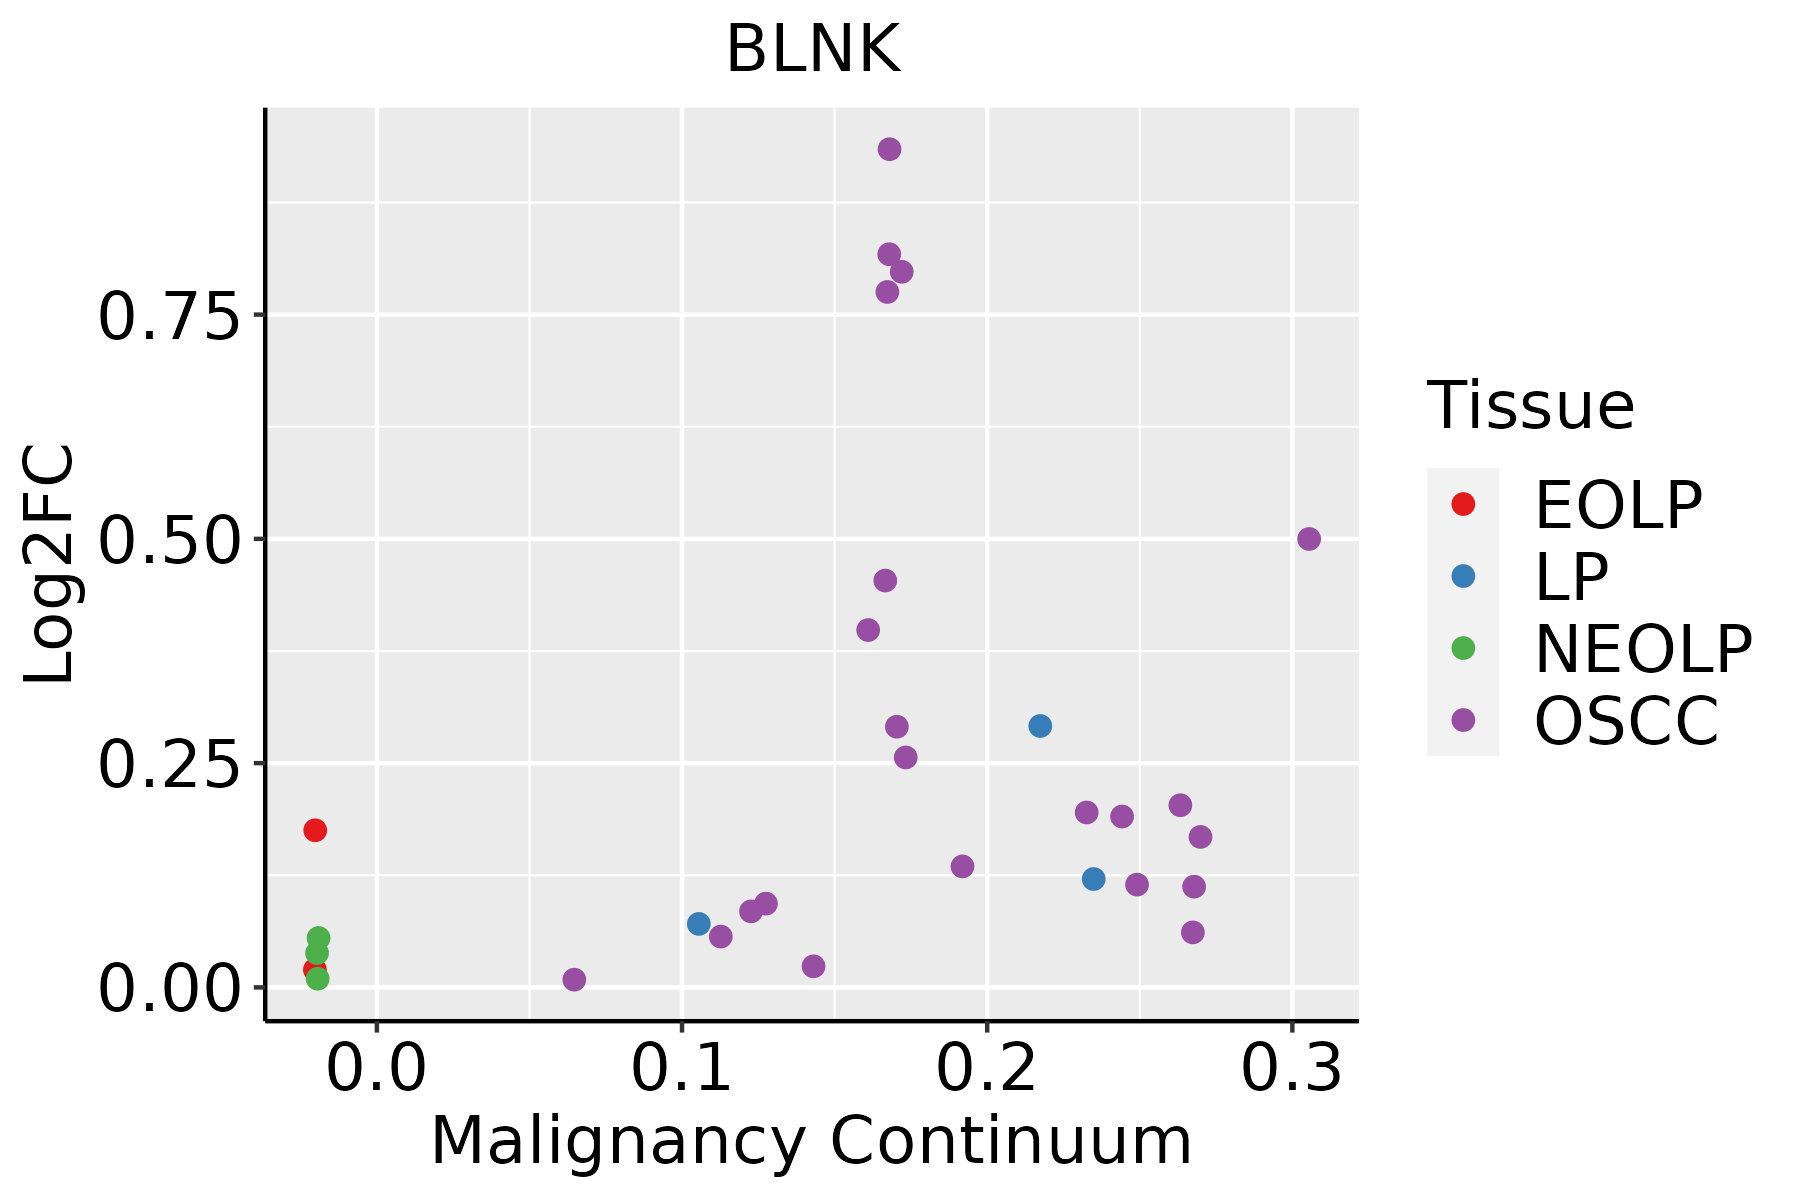 | EOLP: Erosive Oral lichen planus |
| LP: leukoplakia | ||
| NEOLP: Non-erosive oral lichen planus | ||
| OSCC: Oral squamous cell carcinoma |
| ∗log2FC in expression of this searched gene in stem-like cells from each diseased tissue sample relative to stem-like cells in normal samples in each tissue plotted against the malignancy continuum. Samples are colored based on if they are from different disease stage. |
Top |
Malignant transformation related pathway analysis |
| Find out the enriched GO biological processes and KEGG pathways involved in transition from healthy to precancer to cancer |
| Tissue | Disease Stage | Enriched GO biological Processes |
| Colorectum | AD |  |
| Colorectum | SER |  |
| Colorectum | MSS |  |
| Colorectum | MSI-H |  |
| Colorectum | FAP |  |
| ∗Top 15 enriched GO BP terms are showed in the bar plot of each disease state in each tissue. Each row represents a significant GO biological process which is colored according to the -log10(p.adjust). |
| Page: 1 2 3 4 5 6 7 8 9 |
| GO ID | Tissue | Disease Stage | Description | Gene Ratio | Bg Ratio | pvalue | p.adjust | Count |
| GO:1903131 | Colorectum | FAP | mononuclear cell differentiation | 79/2622 | 426/18723 | 5.00e-03 | 3.33e-02 | 79 |
| GO:19031317 | Esophagus | ESCC | mononuclear cell differentiation | 226/8552 | 426/18723 | 1.20e-03 | 5.88e-03 | 226 |
| GO:00300984 | Esophagus | ESCC | lymphocyte differentiation | 192/8552 | 374/18723 | 1.52e-02 | 4.93e-02 | 192 |
| GO:19031316 | Oral cavity | OSCC | mononuclear cell differentiation | 210/7305 | 426/18723 | 8.44e-06 | 9.02e-05 | 210 |
| GO:00300983 | Oral cavity | OSCC | lymphocyte differentiation | 179/7305 | 374/18723 | 2.74e-04 | 1.74e-03 | 179 |
| GO:00027646 | Oral cavity | OSCC | immune response-regulating signaling pathway | 212/7305 | 468/18723 | 2.93e-03 | 1.27e-02 | 212 |
| Page: 1 |
| Pathway ID | Tissue | Disease Stage | Description | Gene Ratio | Bg Ratio | pvalue | p.adjust | qvalue | Count |
| hsa05169 | Colorectum | MSS | Epstein-Barr virus infection | 63/1875 | 202/8465 | 1.63e-03 | 8.98e-03 | 5.50e-03 | 63 |
| hsa051691 | Colorectum | MSS | Epstein-Barr virus infection | 63/1875 | 202/8465 | 1.63e-03 | 8.98e-03 | 5.50e-03 | 63 |
| hsa05169210 | Esophagus | ESCC | Epstein-Barr virus infection | 151/4205 | 202/8465 | 1.55e-13 | 3.45e-12 | 1.77e-12 | 151 |
| hsa040645 | Esophagus | ESCC | NF-kappa B signaling pathway | 67/4205 | 104/8465 | 1.62e-03 | 4.89e-03 | 2.50e-03 | 67 |
| hsa0516937 | Esophagus | ESCC | Epstein-Barr virus infection | 151/4205 | 202/8465 | 1.55e-13 | 3.45e-12 | 1.77e-12 | 151 |
| hsa0406412 | Esophagus | ESCC | NF-kappa B signaling pathway | 67/4205 | 104/8465 | 1.62e-03 | 4.89e-03 | 2.50e-03 | 67 |
| hsa0516928 | Oral cavity | OSCC | Epstein-Barr virus infection | 144/3704 | 202/8465 | 1.08e-15 | 3.60e-14 | 1.83e-14 | 144 |
| hsa040644 | Oral cavity | OSCC | NF-kappa B signaling pathway | 67/3704 | 104/8465 | 1.57e-05 | 6.75e-05 | 3.44e-05 | 67 |
| hsa043806 | Oral cavity | OSCC | Osteoclast differentiation | 73/3704 | 128/8465 | 1.60e-03 | 4.44e-03 | 2.26e-03 | 73 |
| hsa04662 | Oral cavity | OSCC | B cell receptor signaling pathway | 48/3704 | 84/8465 | 9.02e-03 | 2.01e-02 | 1.03e-02 | 48 |
| hsa05169113 | Oral cavity | OSCC | Epstein-Barr virus infection | 144/3704 | 202/8465 | 1.08e-15 | 3.60e-14 | 1.83e-14 | 144 |
| hsa0406411 | Oral cavity | OSCC | NF-kappa B signaling pathway | 67/3704 | 104/8465 | 1.57e-05 | 6.75e-05 | 3.44e-05 | 67 |
| hsa0438011 | Oral cavity | OSCC | Osteoclast differentiation | 73/3704 | 128/8465 | 1.60e-03 | 4.44e-03 | 2.26e-03 | 73 |
| hsa046621 | Oral cavity | OSCC | B cell receptor signaling pathway | 48/3704 | 84/8465 | 9.02e-03 | 2.01e-02 | 1.03e-02 | 48 |
| Page: 1 |
Top |
Cell-cell communication analysis |
| Identification of potential cell-cell interactions between two cell types and their ligand-receptor pairs for different disease states |
| Ligand | Receptor | LRpair | Pathway | Tissue | Disease Stage |
| Page: 1 |
Top |
Single-cell gene regulatory network inference analysis |
| Find out the significant the regulons (TFs) and the target genes of each regulon across cell types for different disease states |
| TF | Cell Type | Tissue | Disease Stage | Target Gene | RSS | Regulon Activity |
| ∗The dot plots of a searched regulon are shown for all cell subpopulations in each disease state of each tissue based on the regulon specific score inferred using pySCENIC and by calculating the average expression. |
| Page: 1 |
Top |
Somatic mutation of malignant transformation related genes |
| Annotation of somatic variants for genes involved in malignant transformation |
| Hugo Symbol | Variant Class | Variant Classification | dbSNP RS | HGVSc | HGVSp | HGVSp Short | SWISSPROT | BIOTYPE | SIFT | PolyPhen | Tumor Sample Barcode | Tissue | Histology | Sex | Age | Stage | Therapy Types | Drugs | Outcome |
| BLNK | SNV | Missense_Mutation | c.259N>T | p.Pro87Ser | p.P87S | Q8WV28 | protein_coding | deleterious(0) | possibly_damaging(0.543) | TCGA-A2-A0YH-01 | Breast | breast invasive carcinoma | Female | <65 | III/IV | Chemotherapy | adriamycin | SD | |
| BLNK | SNV | Missense_Mutation | novel | c.473N>T | p.Ala158Val | p.A158V | Q8WV28 | protein_coding | tolerated(0.14) | benign(0.099) | TCGA-AN-A046-01 | Breast | breast invasive carcinoma | Female | >=65 | I/II | Unknown | Unknown | SD |
| BLNK | insertion | Frame_Shift_Ins | novel | c.855_856insATTAGAATACATCCTTCCTTTTGGCCCATCTTTGTTGGGC | p.His286IlefsTer59 | p.H286Ifs*59 | Q8WV28 | protein_coding | TCGA-BH-A0B1-01 | Breast | breast invasive carcinoma | Female | >=65 | I/II | Chemotherapy | adriamycin | SD | ||
| BLNK | SNV | Missense_Mutation | c.1164N>A | p.Phe388Leu | p.F388L | Q8WV28 | protein_coding | deleterious(0.05) | possibly_damaging(0.862) | TCGA-FU-A3HZ-01 | Cervix | cervical & endocervical cancer | Female | <65 | I/II | Chemotherapy | cisplatin | CR | |
| BLNK | SNV | Missense_Mutation | novel | c.523G>C | p.Glu175Gln | p.E175Q | Q8WV28 | protein_coding | deleterious(0.02) | possibly_damaging(0.529) | TCGA-JW-A5VL-01 | Cervix | cervical & endocervical cancer | Female | <65 | I/II | Unknown | Unknown | SD |
| BLNK | SNV | Missense_Mutation | novel | c.580G>A | p.Glu194Lys | p.E194K | Q8WV28 | protein_coding | deleterious(0) | benign(0.118) | TCGA-VS-A94Z-01 | Cervix | cervical & endocervical cancer | Female | <65 | I/II | Chemotherapy | cisplatin | CR |
| BLNK | SNV | Missense_Mutation | rs782566012 | c.1114C>T | p.Arg372Trp | p.R372W | Q8WV28 | protein_coding | deleterious(0) | probably_damaging(1) | TCGA-VS-A959-01 | Cervix | cervical & endocervical cancer | Female | >=65 | I/II | Unknown | Unknown | SD |
| BLNK | SNV | Missense_Mutation | rs587702260 | c.254N>C | p.Val85Ala | p.V85A | Q8WV28 | protein_coding | tolerated(0.12) | benign(0.003) | TCGA-AA-3811-01 | Colorectum | colon adenocarcinoma | Female | >=65 | III/IV | Unknown | Unknown | PD |
| BLNK | SNV | Missense_Mutation | c.451N>G | p.Ser151Ala | p.S151A | Q8WV28 | protein_coding | tolerated(0.2) | benign(0.001) | TCGA-G4-6586-01 | Colorectum | colon adenocarcinoma | Female | >=65 | I/II | Unknown | Unknown | SD | |
| BLNK | SNV | Missense_Mutation | c.1333N>T | p.Asp445Tyr | p.D445Y | Q8WV28 | protein_coding | deleterious(0.01) | probably_damaging(0.972) | TCGA-AG-3892-01 | Colorectum | rectum adenocarcinoma | Female | <65 | I/II | Unknown | Unknown | SD |
| Page: 1 2 3 4 |
Top |
Related drugs of malignant transformation related genes |
| Identification of chemicals and drugs interact with genes involved in malignant transfromation |
| (DGIdb 4.0) |
| Entrez ID | Symbol | Category | Interaction Types | Drug Claim Name | Drug Name | PMIDs |
| Page: 1 |

Copyright 2023-Present -The University of Texas Health Science Center at Houston |