Schematic overview of the cellular and molecular mechanisms involved in the cancer progression, including the proposed cellular and molecular mechanisms in cancer cells trajectory. AT1: alveolar type 1 cells; AT2: alveolar type 2 cells; AAH: atypical adenomatous hyperplasia; AIS: adenocarcinoma in situ; MIA: minimally invasive adenocarcinoma; IA: invasive adenocarcinoma; EMT: epithelial-mesenchymal transition

Home

Download

Statistics

Help

Contact

Center for Computational Systems Medicine
leaf

Gene summary

leaf

Malignant transformation analysis

leaf

Malignant transformation related pathway analysis

leaf

Cell-cell communication analysis

leaf

Single-cell gene regulatory network inference analysis

leaf

Somatic mutation of malignant transformation related genes

leaf

Related drugs of malignant transformation related genes

Gene: BLMH

Gene summary for BLMH

check button Gene summary.

Gene informationSpeciesHuman
Gene symbol

BLMH

Gene ID

642

Gene namebleomycin hydrolase
Gene AliasBH
Cytomap17q11.2
Gene Typeprotein-coding
GO ID

GO:0000096

UniProtAcc

Q13867


Top

Malignant transformation analysis

check button Identification of the aberrant gene expression in precancerous and cancerous lesions by comparing the gene expression of stem-like cells in diseased tissues with normal stem cells
check button Malignant transformation involving gene list.
Entrez IDSymbolReplicatesSpeciesOrganTissueAdj P-valueLog2FCMalignancy
642BLMHLZE4THumanEsophagusESCC8.27e-155.43e-010.0811
642BLMHLZE5THumanEsophagusESCC1.65e-024.83e-010.0514
642BLMHLZE7THumanEsophagusESCC5.32e-052.81e-010.0667
642BLMHLZE24THumanEsophagusESCC3.78e-123.36e-010.0596
642BLMHLZE6THumanEsophagusESCC1.55e-041.94e-010.0845
642BLMHP2T-EHumanEsophagusESCC2.52e-235.38e-010.1177
642BLMHP4T-EHumanEsophagusESCC5.67e-358.21e-010.1323
642BLMHP5T-EHumanEsophagusESCC7.47e-073.76e-020.1327
642BLMHP8T-EHumanEsophagusESCC1.07e-118.12e-020.0889
642BLMHP9T-EHumanEsophagusESCC2.29e-174.40e-010.1131
642BLMHP10T-EHumanEsophagusESCC8.09e-134.81e-010.116
642BLMHP11T-EHumanEsophagusESCC8.07e-166.35e-010.1426
642BLMHP12T-EHumanEsophagusESCC5.71e-288.07e-010.1122
642BLMHP15T-EHumanEsophagusESCC7.29e-378.88e-010.1149
642BLMHP16T-EHumanEsophagusESCC6.28e-203.84e-010.1153
642BLMHP17T-EHumanEsophagusESCC6.18e-031.36e-010.1278
642BLMHP19T-EHumanEsophagusESCC4.84e-076.88e-010.1662
642BLMHP20T-EHumanEsophagusESCC7.34e-163.25e-010.1124
642BLMHP21T-EHumanEsophagusESCC1.80e-165.78e-010.1617
642BLMHP22T-EHumanEsophagusESCC6.54e-449.70e-010.1236
Page: 1 2 3 4 5 

check button Transcriptomic changes along malignancy continuum.
TissueExpression DynamicsAbbreviation
EsophagusThe image shows the transcriptomic changes along malignancy continuum.log2FC in expression of this searched gene in stem-like cells from each diseased tissue sample relative to stem-like cells in normal samples in each tissue plotted against the malignancy continuum. Samples are colored based on if they are from different disease stage.
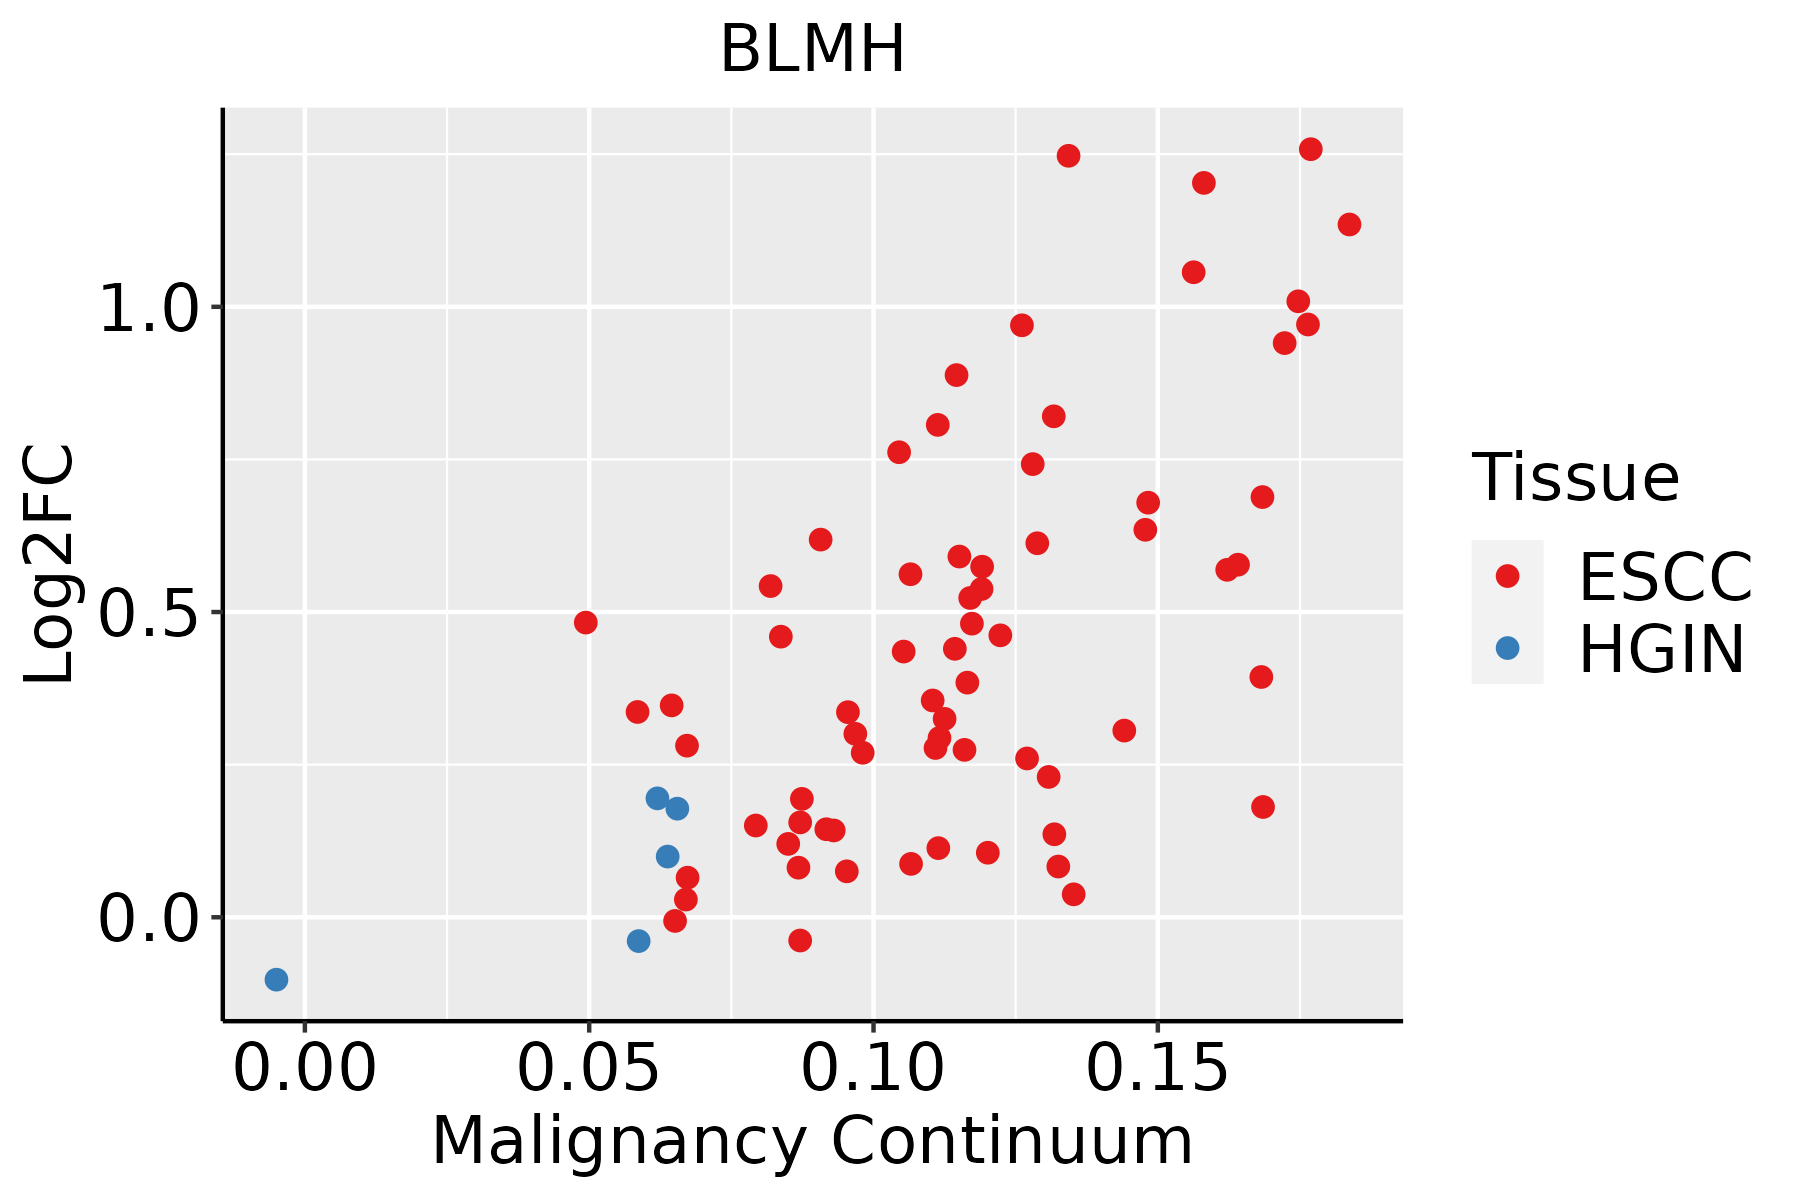
ESCC: Esophageal squamous cell carcinoma
HGIN: High-grade intraepithelial neoplasias
LGIN: Low-grade intraepithelial neoplasias
LiverThe image shows the transcriptomic changes along malignancy continuum.log2FC in expression of this searched gene in stem-like cells from each diseased tissue sample relative to stem-like cells in normal samples in each tissue plotted against the malignancy continuum. Samples are colored based on if they are from different disease stage.HCC: Hepatocellular carcinoma
NAFLD: Non-alcoholic fatty liver disease
Oral CavityThe image shows the transcriptomic changes along malignancy continuum.log2FC in expression of this searched gene in stem-like cells from each diseased tissue sample relative to stem-like cells in normal samples in each tissue plotted against the malignancy continuum. Samples are colored based on if they are from different disease stage.EOLP: Erosive Oral lichen planus
LP: leukoplakia
NEOLP: Non-erosive oral lichen planus
OSCC: Oral squamous cell carcinoma
SkinThe image shows the transcriptomic changes along malignancy continuum.log2FC in expression of this searched gene in stem-like cells from each diseased tissue sample relative to stem-like cells in normal samples in each tissue plotted against the malignancy continuum. Samples are colored based on if they are from different disease stage.AK: Actinic keratosis
cSCC: Cutaneous squamous cell carcinoma
SCCIS:squamous cell carcinoma in situ
ThyroidThe image shows the transcriptomic changes along malignancy continuum.log2FC in expression of this searched gene in stem-like cells from each diseased tissue sample relative to stem-like cells in normal samples in each tissue plotted against the malignancy continuum. Samples are colored based on if they are from different disease stage.
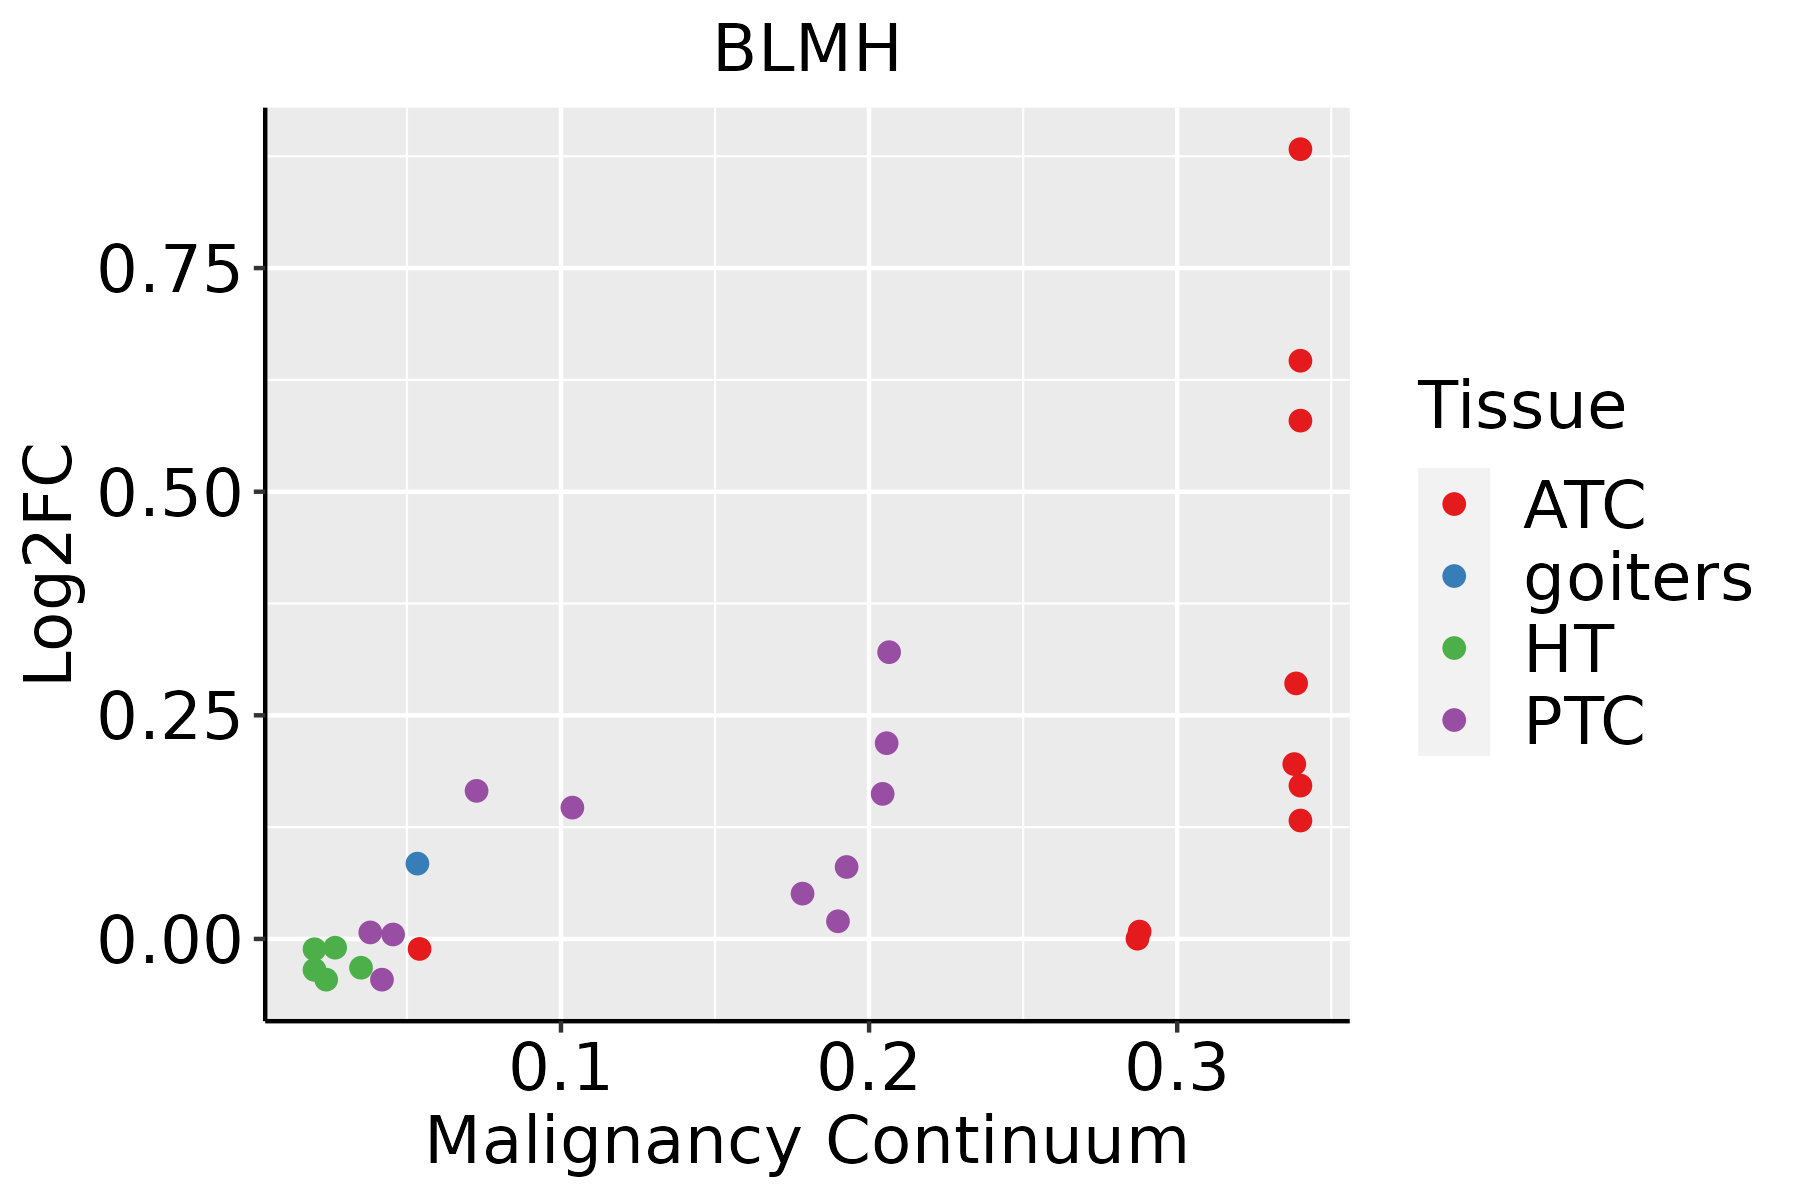
ATC: Anaplastic thyroid cancer
HT: Hashimoto's thyroiditis
PTC: Papillary thyroid cancer
∗log2FC in expression of this searched gene in stem-like cells from each diseased tissue sample relative to stem-like cells in normal samples in each tissue plotted against the malignancy continuum. Samples are colored based on if they are from different disease stage.

Top

Malignant transformation related pathway analysis

check buttonFind out the enriched GO biological processes and KEGG pathways involved in transition from healthy to precancer to cancer
check button Figure of enriched GO biological processes.
TissueDisease StageEnriched GO biological Processes
ColorectumADGO analysis - Figure of enriched GO biological processes: Top 15 enriched GO BP terms are showed in the bar plot of each disease state in each tissue. Each row represents a significant GO biological process which is colored according to the -log10(p.adjust).
ColorectumSERGO analysis - Figure of enriched GO biological processes: Top 15 enriched GO BP terms are showed in the bar plot of each disease state in each tissue. Each row represents a significant GO biological process which is colored according to the -log10(p.adjust).
ColorectumMSSGO analysis - Figure of enriched GO biological processes: Top 15 enriched GO BP terms are showed in the bar plot of each disease state in each tissue. Each row represents a significant GO biological process which is colored according to the -log10(p.adjust).
ColorectumMSI-HGO analysis - Figure of enriched GO biological processes: Top 15 enriched GO BP terms are showed in the bar plot of each disease state in each tissue. Each row represents a significant GO biological process which is colored according to the -log10(p.adjust).
ColorectumFAPGO analysis - Figure of enriched GO biological processes: Top 15 enriched GO BP terms are showed in the bar plot of each disease state in each tissue. Each row represents a significant GO biological process which is colored according to the -log10(p.adjust).
∗Top 15 enriched GO BP terms are showed in the bar plot of each disease state in each tissue. Each row represents a significant GO biological process which is colored according to the -log10(p.adjust).
Page: 1 2 3 4 5 6 7 8 9 

check button Enriched GO biological processes.
GO IDTissueDisease StageDescriptionGene RatioBg Ratiopvaluep.adjustCount
GO:000020917EsophagusESCCprotein polyubiquitination170/8552236/187231.40e-161.09e-14170
GO:00067906EsophagusESCCsulfur compound metabolic process201/8552339/187232.64e-073.94e-06201
GO:000941020EsophagusESCCresponse to xenobiotic stimulus253/8552462/187234.55e-053.58e-04253
GO:000963620EsophagusESCCresponse to toxic substance150/8552262/187231.00e-047.12e-04150
GO:00442827EsophagusESCCsmall molecule catabolic process201/8552376/187231.35e-036.41e-03201
GO:000679021LiverHCCsulfur compound metabolic process212/7958339/187235.60e-143.39e-12212
GO:004428221LiverHCCsmall molecule catabolic process225/7958376/187236.50e-122.80e-10225
GO:000020921LiverHCCprotein polyubiquitination151/7958236/187231.90e-117.59e-10151
GO:001605421LiverHCCorganic acid catabolic process152/7958240/187235.11e-111.92e-09152
GO:00463952LiverHCCcarboxylic acid catabolic process149/7958236/187231.11e-103.87e-09149
GO:19016052LiverHCCalpha-amino acid metabolic process124/7958195/187232.07e-095.79e-08124
GO:00065202LiverHCCcellular amino acid metabolic process167/7958284/187231.91e-084.56e-07167
GO:000963622LiverHCCresponse to toxic substance153/7958262/187231.37e-072.58e-06153
GO:00000962LiverHCCsulfur amino acid metabolic process29/795834/187233.26e-075.62e-0629
GO:000941022LiverHCCresponse to xenobiotic stimulus248/7958462/187236.47e-071.02e-05248
GO:00090632LiverHCCcellular amino acid catabolic process70/7958110/187236.12e-067.52e-0570
GO:19016062LiverHCCalpha-amino acid catabolic process53/795887/187234.01e-042.71e-0353
GO:0050667LiverHCChomocysteine metabolic process11/795814/187236.81e-032.73e-0211
GO:000020910Oral cavityOSCCprotein polyubiquitination150/7305236/187231.59e-149.27e-13150
GO:000963618Oral cavityOSCCresponse to toxic substance137/7305262/187237.94e-068.52e-05137
Page: 1 2 

check button Enriched KEGG pathways.
Pathway IDTissueDisease StageDescriptionGene RatioBg Ratiopvaluep.adjustqvalueCount
Page: 1 

Top

Cell-cell communication analysis

check buttonIdentification of potential cell-cell interactions between two cell types and their ligand-receptor pairs for different disease states
LigandReceptorLRpairPathwayTissueDisease Stage
Page: 1 

Top

Single-cell gene regulatory network inference analysis

check buttonFind out the significant the regulons (TFs) and the target genes of each regulon across cell types for different disease states
TFCell TypeTissueDisease StageTarget GeneRSSRegulon Activity
∗The dot plots of a searched regulon are shown for all cell subpopulations in each disease state of each tissue based on the regulon specific score inferred using pySCENIC and by calculating the average expression.
Page: 1 

Top

Somatic mutation of malignant transformation related genes

check buttonAnnotation of somatic variants for genes involved in malignant transformation
Hugo SymbolVariant ClassVariant ClassificationdbSNP RSHGVScHGVSpHGVSp ShortSWISSPROTBIOTYPESIFTPolyPhenTumor Sample BarcodeTissueHistologySexAgeStageTherapy TypesDrugsOutcome
BLMHSNVMissense_Mutationrs768600658c.398N>Gp.Val133Glyp.V133GQ13867protein_codingdeleterious(0)probably_damaging(0.996)TCGA-A2-A1G0-01Breastbreast invasive carcinomaFemale<65I/IIChemotherapytaxotereSD
BLMHSNVMissense_Mutationc.893N>Ap.Thr298Asnp.T298NQ13867protein_codingdeleterious(0.01)possibly_damaging(0.617)TCGA-A8-A09Z-01Breastbreast invasive carcinomaFemale>=65I/IIUnknownUnknownSD
BLMHSNVMissense_Mutationrs768600658c.398N>Gp.Val133Glyp.V133GQ13867protein_codingdeleterious(0)probably_damaging(0.996)TCGA-B6-A1KF-01Breastbreast invasive carcinomaFemale>=65I/IIUnknownUnknownSD
BLMHSNVMissense_Mutationrs768600658c.398N>Gp.Val133Glyp.V133GQ13867protein_codingdeleterious(0)probably_damaging(0.996)TCGA-E2-A1LB-01Breastbreast invasive carcinomaFemale<65I/IIChemotherapycytoxanSD
BLMHinsertionFrame_Shift_Insnovelc.77_78insGTCTTGGAGAp.Ala27SerfsTer70p.A27Sfs*70Q13867protein_codingTCGA-B6-A0RG-01Breastbreast invasive carcinomaFemale<65I/IIUnknownUnknownSD
BLMHSNVMissense_Mutationnovelc.1298N>Cp.Val433Alap.V433AQ13867protein_codingdeleterious(0.01)possibly_damaging(0.891)TCGA-2W-A8YY-01Cervixcervical & endocervical cancerFemale<65I/IIChemotherapycisplatinCR
BLMHSNVMissense_Mutationnovelc.44N>Cp.Ile15Thrp.I15TQ13867protein_codingtolerated(0.76)benign(0)TCGA-2W-A8YY-01Cervixcervical & endocervical cancerFemale<65I/IIChemotherapycisplatinCR
BLMHSNVMissense_Mutationnovelc.766N>Ap.Glu256Lysp.E256KQ13867protein_codingtolerated(0.75)benign(0.001)TCGA-DG-A2KK-01Cervixcervical & endocervical cancerFemale<65III/IVChemotherapycisplatinSD
BLMHSNVMissense_Mutationnovelc.800N>Cp.Lys267Thrp.K267TQ13867protein_codingtolerated(0.06)probably_damaging(0.999)TCGA-FU-A3HZ-01Cervixcervical & endocervical cancerFemale<65I/IIChemotherapycisplatinCR
BLMHSNVMissense_Mutationnovelc.834N>Gp.His278Glnp.H278QQ13867protein_codingdeleterious(0.01)benign(0.084)TCGA-PN-A8MA-01Cervixcervical & endocervical cancerFemale<65I/IIChemotherapycisplatinSD
Page: 1 2 3 4 5 6 

Top

Related drugs of malignant transformation related genes

check buttonIdentification of chemicals and drugs interact with genes involved in malignant transfromation
(DGIdb 4.0)
Entrez IDSymbolCategoryInteraction TypesDrug Claim NameDrug NamePMIDs
Page: 1