
|
|||||
|
 | |
| |
| |
| |
| |
| |
|
Gene: BLCAP |
Gene summary for BLCAP |
| Gene information | Species | Human | Gene symbol | BLCAP | Gene ID | 10904 |
| Gene name | BLCAP apoptosis inducing factor | |
| Gene Alias | BC10 | |
| Cytomap | 20q11.23 | |
| Gene Type | protein-coding | GO ID | GO:0006915 | UniProtAcc | P62952 |
Top |
Malignant transformation analysis |
| Identification of the aberrant gene expression in precancerous and cancerous lesions by comparing the gene expression of stem-like cells in diseased tissues with normal stem cells |
| Entrez ID | Symbol | Replicates | Species | Organ | Tissue | Adj P-value | Log2FC | Malignancy |
| 10904 | BLCAP | LZE4T | Human | Esophagus | ESCC | 1.27e-19 | 6.26e-01 | 0.0811 |
| 10904 | BLCAP | LZE5T | Human | Esophagus | ESCC | 2.91e-05 | 5.40e-01 | 0.0514 |
| 10904 | BLCAP | LZE7T | Human | Esophagus | ESCC | 4.83e-03 | 4.29e-01 | 0.0667 |
| 10904 | BLCAP | LZE8T | Human | Esophagus | ESCC | 1.13e-13 | 7.11e-01 | 0.067 |
| 10904 | BLCAP | LZE20T | Human | Esophagus | ESCC | 7.77e-10 | 8.44e-01 | 0.0662 |
| 10904 | BLCAP | LZE22T | Human | Esophagus | ESCC | 1.72e-04 | 8.50e-01 | 0.068 |
| 10904 | BLCAP | LZE24T | Human | Esophagus | ESCC | 2.44e-35 | 1.61e+00 | 0.0596 |
| 10904 | BLCAP | LZE6T | Human | Esophagus | ESCC | 2.77e-03 | 2.73e-01 | 0.0845 |
| 10904 | BLCAP | P1T-E | Human | Esophagus | ESCC | 3.40e-07 | 5.58e-01 | 0.0875 |
| 10904 | BLCAP | P2T-E | Human | Esophagus | ESCC | 2.55e-39 | 8.27e-01 | 0.1177 |
| 10904 | BLCAP | P4T-E | Human | Esophagus | ESCC | 2.53e-15 | 6.37e-01 | 0.1323 |
| 10904 | BLCAP | P5T-E | Human | Esophagus | ESCC | 5.11e-16 | 4.81e-01 | 0.1327 |
| 10904 | BLCAP | P8T-E | Human | Esophagus | ESCC | 3.04e-52 | 1.14e+00 | 0.0889 |
| 10904 | BLCAP | P9T-E | Human | Esophagus | ESCC | 2.28e-08 | 4.29e-01 | 0.1131 |
| 10904 | BLCAP | P10T-E | Human | Esophagus | ESCC | 1.17e-91 | 1.86e+00 | 0.116 |
| 10904 | BLCAP | P11T-E | Human | Esophagus | ESCC | 1.21e-18 | 1.43e+00 | 0.1426 |
| 10904 | BLCAP | P12T-E | Human | Esophagus | ESCC | 1.52e-57 | 1.34e+00 | 0.1122 |
| 10904 | BLCAP | P15T-E | Human | Esophagus | ESCC | 2.95e-56 | 1.57e+00 | 0.1149 |
| 10904 | BLCAP | P16T-E | Human | Esophagus | ESCC | 4.14e-73 | 1.81e+00 | 0.1153 |
| 10904 | BLCAP | P17T-E | Human | Esophagus | ESCC | 5.52e-14 | 1.20e+00 | 0.1278 |
| Page: 1 2 3 4 5 6 7 |
| Tissue | Expression Dynamics | Abbreviation |
| Esophagus |  | ESCC: Esophageal squamous cell carcinoma |
| HGIN: High-grade intraepithelial neoplasias | ||
| LGIN: Low-grade intraepithelial neoplasias | ||
| Liver |  | HCC: Hepatocellular carcinoma |
| NAFLD: Non-alcoholic fatty liver disease | ||
| Oral Cavity | 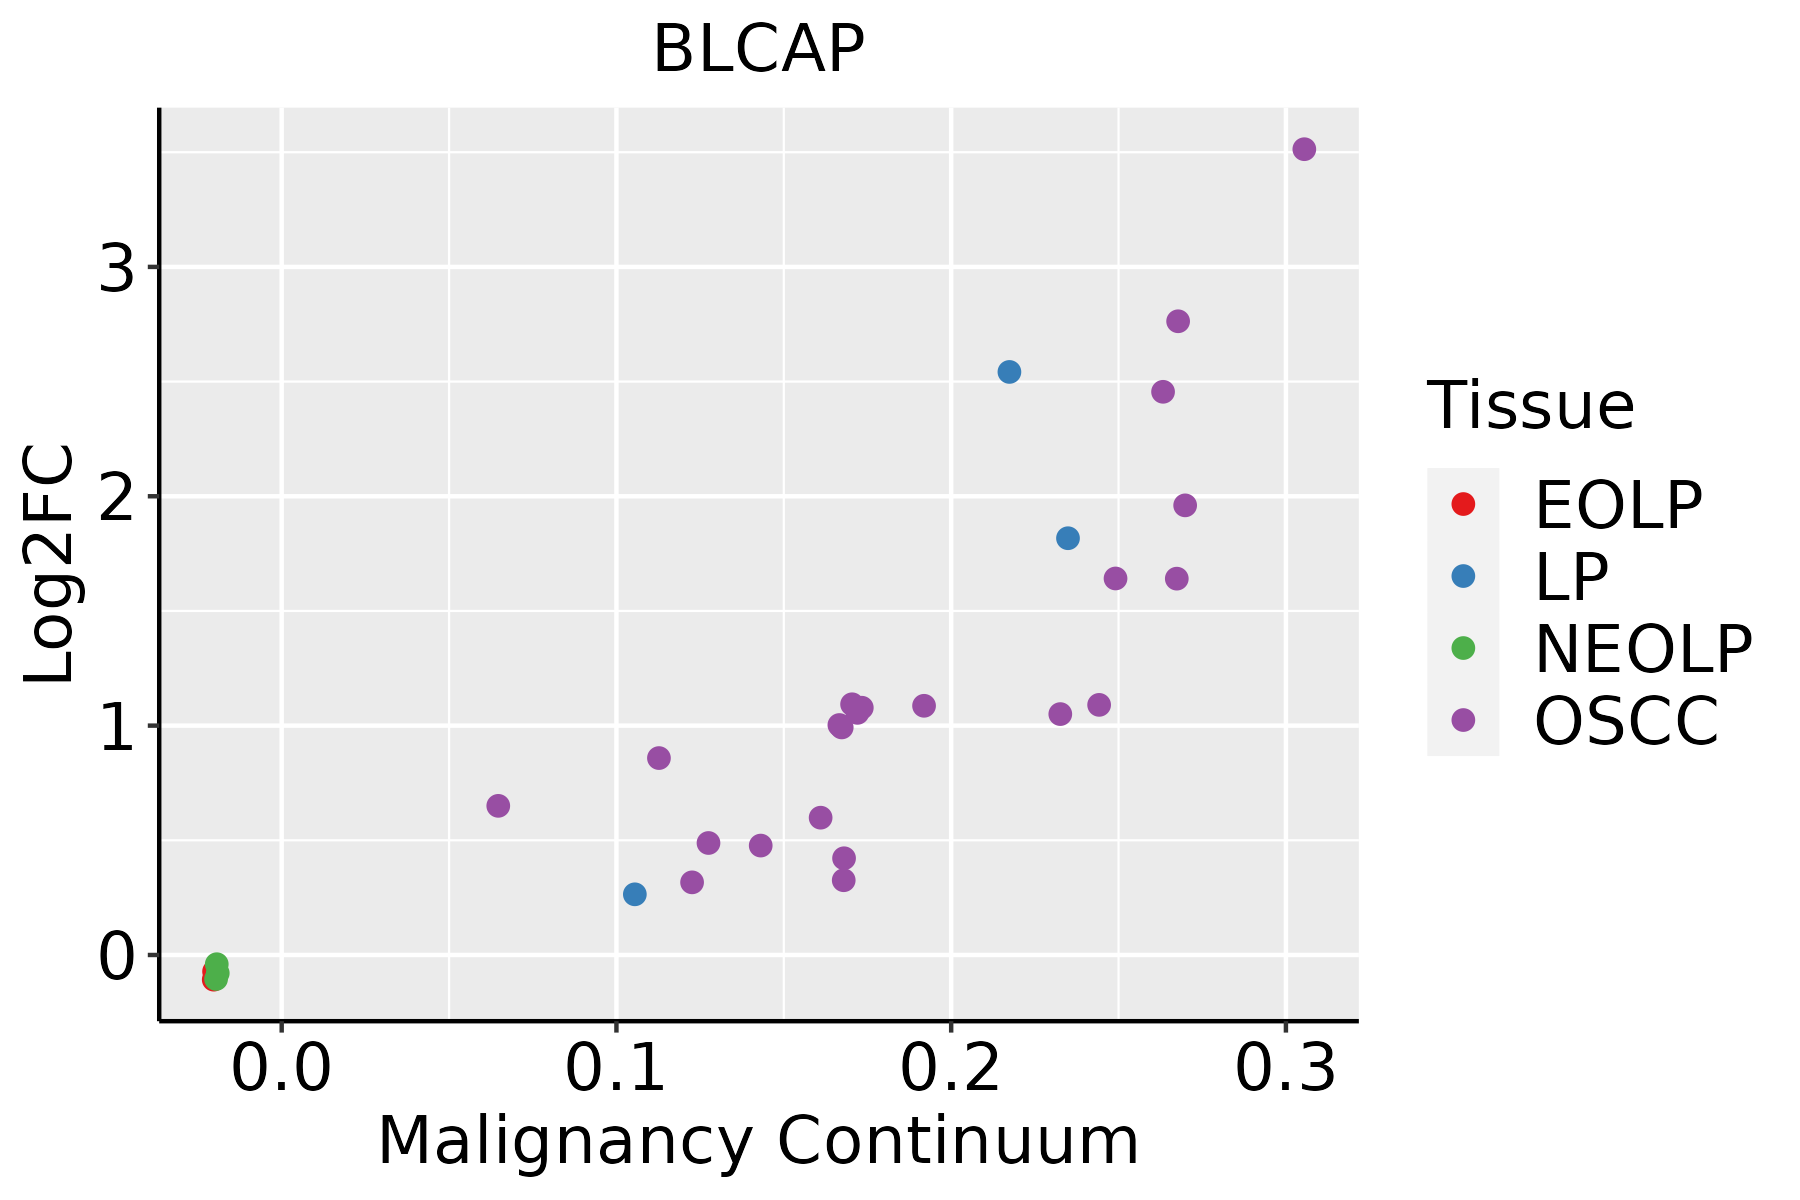 | EOLP: Erosive Oral lichen planus |
| LP: leukoplakia | ||
| NEOLP: Non-erosive oral lichen planus | ||
| OSCC: Oral squamous cell carcinoma | ||
| Skin |  | AK: Actinic keratosis |
| cSCC: Cutaneous squamous cell carcinoma | ||
| SCCIS:squamous cell carcinoma in situ | ||
| Thyroid | 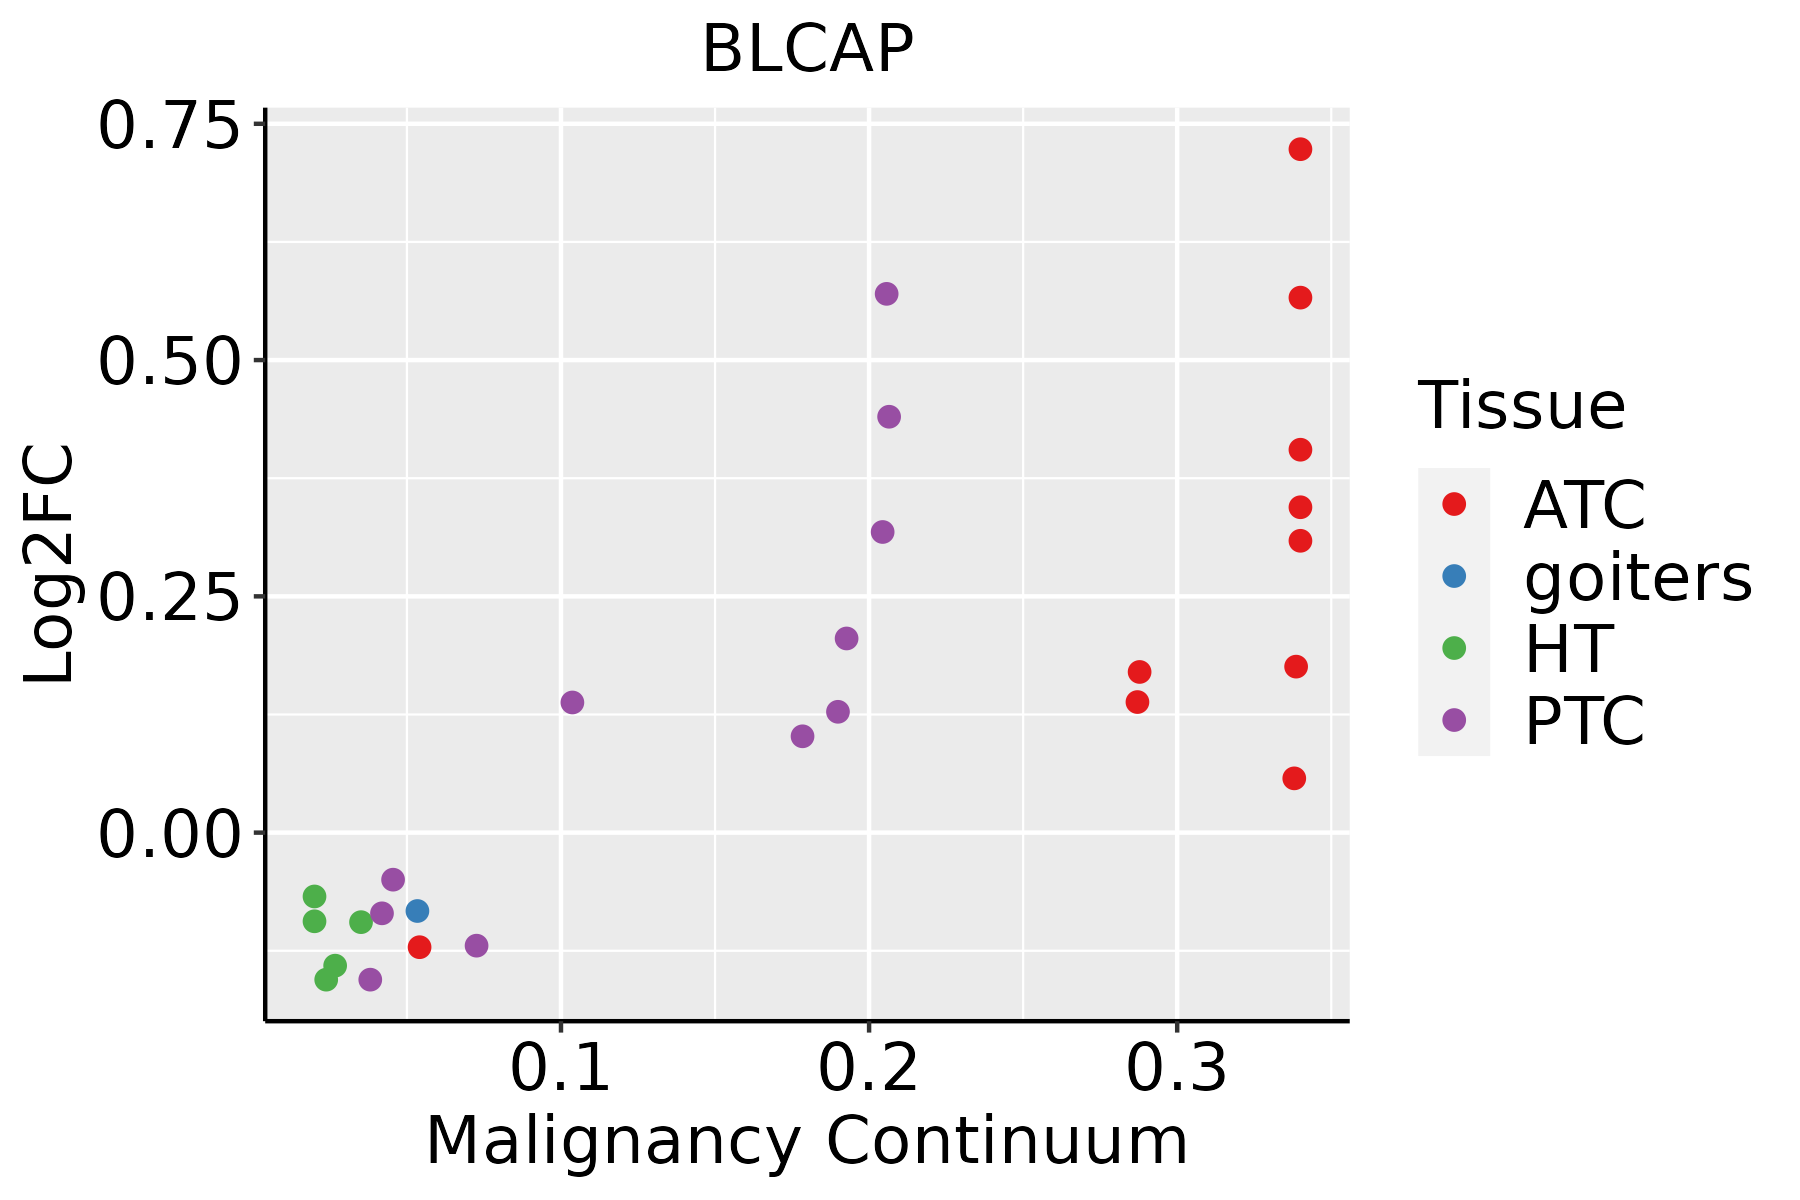 | ATC: Anaplastic thyroid cancer |
| HT: Hashimoto's thyroiditis | ||
| PTC: Papillary thyroid cancer |
| ∗log2FC in expression of this searched gene in stem-like cells from each diseased tissue sample relative to stem-like cells in normal samples in each tissue plotted against the malignancy continuum. Samples are colored based on if they are from different disease stage. |
Top |
Malignant transformation related pathway analysis |
| Find out the enriched GO biological processes and KEGG pathways involved in transition from healthy to precancer to cancer |
| Tissue | Disease Stage | Enriched GO biological Processes |
| Colorectum | AD |  |
| Colorectum | SER |  |
| Colorectum | MSS |  |
| Colorectum | MSI-H |  |
| Colorectum | FAP |  |
| ∗Top 15 enriched GO BP terms are showed in the bar plot of each disease state in each tissue. Each row represents a significant GO biological process which is colored according to the -log10(p.adjust). |
| Page: 1 2 3 4 5 6 7 8 9 |
| GO ID | Tissue | Disease Stage | Description | Gene Ratio | Bg Ratio | pvalue | p.adjust | Count |
| GO:0022411111 | Esophagus | ESCC | cellular component disassembly | 305/8552 | 443/18723 | 1.94e-23 | 4.57e-21 | 305 |
| GO:002241112 | Liver | HCC | cellular component disassembly | 282/7958 | 443/18723 | 1.02e-19 | 1.38e-17 | 282 |
| GO:0097194 | Liver | HCC | execution phase of apoptosis | 48/7958 | 85/18723 | 6.47e-03 | 2.63e-02 | 48 |
| GO:002241119 | Oral cavity | OSCC | cellular component disassembly | 283/7305 | 443/18723 | 9.57e-27 | 3.37e-24 | 283 |
| GO:0022411110 | Oral cavity | LP | cellular component disassembly | 173/4623 | 443/18723 | 9.97e-12 | 7.44e-10 | 173 |
| GO:0022411112 | Skin | cSCC | cellular component disassembly | 201/4864 | 443/18723 | 4.09e-19 | 5.69e-17 | 201 |
| GO:0022411113 | Thyroid | PTC | cellular component disassembly | 232/5968 | 443/18723 | 1.36e-19 | 1.75e-17 | 232 |
| GO:002241124 | Thyroid | ATC | cellular component disassembly | 248/6293 | 443/18723 | 1.34e-22 | 3.69e-20 | 248 |
| Page: 1 |
| Pathway ID | Tissue | Disease Stage | Description | Gene Ratio | Bg Ratio | pvalue | p.adjust | qvalue | Count |
| Page: 1 |
Top |
Cell-cell communication analysis |
| Identification of potential cell-cell interactions between two cell types and their ligand-receptor pairs for different disease states |
| Ligand | Receptor | LRpair | Pathway | Tissue | Disease Stage |
| Page: 1 |
Top |
Single-cell gene regulatory network inference analysis |
| Find out the significant the regulons (TFs) and the target genes of each regulon across cell types for different disease states |
| TF | Cell Type | Tissue | Disease Stage | Target Gene | RSS | Regulon Activity |
| ∗The dot plots of a searched regulon are shown for all cell subpopulations in each disease state of each tissue based on the regulon specific score inferred using pySCENIC and by calculating the average expression. |
| Page: 1 |
Top |
Somatic mutation of malignant transformation related genes |
| Annotation of somatic variants for genes involved in malignant transformation |
| Hugo Symbol | Variant Class | Variant Classification | dbSNP RS | HGVSc | HGVSp | HGVSp Short | SWISSPROT | BIOTYPE | SIFT | PolyPhen | Tumor Sample Barcode | Tissue | Histology | Sex | Age | Stage | Therapy Types | Drugs | Outcome |
| BLCAP | SNV | Missense_Mutation | c.118N>T | p.Arg40Trp | p.R40W | P62952 | protein_coding | deleterious(0) | probably_damaging(0.995) | TCGA-AG-A02N-01 | Colorectum | rectum adenocarcinoma | Male | >=65 | I/II | Chemotherapy | folinic | CR | |
| BLCAP | SNV | Missense_Mutation | novel | c.236N>T | p.Ala79Val | p.A79V | P62952 | protein_coding | deleterious_low_confidence(0.01) | possibly_damaging(0.491) | TCGA-A5-A0G2-01 | Endometrium | uterine corpus endometrioid carcinoma | Female | <65 | III/IV | Unknown | Unknown | SD |
| BLCAP | SNV | Missense_Mutation | novel | c.236N>T | p.Ala79Val | p.A79V | P62952 | protein_coding | deleterious_low_confidence(0.01) | possibly_damaging(0.491) | TCGA-AP-A1DK-01 | Endometrium | uterine corpus endometrioid carcinoma | Female | <65 | I/II | Unknown | Unknown | SD |
| BLCAP | SNV | Missense_Mutation | c.233C>T | p.Ser78Leu | p.S78L | P62952 | protein_coding | tolerated_low_confidence(0.18) | benign(0.007) | TCGA-AX-A2HC-01 | Endometrium | uterine corpus endometrioid carcinoma | Female | <65 | III/IV | Chemotherapy | paclitaxel | PD | |
| BLCAP | SNV | Missense_Mutation | novel | c.221C>G | p.Pro74Arg | p.P74R | P62952 | protein_coding | tolerated_low_confidence(0.46) | benign(0.007) | TCGA-AX-A3FV-01 | Endometrium | uterine corpus endometrioid carcinoma | Female | <65 | III/IV | Unknown | Unknown | SD |
| BLCAP | SNV | Missense_Mutation | c.84C>A | p.Phe28Leu | p.F28L | P62952 | protein_coding | tolerated(0.2) | probably_damaging(0.992) | TCGA-66-2778-01 | Lung | lung squamous cell carcinoma | Female | >=65 | III/IV | Chemotherapy | cisplatin | CR | |
| BLCAP | SNV | Missense_Mutation | novel | c.250N>A | p.Val84Ile | p.V84I | P62952 | protein_coding | tolerated_low_confidence(1) | benign(0) | TCGA-YL-A8SR-01 | Prostate | prostate adenocarcinoma | Male | <65 | 9 | Unknown | Unknown | SD |
| BLCAP | SNV | Missense_Mutation | c.233N>T | p.Ser78Leu | p.S78L | P62952 | protein_coding | tolerated_low_confidence(0.18) | benign(0.007) | TCGA-D7-A4YU-01 | Stomach | stomach adenocarcinoma | Male | >=65 | III/IV | Chemotherapy | capecitabine | SD |
| Page: 1 |
Top |
Related drugs of malignant transformation related genes |
| Identification of chemicals and drugs interact with genes involved in malignant transfromation |
| (DGIdb 4.0) |
| Entrez ID | Symbol | Category | Interaction Types | Drug Claim Name | Drug Name | PMIDs |
| Page: 1 |

Copyright 2023-Present -The University of Texas Health Science Center at Houston |