
|
|||||
|
 | |
| |
| |
| |
| |
| |
|
Gene: BIVM |
Gene summary for BIVM |
| Gene information | Species | Human | Gene symbol | BIVM | Gene ID | 54841 |
| Gene name | basic, immunoglobulin-like variable motif containing | |
| Gene Alias | BIVM | |
| Cytomap | 13q33.1 | |
| Gene Type | protein-coding | GO ID | GO:0005575 | UniProtAcc | Q86UB2 |
Top |
Malignant transformation analysis |
| Identification of the aberrant gene expression in precancerous and cancerous lesions by comparing the gene expression of stem-like cells in diseased tissues with normal stem cells |
| Entrez ID | Symbol | Replicates | Species | Organ | Tissue | Adj P-value | Log2FC | Malignancy |
| 54841 | BIVM | HTA11_3410_2000001011 | Human | Colorectum | AD | 7.98e-03 | 1.08e-01 | 0.0155 |
| 54841 | BIVM | HTA11_2487_2000001011 | Human | Colorectum | SER | 3.87e-02 | 1.26e-01 | -0.1808 |
| 54841 | BIVM | HTA11_1938_2000001011 | Human | Colorectum | AD | 8.58e-13 | 3.82e-01 | -0.0811 |
| 54841 | BIVM | HTA11_78_2000001011 | Human | Colorectum | AD | 6.85e-15 | 3.72e-01 | -0.1088 |
| 54841 | BIVM | HTA11_347_2000001011 | Human | Colorectum | AD | 1.27e-24 | 4.42e-01 | -0.1954 |
| 54841 | BIVM | HTA11_3361_2000001011 | Human | Colorectum | AD | 5.46e-03 | 1.57e-01 | -0.1207 |
| 54841 | BIVM | HTA11_83_2000001011 | Human | Colorectum | SER | 8.73e-04 | 2.04e-01 | -0.1526 |
| 54841 | BIVM | HTA11_696_2000001011 | Human | Colorectum | AD | 3.83e-12 | 2.54e-01 | -0.1464 |
| 54841 | BIVM | HTA11_866_2000001011 | Human | Colorectum | AD | 9.63e-08 | 1.81e-01 | -0.1001 |
| 54841 | BIVM | HTA11_1391_2000001011 | Human | Colorectum | AD | 5.72e-12 | 2.91e-01 | -0.059 |
| 54841 | BIVM | HTA11_2992_2000001011 | Human | Colorectum | SER | 1.09e-02 | 2.63e-01 | -0.1706 |
| 54841 | BIVM | HTA11_5212_2000001011 | Human | Colorectum | AD | 2.28e-02 | 1.93e-01 | -0.2061 |
| 54841 | BIVM | HTA11_546_2000001011 | Human | Colorectum | AD | 4.83e-05 | 3.33e-01 | -0.0842 |
| 54841 | BIVM | HTA11_7862_2000001011 | Human | Colorectum | AD | 1.12e-06 | 2.70e-01 | -0.0179 |
| 54841 | BIVM | HTA11_866_3004761011 | Human | Colorectum | AD | 9.76e-05 | 1.54e-01 | 0.096 |
| 54841 | BIVM | HTA11_4255_2000001011 | Human | Colorectum | SER | 3.22e-05 | 3.08e-01 | 0.0446 |
| 54841 | BIVM | HTA11_10623_2000001011 | Human | Colorectum | AD | 6.46e-07 | 3.17e-01 | -0.0177 |
| 54841 | BIVM | HTA11_10711_2000001011 | Human | Colorectum | AD | 2.62e-06 | 2.12e-01 | 0.0338 |
| 54841 | BIVM | HTA11_7696_3000711011 | Human | Colorectum | AD | 8.94e-11 | 2.48e-01 | 0.0674 |
| 54841 | BIVM | HTA11_6818_2000001021 | Human | Colorectum | AD | 6.03e-04 | 1.82e-01 | 0.0588 |
| Page: 1 2 |
| Tissue | Expression Dynamics | Abbreviation |
| Colorectum (GSE201348) | 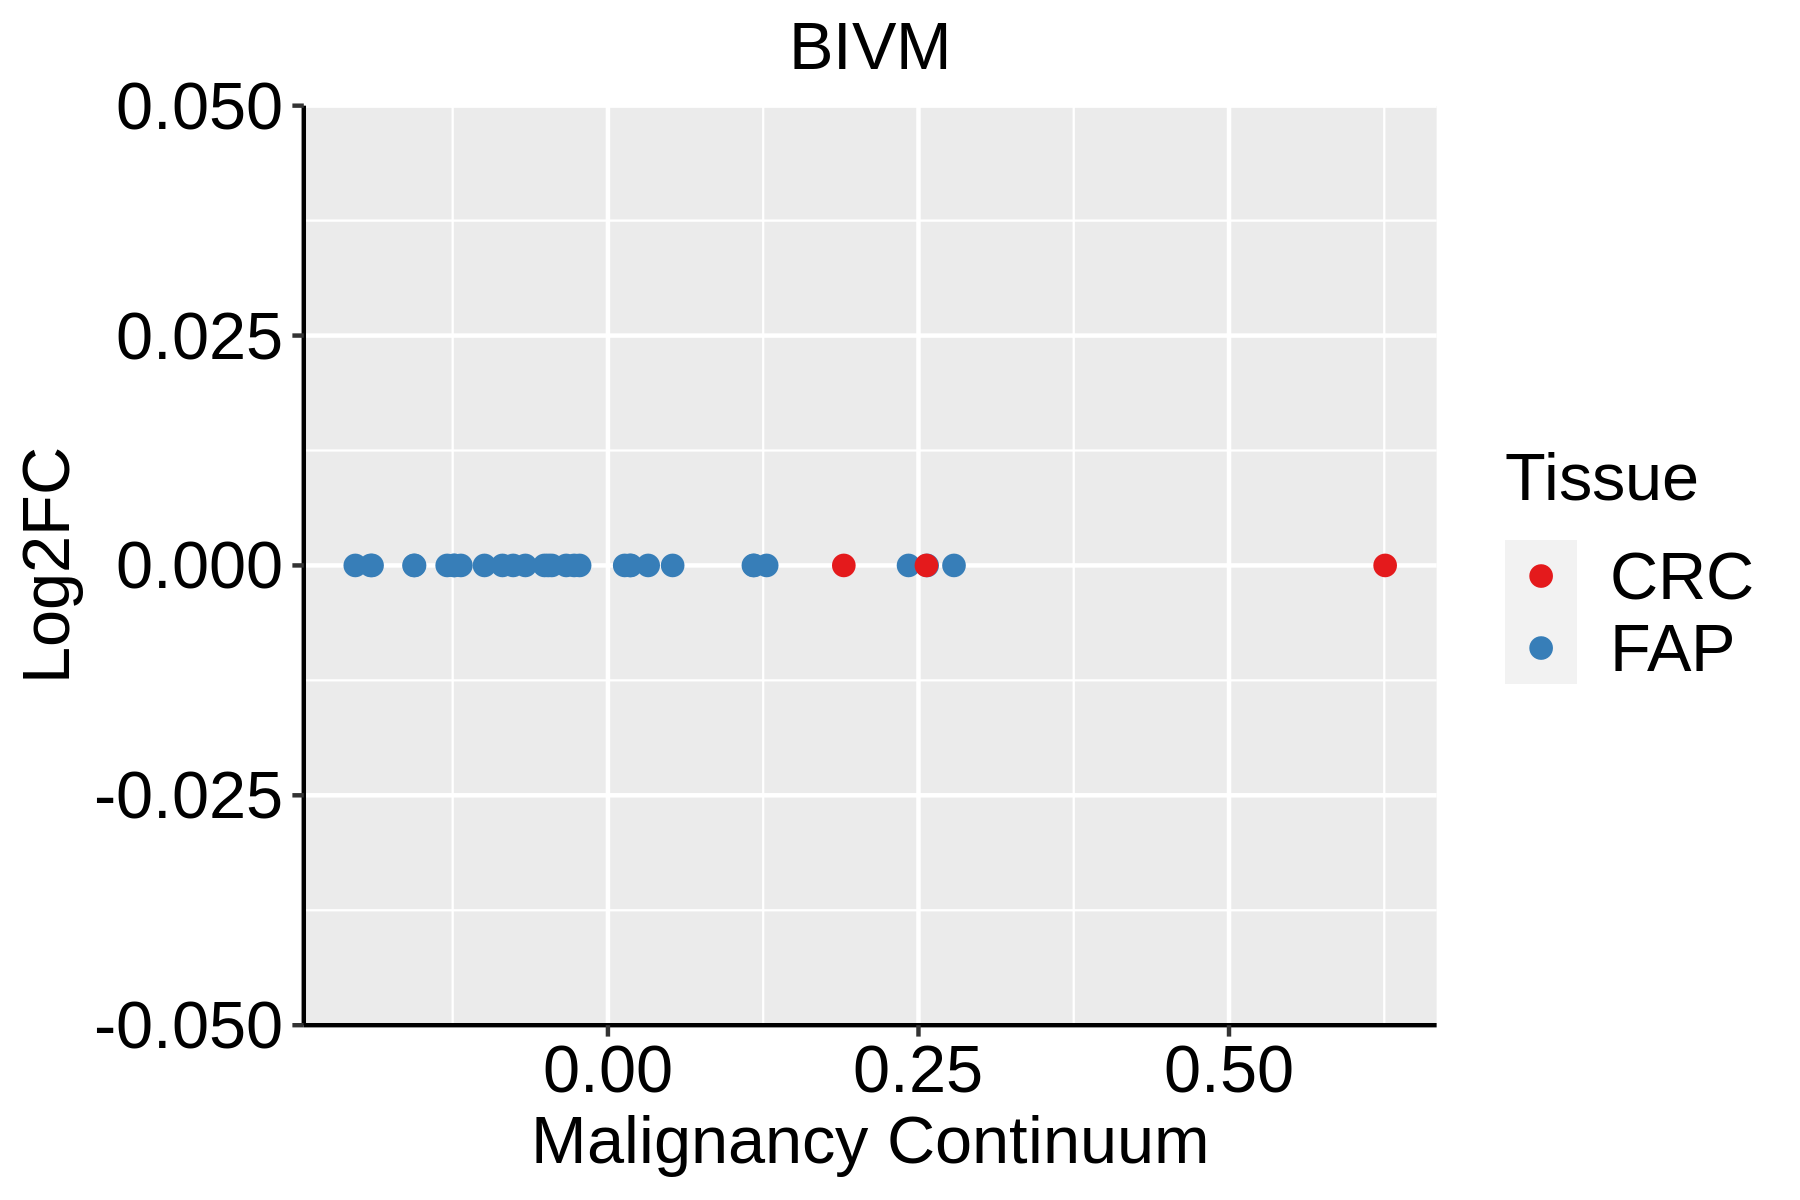 | FAP: Familial adenomatous polyposis |
| CRC: Colorectal cancer | ||
| Colorectum (HTA11) |  | AD: Adenomas |
| SER: Sessile serrated lesions | ||
| MSI-H: Microsatellite-high colorectal cancer | ||
| MSS: Microsatellite stable colorectal cancer | ||
| Liver |  | HCC: Hepatocellular carcinoma |
| NAFLD: Non-alcoholic fatty liver disease |
| ∗log2FC in expression of this searched gene in stem-like cells from each diseased tissue sample relative to stem-like cells in normal samples in each tissue plotted against the malignancy continuum. Samples are colored based on if they are from different disease stage. |
Top |
Malignant transformation related pathway analysis |
| Find out the enriched GO biological processes and KEGG pathways involved in transition from healthy to precancer to cancer |
| Tissue | Disease Stage | Enriched GO biological Processes |
| Colorectum | AD |  |
| Colorectum | SER |  |
| Colorectum | MSS |  |
| Colorectum | MSI-H |  |
| Colorectum | FAP |  |
| ∗Top 15 enriched GO BP terms are showed in the bar plot of each disease state in each tissue. Each row represents a significant GO biological process which is colored according to the -log10(p.adjust). |
| Page: 1 2 3 4 5 6 7 8 9 |
| GO ID | Tissue | Disease Stage | Description | Gene Ratio | Bg Ratio | pvalue | p.adjust | Count |
| Page: 1 |
| Pathway ID | Tissue | Disease Stage | Description | Gene Ratio | Bg Ratio | pvalue | p.adjust | qvalue | Count |
| Page: 1 |
Top |
Cell-cell communication analysis |
| Identification of potential cell-cell interactions between two cell types and their ligand-receptor pairs for different disease states |
| Ligand | Receptor | LRpair | Pathway | Tissue | Disease Stage |
| Page: 1 |
Top |
Single-cell gene regulatory network inference analysis |
| Find out the significant the regulons (TFs) and the target genes of each regulon across cell types for different disease states |
| TF | Cell Type | Tissue | Disease Stage | Target Gene | RSS | Regulon Activity |
| ∗The dot plots of a searched regulon are shown for all cell subpopulations in each disease state of each tissue based on the regulon specific score inferred using pySCENIC and by calculating the average expression. |
| Page: 1 |
Top |
Somatic mutation of malignant transformation related genes |
| Annotation of somatic variants for genes involved in malignant transformation |
| Hugo Symbol | Variant Class | Variant Classification | dbSNP RS | HGVSc | HGVSp | HGVSp Short | SWISSPROT | BIOTYPE | SIFT | PolyPhen | Tumor Sample Barcode | Tissue | Histology | Sex | Age | Stage | Therapy Types | Drugs | Outcome |
| BIVM | SNV | Missense_Mutation | novel | c.706C>G | p.Pro236Ala | p.P236A | Q86UB2 | protein_coding | tolerated(0.07) | probably_damaging(0.997) | TCGA-A2-A0YK-01 | Breast | breast invasive carcinoma | Female | <65 | I/II | Chemotherapy | cytoxan | SD |
| BIVM | SNV | Missense_Mutation | c.235G>T | p.Ala79Ser | p.A79S | Q86UB2 | protein_coding | deleterious_low_confidence(0) | possibly_damaging(0.52) | TCGA-E9-A1RF-01 | Breast | breast invasive carcinoma | Female | >=65 | III/IV | Hormone Therapy | tamoxiphen | SD | |
| BIVM | SNV | Missense_Mutation | novel | c.1498G>A | p.Asp500Asn | p.D500N | Q86UB2 | protein_coding | tolerated_low_confidence(0.37) | benign(0.001) | TCGA-2W-A8YY-01 | Cervix | cervical & endocervical cancer | Female | <65 | I/II | Chemotherapy | cisplatin | CR |
| BIVM | SNV | Missense_Mutation | c.487A>G | p.Lys163Glu | p.K163E | Q86UB2 | protein_coding | deleterious(0.04) | benign(0.385) | TCGA-EA-A3HT-01 | Cervix | cervical & endocervical cancer | Female | >=65 | I/II | Unknown | Unknown | SD | |
| BIVM | SNV | Missense_Mutation | c.430G>C | p.Asp144His | p.D144H | Q86UB2 | protein_coding | deleterious(0) | probably_damaging(0.999) | TCGA-LP-A5U2-01 | Cervix | cervical & endocervical cancer | Female | <65 | III/IV | Unknown | Unknown | SD | |
| BIVM | SNV | Missense_Mutation | rs764054526 | c.262N>G | p.Pro88Ala | p.P88A | Q86UB2 | protein_coding | tolerated_low_confidence(1) | benign(0) | TCGA-VS-A9UH-01 | Cervix | cervical & endocervical cancer | Female | <65 | I/II | Chemotherapy | cisplatin | CR |
| BIVM | SNV | Missense_Mutation | c.65N>C | p.Arg22Thr | p.R22T | Q86UB2 | protein_coding | tolerated_low_confidence(0.26) | benign(0) | TCGA-AA-3492-01 | Colorectum | colon adenocarcinoma | Female | >=65 | I/II | Unknown | Unknown | SD | |
| BIVM | SNV | Missense_Mutation | c.1040N>A | p.Gly347Glu | p.G347E | Q86UB2 | protein_coding | tolerated(0.18) | possibly_damaging(0.817) | TCGA-AA-3811-01 | Colorectum | colon adenocarcinoma | Female | >=65 | III/IV | Unknown | Unknown | PD | |
| BIVM | SNV | Missense_Mutation | novel | c.521A>C | p.Lys174Thr | p.K174T | Q86UB2 | protein_coding | tolerated(0.06) | benign(0.381) | TCGA-AA-3984-01 | Colorectum | colon adenocarcinoma | Female | <65 | I/II | Unknown | Unknown | SD |
| BIVM | SNV | Missense_Mutation | c.1324N>G | p.Pro442Ala | p.P442A | Q86UB2 | protein_coding | tolerated_low_confidence(0.26) | benign(0.003) | TCGA-AA-A004-01 | Colorectum | colon adenocarcinoma | Male | >=65 | I/II | Unknown | Unknown | SD |
| Page: 1 2 3 4 5 6 7 8 |
Top |
Related drugs of malignant transformation related genes |
| Identification of chemicals and drugs interact with genes involved in malignant transfromation |
| (DGIdb 4.0) |
| Entrez ID | Symbol | Category | Interaction Types | Drug Claim Name | Drug Name | PMIDs |
| Page: 1 |

Copyright 2023-Present -The University of Texas Health Science Center at Houston |