
|
|||||
|
 | |
| |
| |
| |
| |
| |
|
Gene: BIRC3 |
Gene summary for BIRC3 |
| Gene information | Species | Human | Gene symbol | BIRC3 | Gene ID | 330 |
| Gene name | baculoviral IAP repeat containing 3 | |
| Gene Alias | AIP1 | |
| Cytomap | 11q22.2 | |
| Gene Type | protein-coding | GO ID | GO:0000003 | UniProtAcc | Q13489 |
Top |
Malignant transformation analysis |
| Identification of the aberrant gene expression in precancerous and cancerous lesions by comparing the gene expression of stem-like cells in diseased tissues with normal stem cells |
| Entrez ID | Symbol | Replicates | Species | Organ | Tissue | Adj P-value | Log2FC | Malignancy |
| 330 | BIRC3 | GSM4909281 | Human | Breast | IDC | 8.09e-21 | -6.13e-01 | 0.21 |
| 330 | BIRC3 | GSM4909282 | Human | Breast | IDC | 3.39e-07 | -4.62e-01 | -0.0288 |
| 330 | BIRC3 | GSM4909285 | Human | Breast | IDC | 1.16e-12 | -6.05e-01 | 0.21 |
| 330 | BIRC3 | GSM4909286 | Human | Breast | IDC | 2.73e-28 | -6.41e-01 | 0.1081 |
| 330 | BIRC3 | GSM4909290 | Human | Breast | IDC | 4.91e-13 | -6.01e-01 | 0.2096 |
| 330 | BIRC3 | GSM4909291 | Human | Breast | IDC | 4.48e-11 | -6.02e-01 | 0.1753 |
| 330 | BIRC3 | GSM4909293 | Human | Breast | IDC | 1.00e-16 | -5.82e-01 | 0.1581 |
| 330 | BIRC3 | GSM4909294 | Human | Breast | IDC | 8.02e-19 | -5.79e-01 | 0.2022 |
| 330 | BIRC3 | GSM4909296 | Human | Breast | IDC | 2.46e-15 | -5.71e-01 | 0.1524 |
| 330 | BIRC3 | GSM4909297 | Human | Breast | IDC | 1.25e-20 | -6.04e-01 | 0.1517 |
| 330 | BIRC3 | GSM4909298 | Human | Breast | IDC | 1.13e-13 | -5.47e-01 | 0.1551 |
| 330 | BIRC3 | GSM4909301 | Human | Breast | IDC | 1.32e-20 | -6.23e-01 | 0.1577 |
| 330 | BIRC3 | GSM4909302 | Human | Breast | IDC | 3.96e-09 | -4.92e-01 | 0.1545 |
| 330 | BIRC3 | GSM4909304 | Human | Breast | IDC | 4.38e-24 | -6.23e-01 | 0.1636 |
| 330 | BIRC3 | GSM4909306 | Human | Breast | IDC | 1.29e-18 | -5.81e-01 | 0.1564 |
| 330 | BIRC3 | GSM4909307 | Human | Breast | IDC | 5.38e-22 | -6.26e-01 | 0.1569 |
| 330 | BIRC3 | GSM4909308 | Human | Breast | IDC | 2.08e-12 | -5.65e-01 | 0.158 |
| 330 | BIRC3 | GSM4909309 | Human | Breast | IDC | 7.74e-09 | -5.15e-01 | 0.0483 |
| 330 | BIRC3 | GSM4909311 | Human | Breast | IDC | 6.10e-23 | -6.26e-01 | 0.1534 |
| 330 | BIRC3 | GSM4909312 | Human | Breast | IDC | 1.11e-28 | -6.37e-01 | 0.1552 |
| Page: 1 2 3 4 5 6 7 8 9 |
| Tissue | Expression Dynamics | Abbreviation |
| Breast | 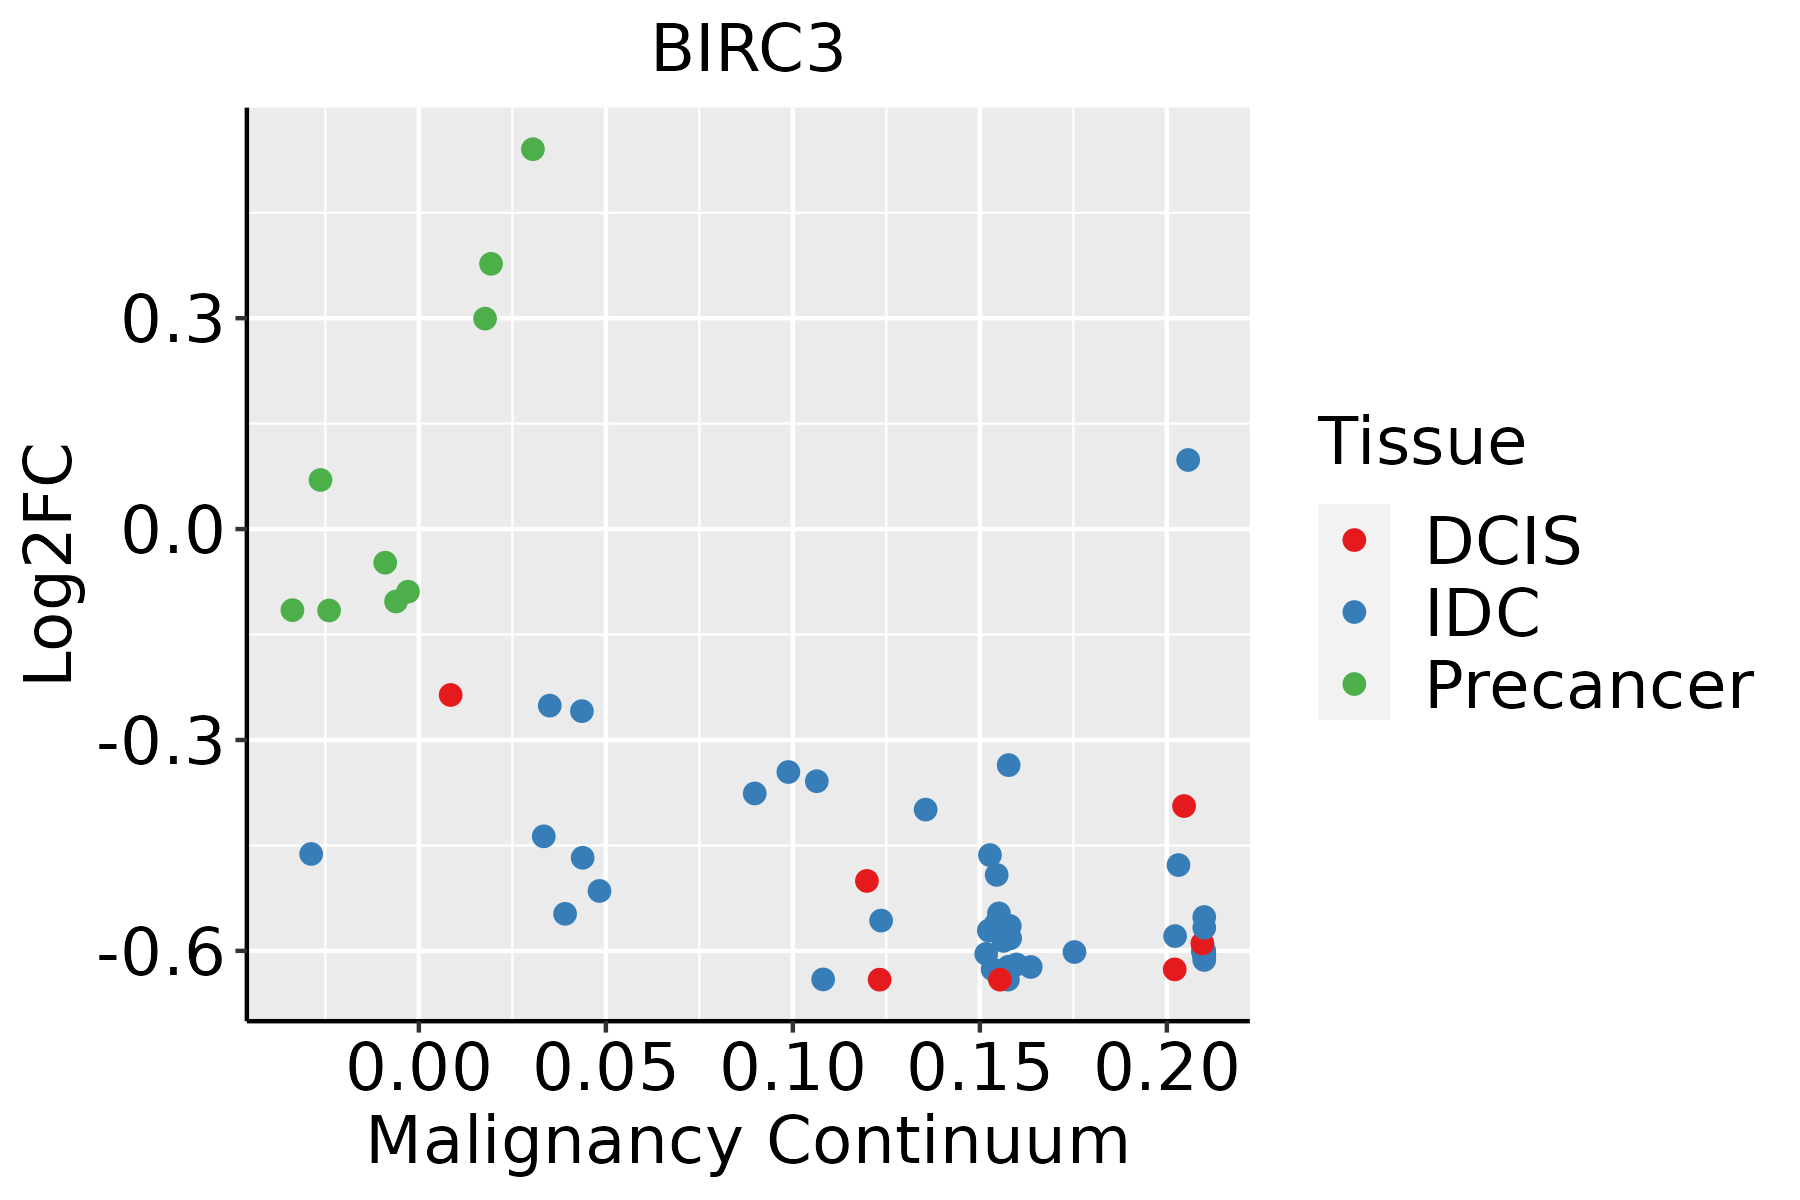 | IDC: Invasive ductal carcinoma |
| DCIS: Ductal carcinoma in situ | ||
| Precancer(BRCA1-mut): Precancerous lesion from BRCA1 mutation carriers | ||
| Cervix | 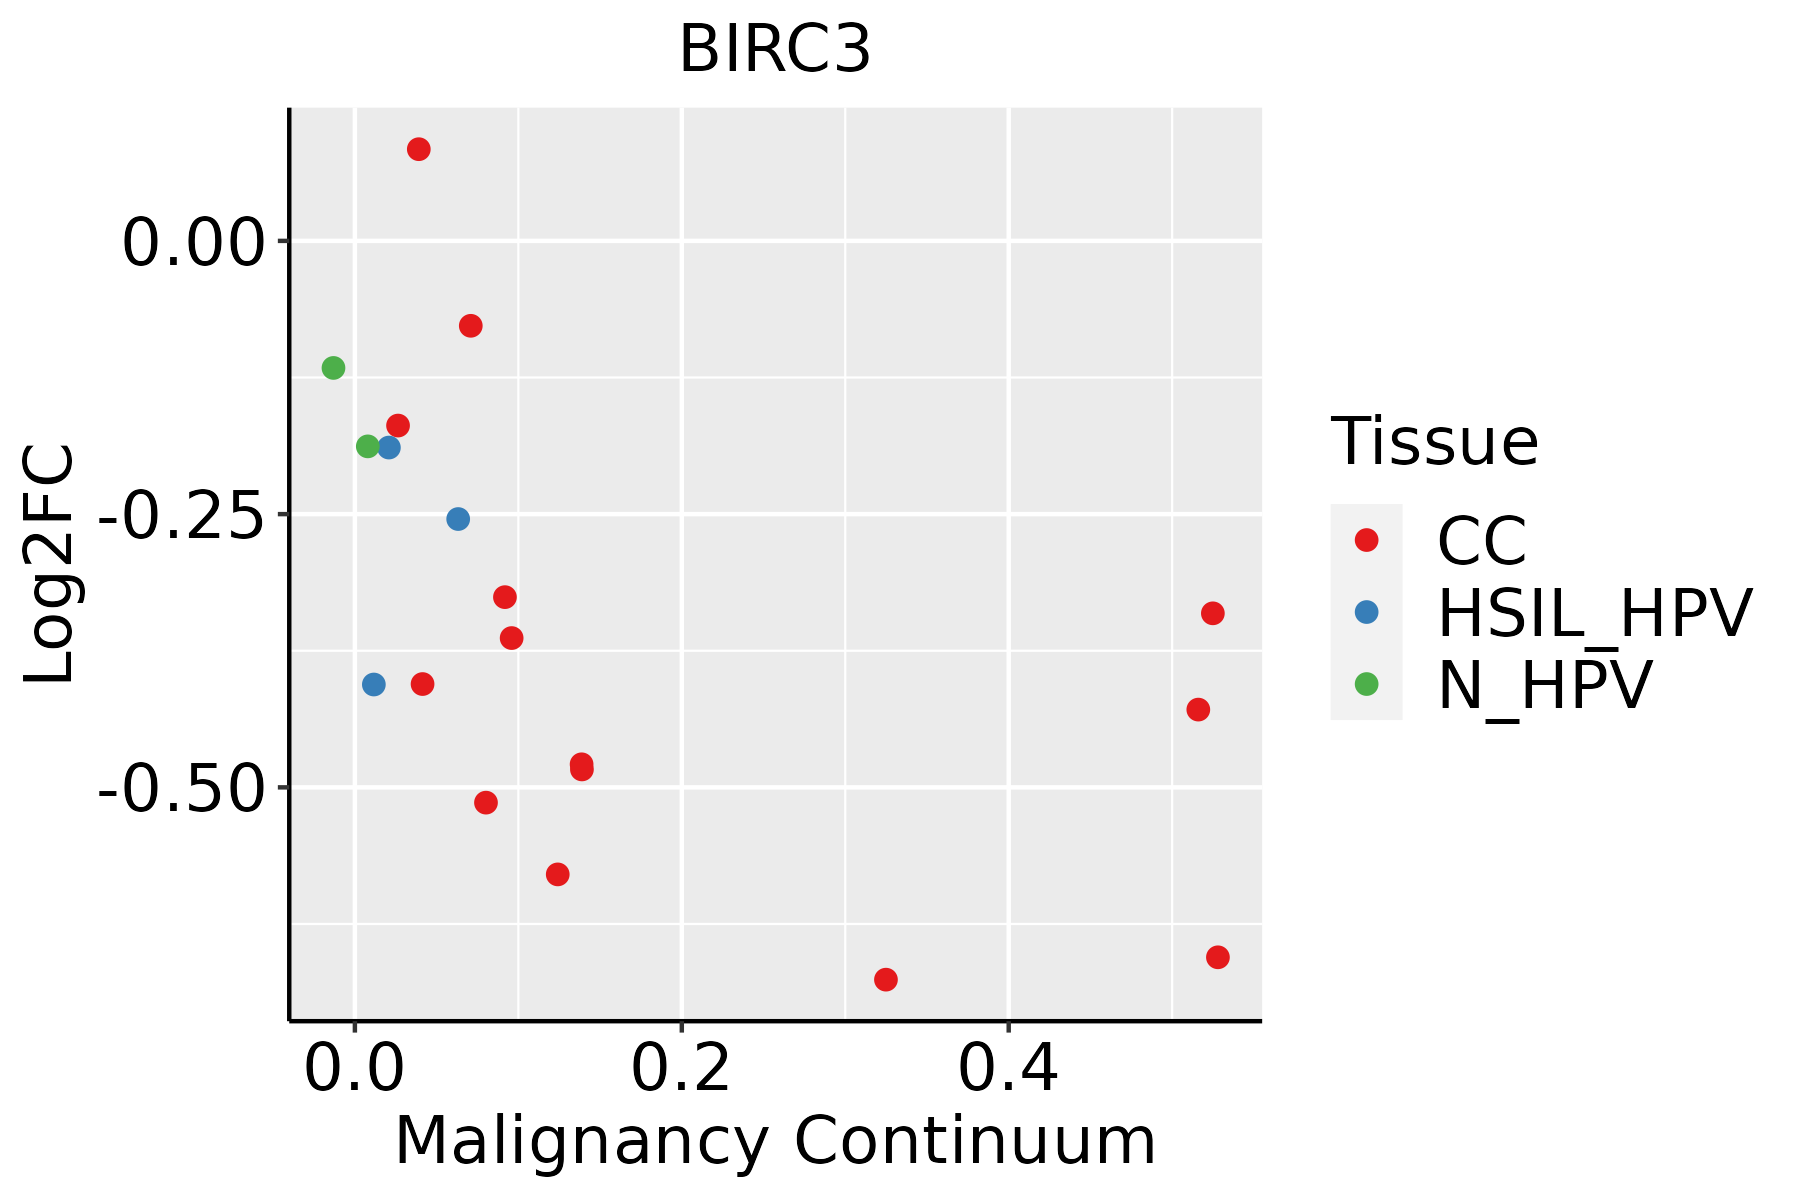 | CC: Cervix cancer |
| HSIL_HPV: HPV-infected high-grade squamous intraepithelial lesions | ||
| N_HPV: HPV-infected normal cervix | ||
| Endometrium | 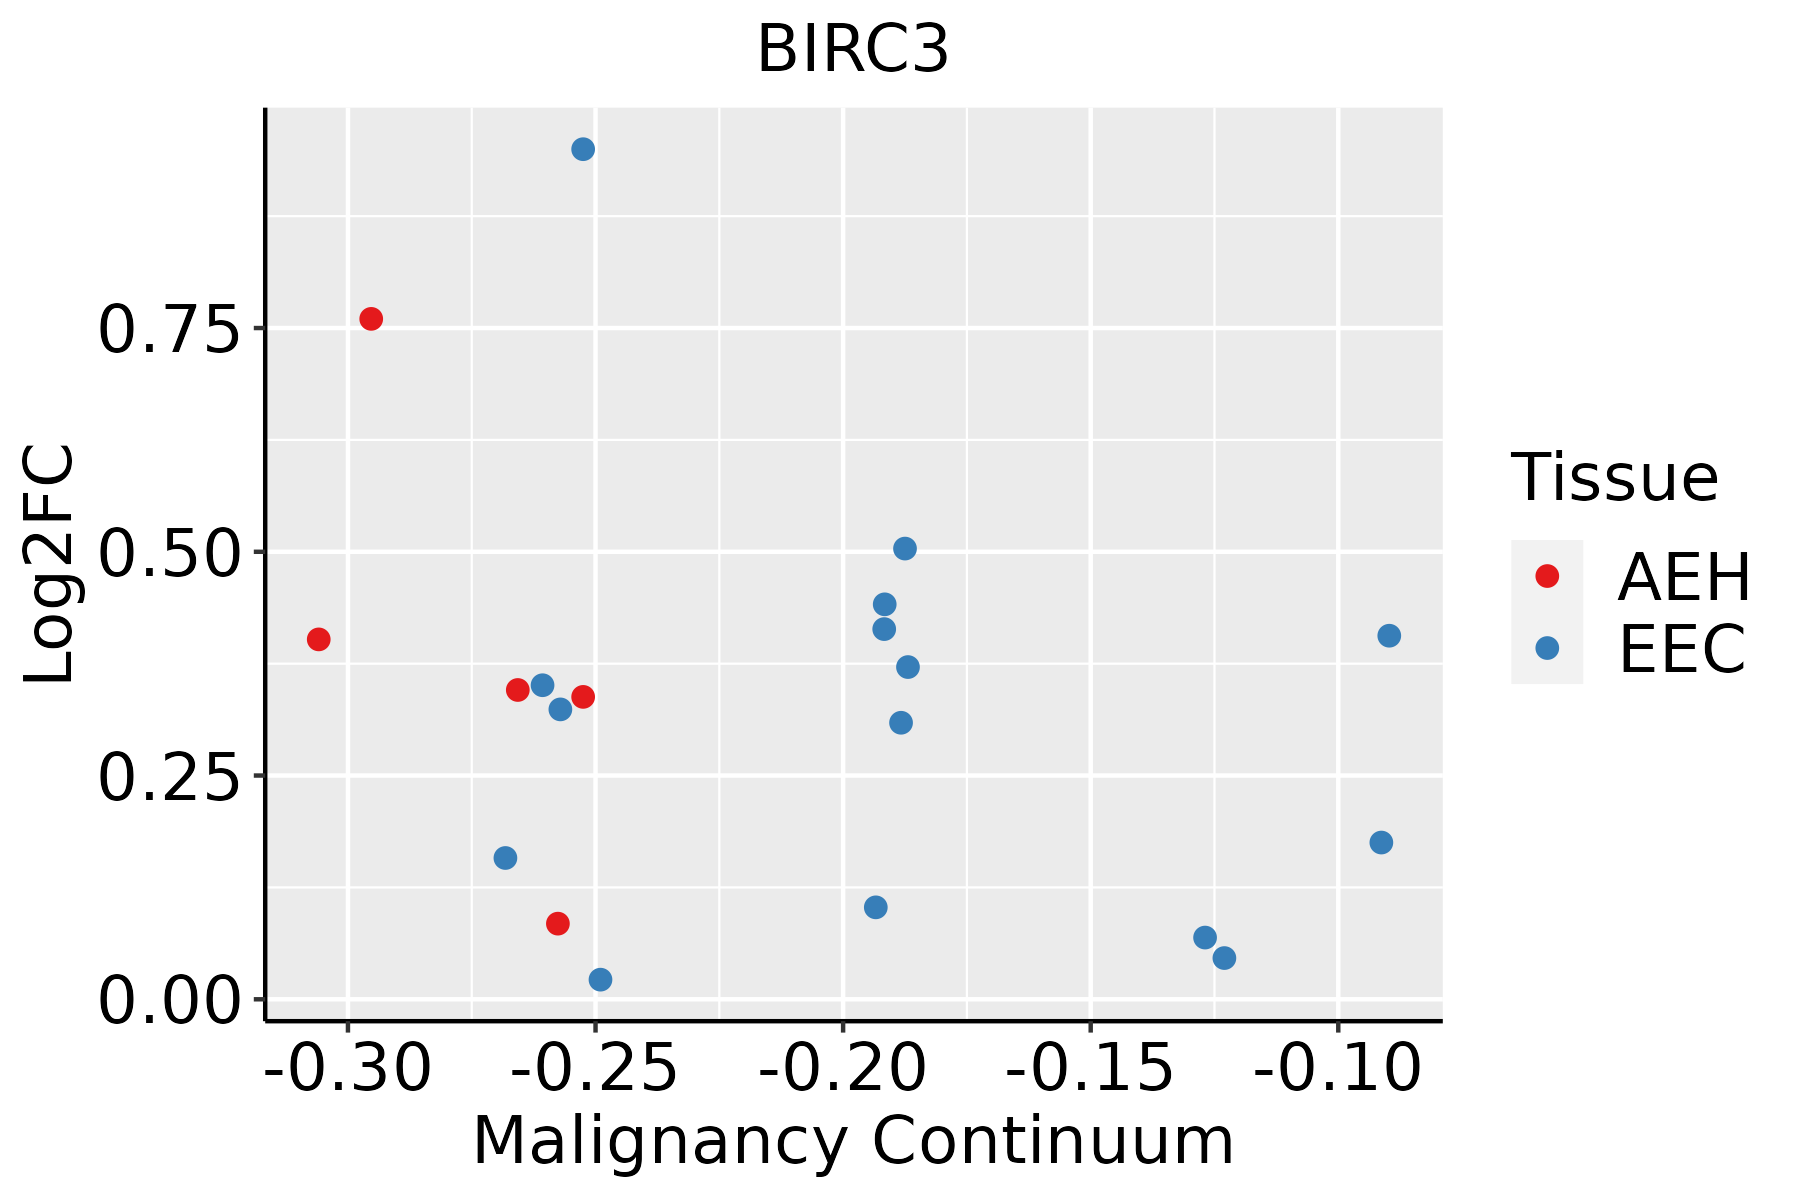 | AEH: Atypical endometrial hyperplasia |
| EEC: Endometrioid Cancer | ||
| Esophagus | 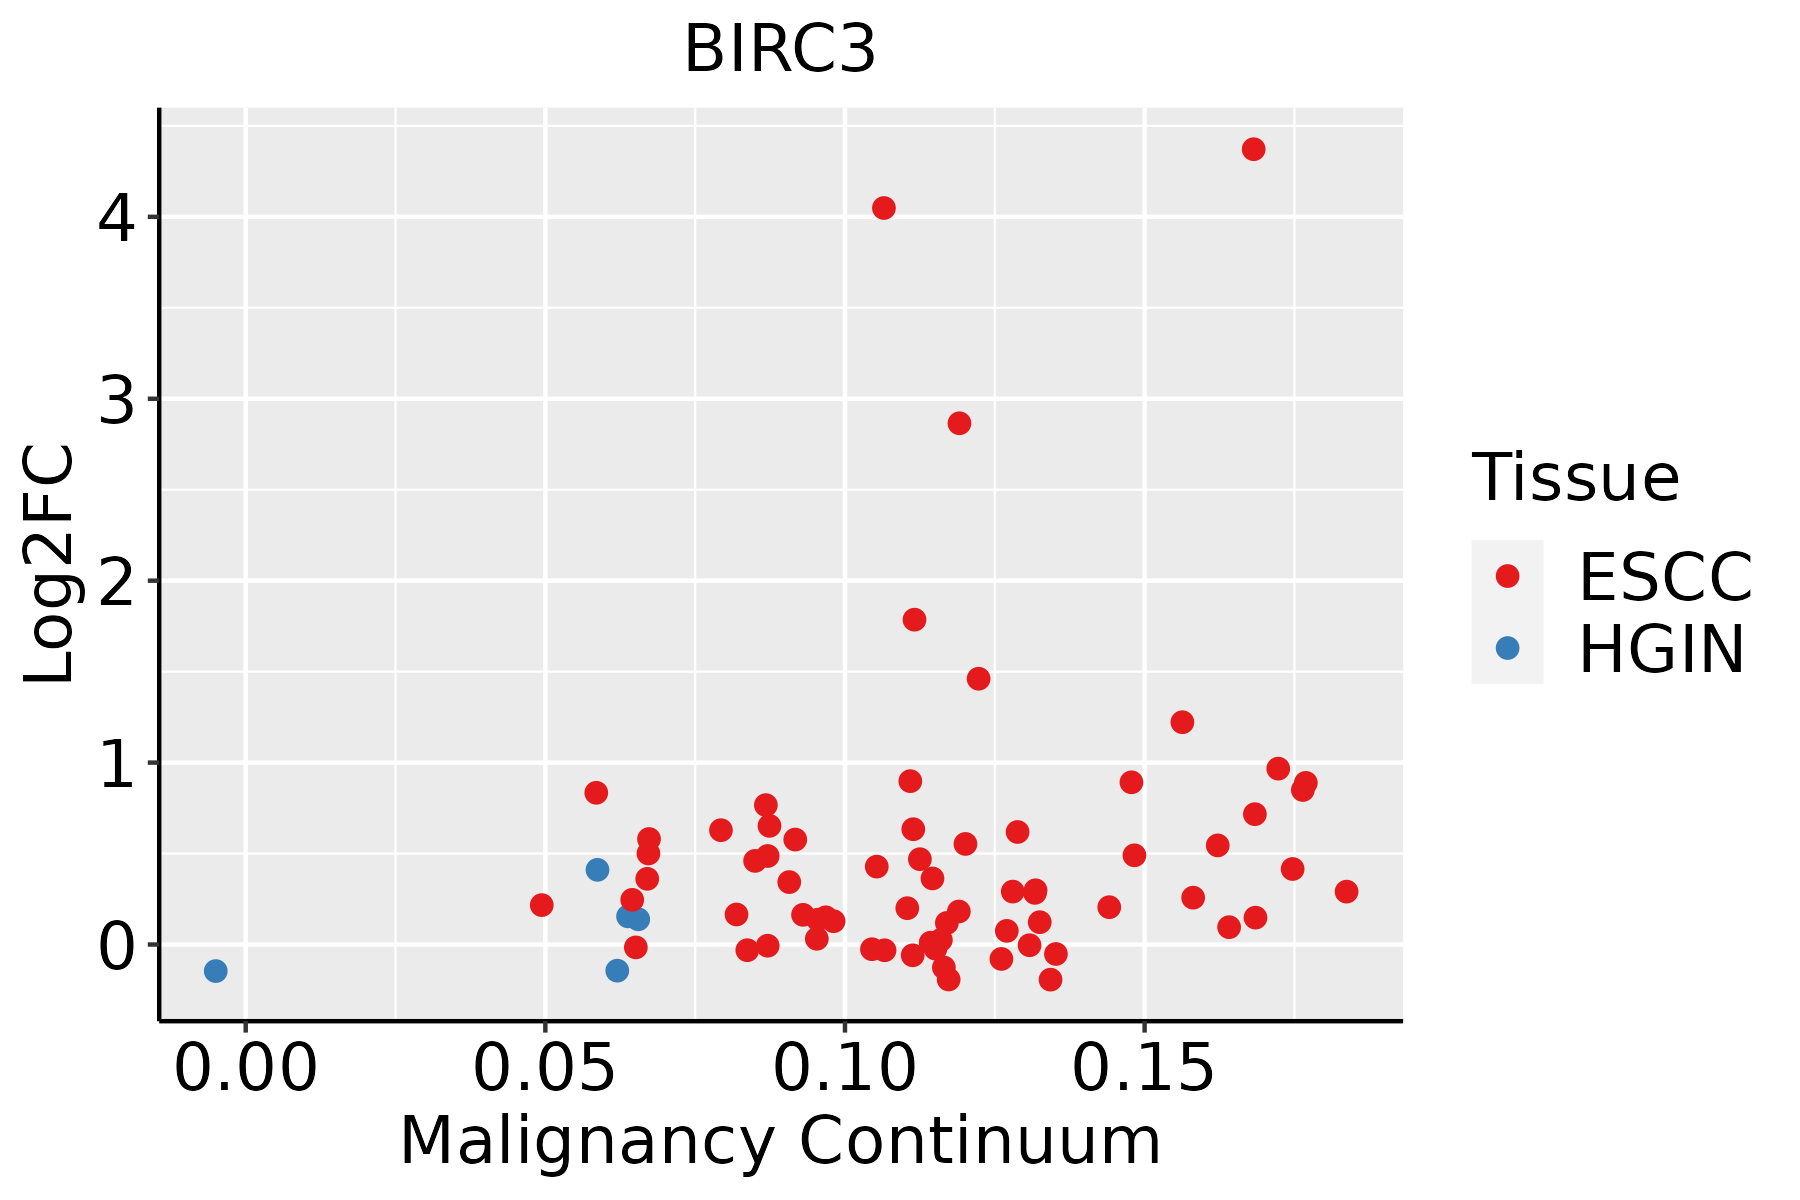 | ESCC: Esophageal squamous cell carcinoma |
| HGIN: High-grade intraepithelial neoplasias | ||
| LGIN: Low-grade intraepithelial neoplasias | ||
| GC | 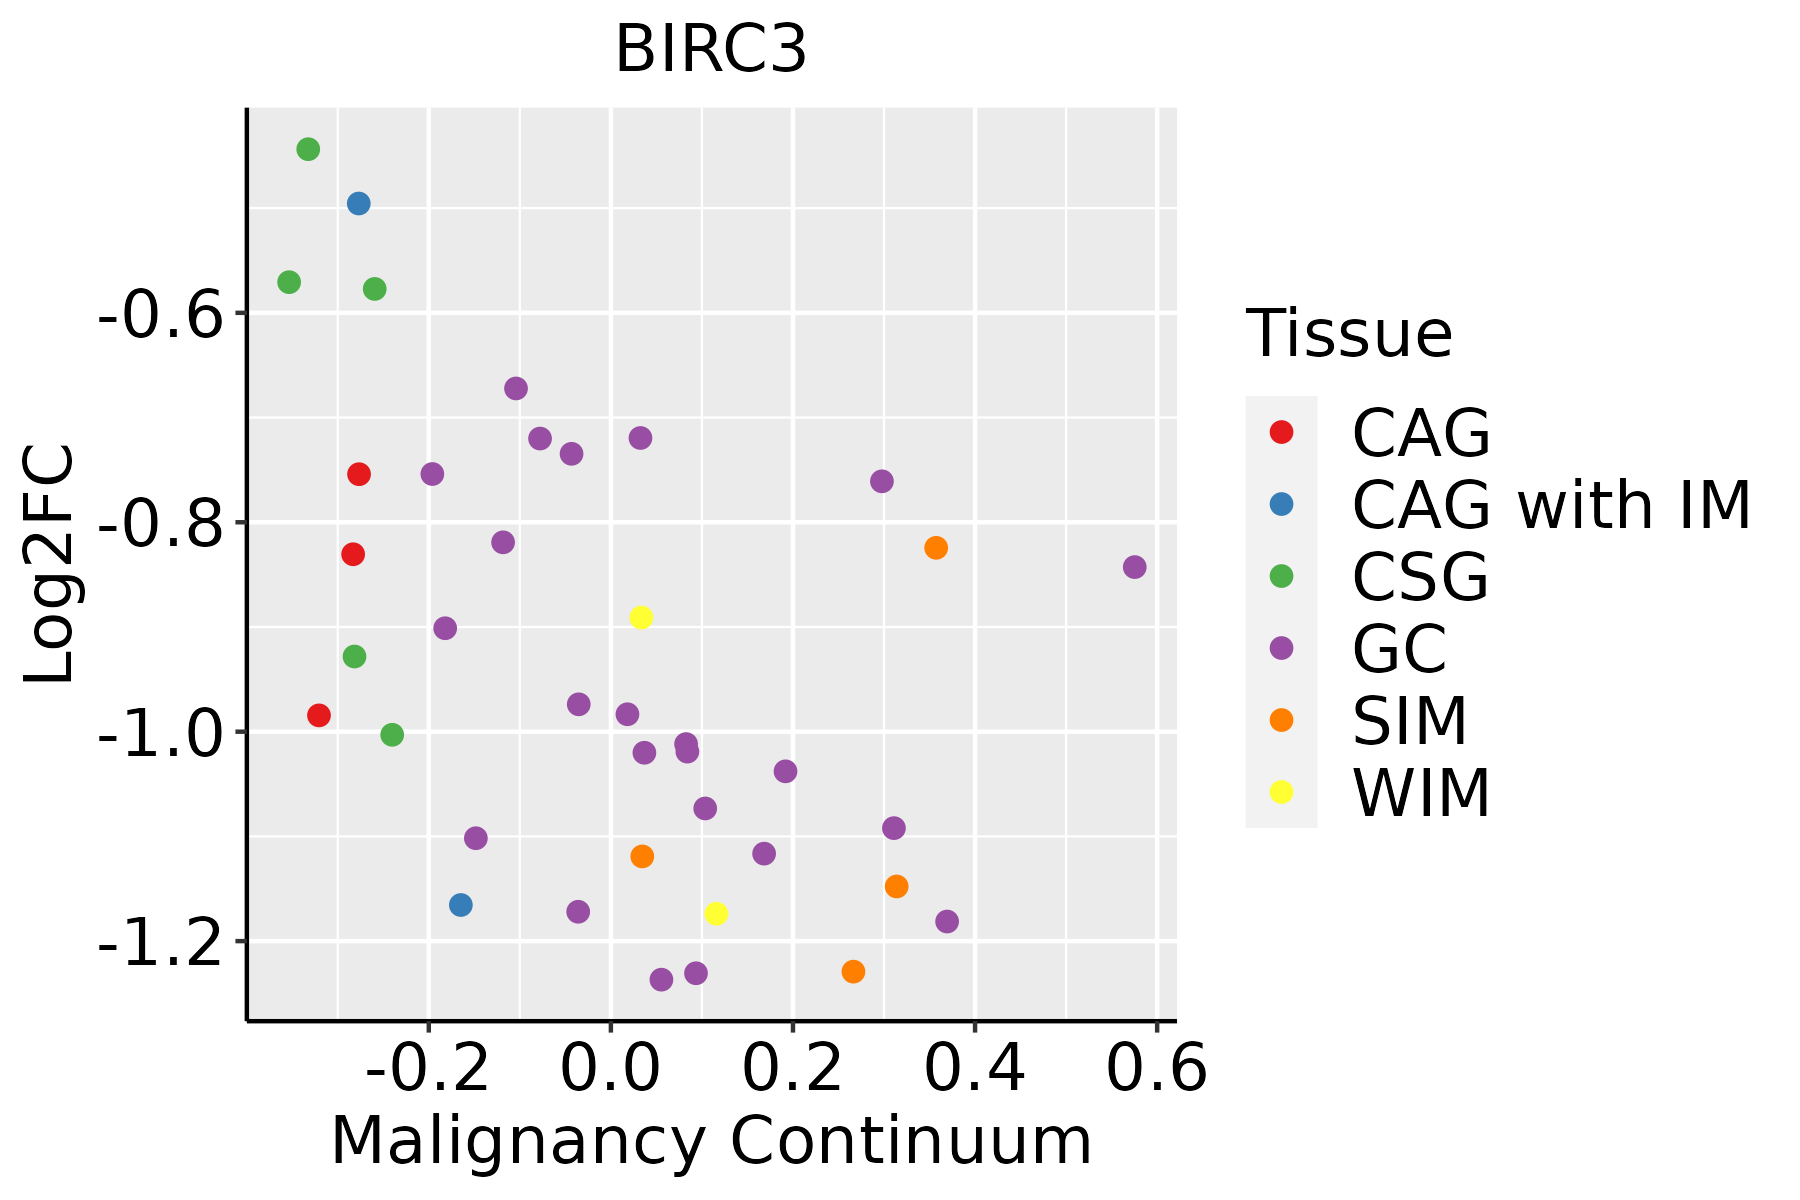 | CAG: Chronic atrophic gastritis |
| CAG with IM: Chronic atrophic gastritis with intestinal metaplasia | ||
| CSG: Chronic superficial gastritis | ||
| GC: Gastric cancer | ||
| SIM: Severe intestinal metaplasia | ||
| WIM: Wild intestinal metaplasia | ||
| Liver | 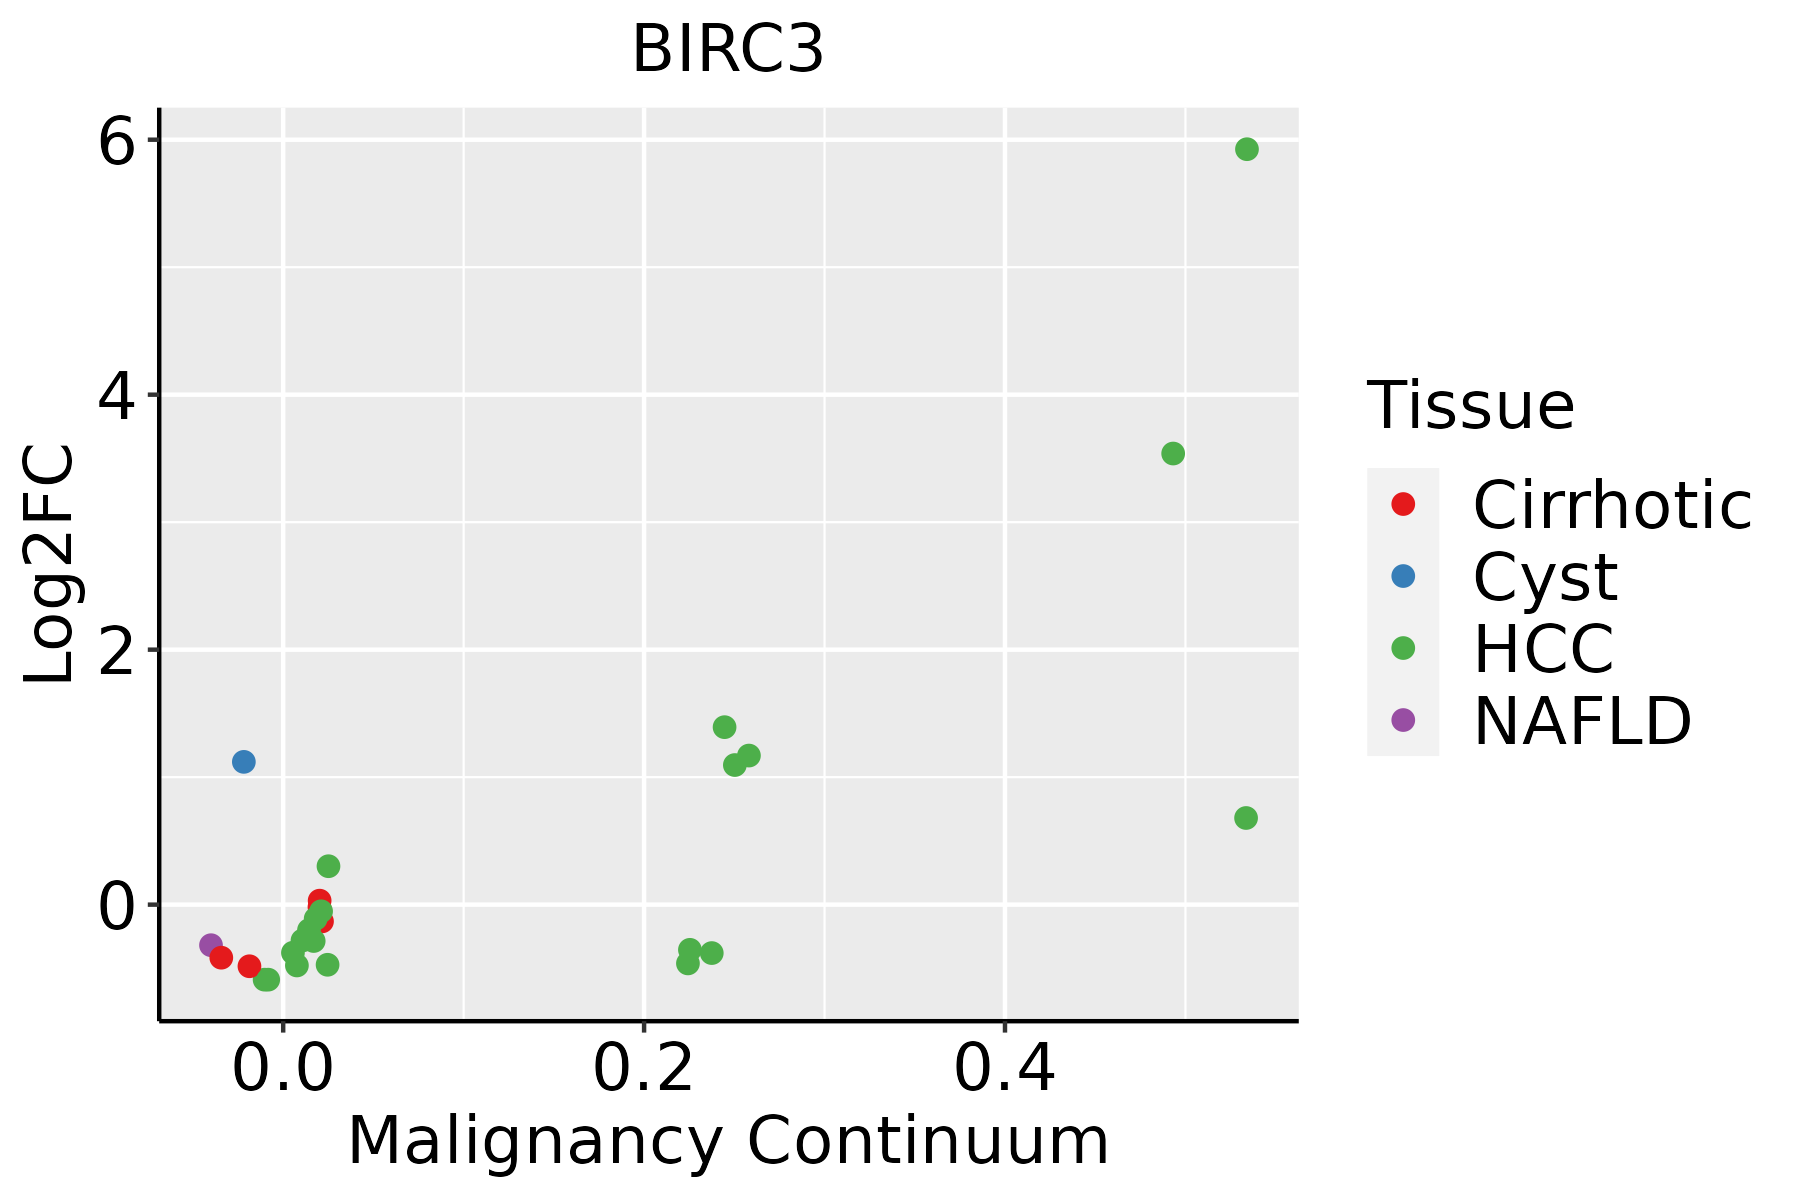 | HCC: Hepatocellular carcinoma |
| NAFLD: Non-alcoholic fatty liver disease | ||
| Oral Cavity | 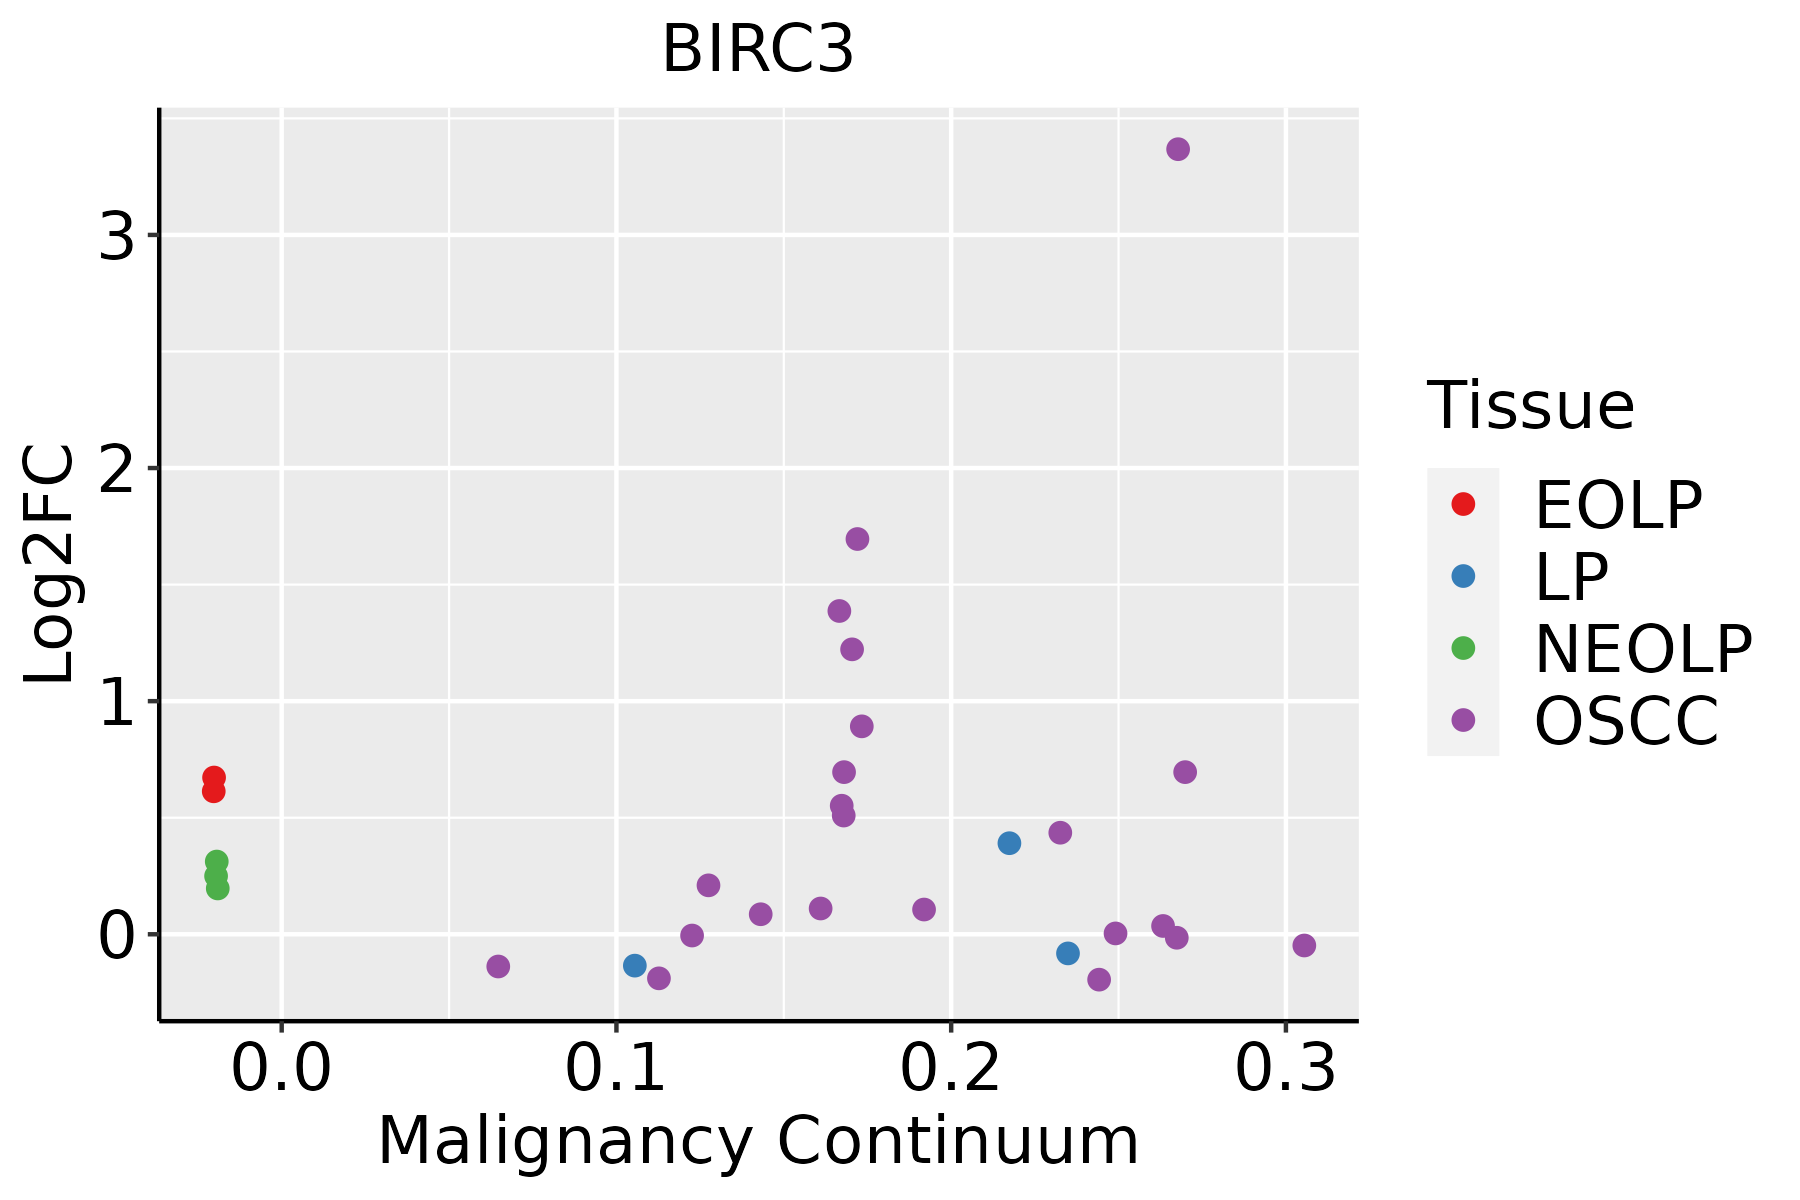 | EOLP: Erosive Oral lichen planus |
| LP: leukoplakia | ||
| NEOLP: Non-erosive oral lichen planus | ||
| OSCC: Oral squamous cell carcinoma | ||
| Prostate |  | BPH: Benign Prostatic Hyperplasia |
| Thyroid | 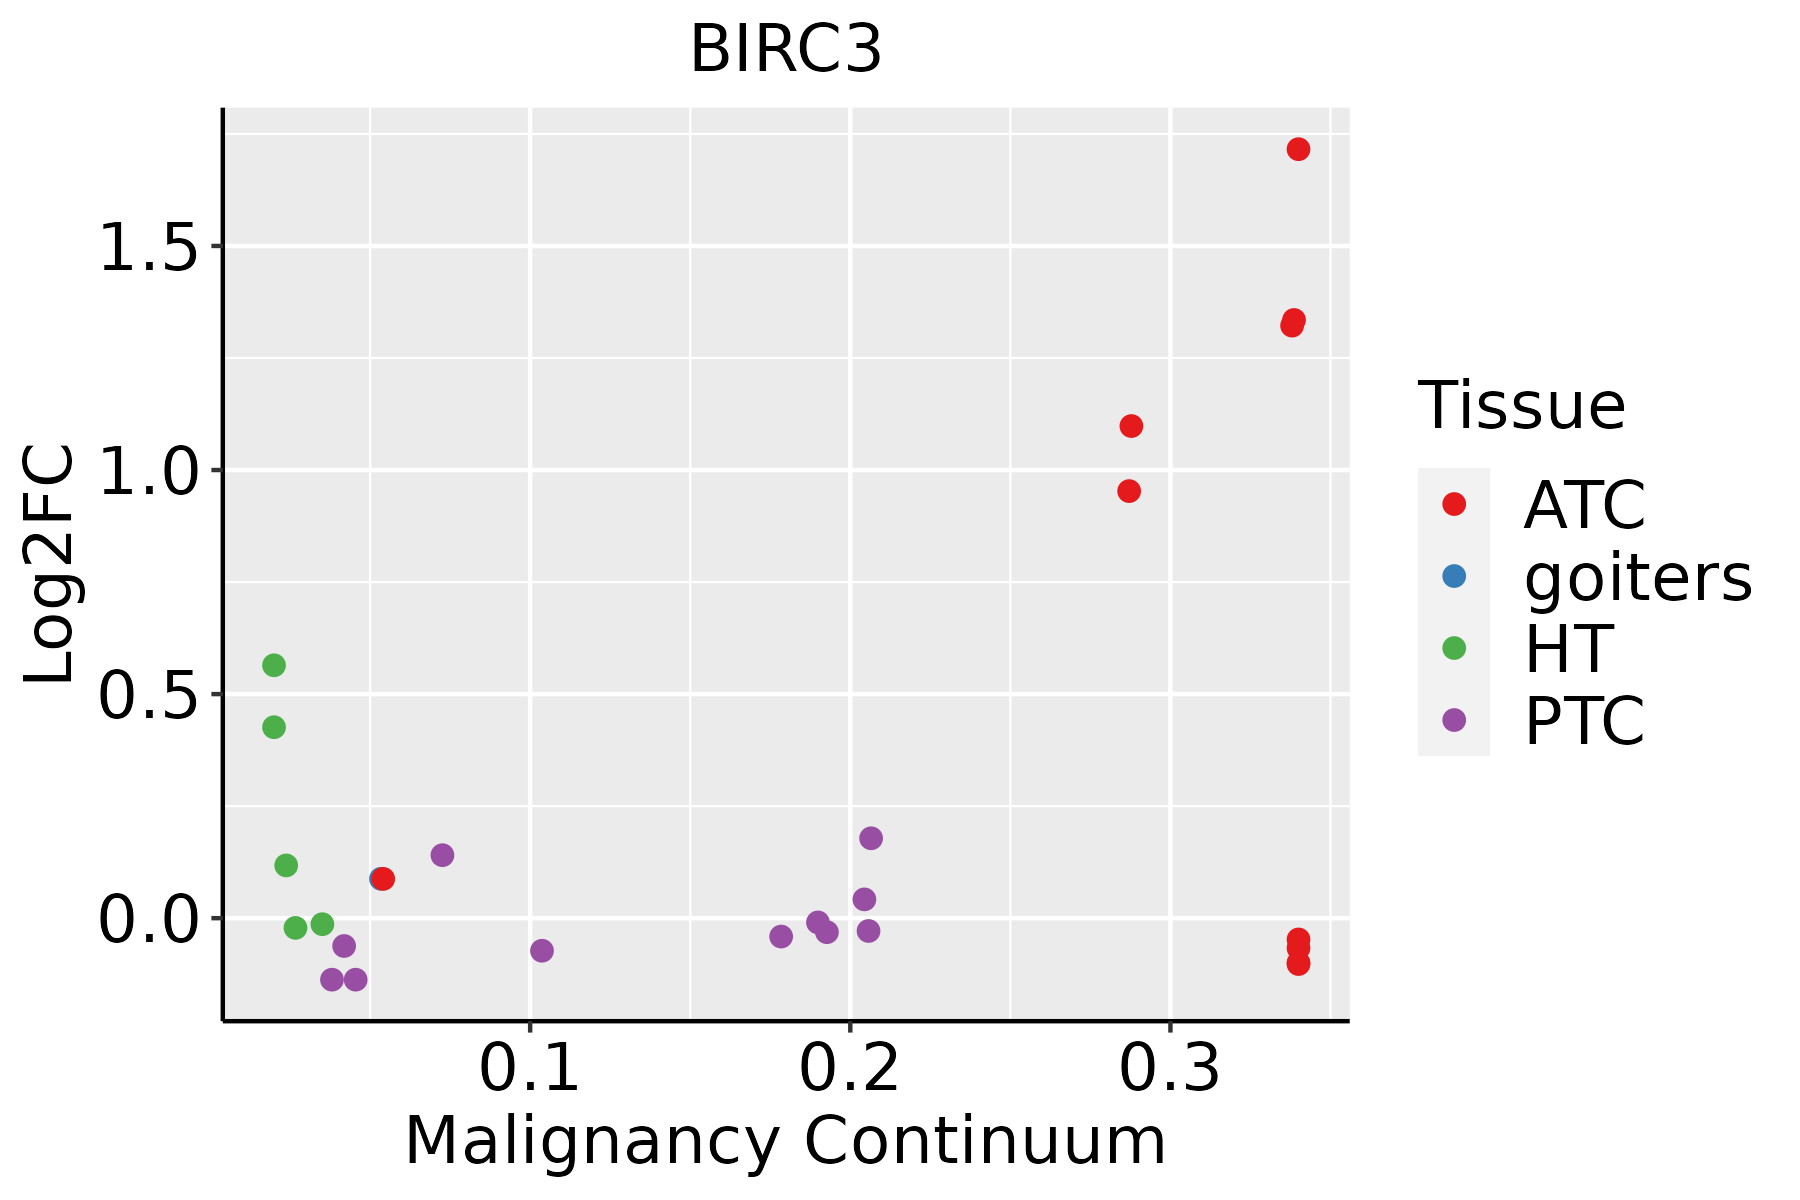 | ATC: Anaplastic thyroid cancer |
| HT: Hashimoto's thyroiditis | ||
| PTC: Papillary thyroid cancer |
| ∗log2FC in expression of this searched gene in stem-like cells from each diseased tissue sample relative to stem-like cells in normal samples in each tissue plotted against the malignancy continuum. Samples are colored based on if they are from different disease stage. |
Top |
Malignant transformation related pathway analysis |
| Find out the enriched GO biological processes and KEGG pathways involved in transition from healthy to precancer to cancer |
| Tissue | Disease Stage | Enriched GO biological Processes |
| Colorectum | AD |  |
| Colorectum | SER |  |
| Colorectum | MSS |  |
| Colorectum | MSI-H |  |
| Colorectum | FAP |  |
| ∗Top 15 enriched GO BP terms are showed in the bar plot of each disease state in each tissue. Each row represents a significant GO biological process which is colored according to the -log10(p.adjust). |
| Page: 1 2 3 4 5 6 7 8 9 |
| GO ID | Tissue | Disease Stage | Description | Gene Ratio | Bg Ratio | pvalue | p.adjust | Count |
| GO:00525479 | Breast | Precancer | regulation of peptidase activity | 71/1080 | 461/18723 | 2.72e-14 | 6.94e-12 | 71 |
| GO:00525489 | Breast | Precancer | regulation of endopeptidase activity | 67/1080 | 432/18723 | 1.06e-13 | 2.36e-11 | 67 |
| GO:20001169 | Breast | Precancer | regulation of cysteine-type endopeptidase activity | 43/1080 | 235/18723 | 1.30e-11 | 1.83e-09 | 43 |
| GO:00432819 | Breast | Precancer | regulation of cysteine-type endopeptidase activity involved in apoptotic process | 40/1080 | 209/18723 | 1.59e-11 | 2.07e-09 | 40 |
| GO:00458619 | Breast | Precancer | negative regulation of proteolysis | 50/1080 | 351/18723 | 2.99e-09 | 2.39e-07 | 50 |
| GO:19033209 | Breast | Precancer | regulation of protein modification by small protein conjugation or removal | 38/1080 | 242/18723 | 1.71e-08 | 1.17e-06 | 38 |
| GO:00513468 | Breast | Precancer | negative regulation of hydrolase activity | 50/1080 | 379/18723 | 3.85e-08 | 2.34e-06 | 50 |
| GO:00313969 | Breast | Precancer | regulation of protein ubiquitination | 33/1080 | 210/18723 | 1.45e-07 | 7.82e-06 | 33 |
| GO:00104668 | Breast | Precancer | negative regulation of peptidase activity | 38/1080 | 262/18723 | 1.46e-07 | 7.82e-06 | 38 |
| GO:00109519 | Breast | Precancer | negative regulation of endopeptidase activity | 37/1080 | 252/18723 | 1.55e-07 | 8.05e-06 | 37 |
| GO:20001179 | Breast | Precancer | negative regulation of cysteine-type endopeptidase activity | 19/1080 | 86/18723 | 3.36e-07 | 1.58e-05 | 19 |
| GO:00431548 | Breast | Precancer | negative regulation of cysteine-type endopeptidase activity involved in apoptotic process | 17/1080 | 78/18723 | 1.69e-06 | 6.08e-05 | 17 |
| GO:0050727 | Breast | Precancer | regulation of inflammatory response | 44/1080 | 386/18723 | 1.26e-05 | 3.22e-04 | 44 |
| GO:00713568 | Breast | Precancer | cellular response to tumor necrosis factor | 28/1080 | 229/18723 | 1.42e-04 | 2.45e-03 | 28 |
| GO:00346128 | Breast | Precancer | response to tumor necrosis factor | 29/1080 | 253/18723 | 3.32e-04 | 4.70e-03 | 29 |
| GO:0010939 | Breast | Precancer | regulation of necrotic cell death | 9/1080 | 42/18723 | 5.42e-04 | 6.97e-03 | 9 |
| GO:0070265 | Breast | Precancer | necrotic cell death | 11/1080 | 62/18723 | 7.54e-04 | 9.01e-03 | 11 |
| GO:00305228 | Breast | Precancer | intracellular receptor signaling pathway | 27/1080 | 265/18723 | 2.99e-03 | 2.57e-02 | 27 |
| GO:00072496 | Breast | Precancer | I-kappaB kinase/NF-kappaB signaling | 27/1080 | 281/18723 | 6.58e-03 | 4.53e-02 | 27 |
| GO:005254714 | Breast | IDC | regulation of peptidase activity | 96/1434 | 461/18723 | 7.58e-20 | 6.15e-17 | 96 |
| Page: 1 2 3 4 5 6 7 8 9 10 11 12 13 14 15 16 17 18 19 20 21 22 23 24 25 26 27 28 29 30 31 32 33 |
| Pathway ID | Tissue | Disease Stage | Description | Gene Ratio | Bg Ratio | pvalue | p.adjust | qvalue | Count |
| hsa0513218 | Breast | Precancer | Salmonella infection | 49/684 | 249/8465 | 2.92e-09 | 6.15e-08 | 4.71e-08 | 49 |
| hsa042108 | Breast | Precancer | Apoptosis | 25/684 | 136/8465 | 7.61e-05 | 6.87e-04 | 5.26e-04 | 25 |
| hsa0513219 | Breast | Precancer | Salmonella infection | 49/684 | 249/8465 | 2.92e-09 | 6.15e-08 | 4.71e-08 | 49 |
| hsa0421013 | Breast | Precancer | Apoptosis | 25/684 | 136/8465 | 7.61e-05 | 6.87e-04 | 5.26e-04 | 25 |
| hsa0513224 | Breast | IDC | Salmonella infection | 55/867 | 249/8465 | 2.07e-08 | 4.49e-07 | 3.36e-07 | 55 |
| hsa0421022 | Breast | IDC | Apoptosis | 31/867 | 136/8465 | 1.34e-05 | 1.61e-04 | 1.20e-04 | 31 |
| hsa045109 | Breast | IDC | Focal adhesion | 32/867 | 203/8465 | 8.60e-03 | 4.23e-02 | 3.17e-02 | 32 |
| hsa0513234 | Breast | IDC | Salmonella infection | 55/867 | 249/8465 | 2.07e-08 | 4.49e-07 | 3.36e-07 | 55 |
| hsa0421032 | Breast | IDC | Apoptosis | 31/867 | 136/8465 | 1.34e-05 | 1.61e-04 | 1.20e-04 | 31 |
| hsa0451013 | Breast | IDC | Focal adhesion | 32/867 | 203/8465 | 8.60e-03 | 4.23e-02 | 3.17e-02 | 32 |
| hsa0513243 | Breast | DCIS | Salmonella infection | 55/846 | 249/8465 | 8.71e-09 | 1.87e-07 | 1.38e-07 | 55 |
| hsa0421041 | Breast | DCIS | Apoptosis | 29/846 | 136/8465 | 5.92e-05 | 5.97e-04 | 4.40e-04 | 29 |
| hsa0513253 | Breast | DCIS | Salmonella infection | 55/846 | 249/8465 | 8.71e-09 | 1.87e-07 | 1.38e-07 | 55 |
| hsa0421051 | Breast | DCIS | Apoptosis | 29/846 | 136/8465 | 5.92e-05 | 5.97e-04 | 4.40e-04 | 29 |
| hsa0513220 | Cervix | CC | Salmonella infection | 74/1267 | 249/8465 | 1.33e-09 | 2.54e-08 | 1.50e-08 | 74 |
| hsa0412014 | Cervix | CC | Ubiquitin mediated proteolysis | 49/1267 | 142/8465 | 4.26e-09 | 7.68e-08 | 4.54e-08 | 49 |
| hsa0451010 | Cervix | CC | Focal adhesion | 59/1267 | 203/8465 | 1.53e-07 | 1.84e-06 | 1.09e-06 | 59 |
| hsa042109 | Cervix | CC | Apoptosis | 36/1267 | 136/8465 | 3.21e-04 | 1.68e-03 | 9.91e-04 | 36 |
| hsa043908 | Cervix | CC | Hippo signaling pathway | 40/1267 | 157/8465 | 3.64e-04 | 1.82e-03 | 1.07e-03 | 40 |
| hsa05132110 | Cervix | CC | Salmonella infection | 74/1267 | 249/8465 | 1.33e-09 | 2.54e-08 | 1.50e-08 | 74 |
| Page: 1 2 3 4 5 6 7 8 9 10 11 12 |
Top |
Cell-cell communication analysis |
| Identification of potential cell-cell interactions between two cell types and their ligand-receptor pairs for different disease states |
| Ligand | Receptor | LRpair | Pathway | Tissue | Disease Stage |
| Page: 1 |
Top |
Single-cell gene regulatory network inference analysis |
| Find out the significant the regulons (TFs) and the target genes of each regulon across cell types for different disease states |
| TF | Cell Type | Tissue | Disease Stage | Target Gene | RSS | Regulon Activity |
| ∗The dot plots of a searched regulon are shown for all cell subpopulations in each disease state of each tissue based on the regulon specific score inferred using pySCENIC and by calculating the average expression. |
| Page: 1 |
Top |
Somatic mutation of malignant transformation related genes |
| Annotation of somatic variants for genes involved in malignant transformation |
| Hugo Symbol | Variant Class | Variant Classification | dbSNP RS | HGVSc | HGVSp | HGVSp Short | SWISSPROT | BIOTYPE | SIFT | PolyPhen | Tumor Sample Barcode | Tissue | Histology | Sex | Age | Stage | Therapy Types | Drugs | Outcome |
| BIRC3 | SNV | Missense_Mutation | novel | c.410N>G | p.Ser137Cys | p.S137C | Q13489 | protein_coding | deleterious(0.01) | possibly_damaging(0.827) | TCGA-5L-AAT1-01 | Breast | breast invasive carcinoma | Female | <65 | III/IV | Hormone Therapy | letrozol | SD |
| BIRC3 | SNV | Missense_Mutation | novel | c.250N>A | p.Glu84Lys | p.E84K | Q13489 | protein_coding | deleterious(0.05) | possibly_damaging(0.85) | TCGA-A8-A08H-01 | Breast | breast invasive carcinoma | Female | >=65 | I/II | Unknown | Unknown | SD |
| BIRC3 | SNV | Missense_Mutation | novel | c.724N>C | p.Thr242Pro | p.T242P | Q13489 | protein_coding | tolerated(0.08) | benign(0.16) | TCGA-AR-A0TU-01 | Breast | breast invasive carcinoma | Female | <65 | I/II | Unspecific | Doxorubicin | SD |
| BIRC3 | SNV | Missense_Mutation | novel | c.565N>G | p.Leu189Val | p.L189V | Q13489 | protein_coding | deleterious(0.03) | possibly_damaging(0.764) | TCGA-E9-A5UP-01 | Breast | breast invasive carcinoma | Female | <65 | I/II | Hormone Therapy | tamoxiphen | SD |
| BIRC3 | insertion | Nonsense_Mutation | novel | c.906_907insATATCCTAAATTCCCT | p.Glu303IlefsTer3 | p.E303Ifs*3 | Q13489 | protein_coding | TCGA-A2-A0CP-01 | Breast | breast invasive carcinoma | Female | <65 | I/II | Chemotherapy | cytoxan | SD | ||
| BIRC3 | insertion | Frame_Shift_Ins | novel | c.723_724insT | p.Thr242TyrfsTer8 | p.T242Yfs*8 | Q13489 | protein_coding | TCGA-AR-A0TU-01 | Breast | breast invasive carcinoma | Female | <65 | I/II | Unspecific | Doxorubicin | SD | ||
| BIRC3 | SNV | Missense_Mutation | c.433N>G | p.Pro145Ala | p.P145A | Q13489 | protein_coding | tolerated(0.05) | benign(0.077) | TCGA-JW-A5VL-01 | Cervix | cervical & endocervical cancer | Female | <65 | I/II | Unknown | Unknown | SD | |
| BIRC3 | SNV | Missense_Mutation | c.343N>G | p.Ser115Ala | p.S115A | Q13489 | protein_coding | tolerated(0.85) | benign(0.005) | TCGA-A6-3809-01 | Colorectum | colon adenocarcinoma | Female | >=65 | I/II | Unknown | Unknown | SD | |
| BIRC3 | SNV | Missense_Mutation | rs145025961 | c.1414N>A | p.Gly472Arg | p.G472R | Q13489 | protein_coding | tolerated(0.65) | benign(0.003) | TCGA-AA-3821-01 | Colorectum | colon adenocarcinoma | Female | >=65 | I/II | Unknown | Unknown | SD |
| BIRC3 | SNV | Missense_Mutation | c.832N>C | p.Ser278Arg | p.S278R | Q13489 | protein_coding | tolerated(0.58) | benign(0.119) | TCGA-AA-A010-01 | Colorectum | colon adenocarcinoma | Female | <65 | I/II | Chemotherapy | folinic | CR |
| Page: 1 2 3 4 5 6 7 |
Top |
Related drugs of malignant transformation related genes |
| Identification of chemicals and drugs interact with genes involved in malignant transfromation |
| (DGIdb 4.0) |
| Entrez ID | Symbol | Category | Interaction Types | Drug Claim Name | Drug Name | PMIDs |
| 330 | BIRC3 | CLINICALLY ACTIONABLE, ENZYME, DRUGGABLE GENOME, KINASE, TUMOR SUPPRESSOR | inhibitor | 252827512 | CHEMBL481422 | |
| 330 | BIRC3 | CLINICALLY ACTIONABLE, ENZYME, DRUGGABLE GENOME, KINASE, TUMOR SUPPRESSOR | antagonist | 223366043 | ||
| 330 | BIRC3 | CLINICALLY ACTIONABLE, ENZYME, DRUGGABLE GENOME, KINASE, TUMOR SUPPRESSOR | AT-406 | AT-406 | 25520882 | |
| 330 | BIRC3 | CLINICALLY ACTIONABLE, ENZYME, DRUGGABLE GENOME, KINASE, TUMOR SUPPRESSOR | antagonist | 223366065 | CHEMBL504559 | |
| 330 | BIRC3 | CLINICALLY ACTIONABLE, ENZYME, DRUGGABLE GENOME, KINASE, TUMOR SUPPRESSOR | PMID25980951-Compound-27 | |||
| 330 | BIRC3 | CLINICALLY ACTIONABLE, ENZYME, DRUGGABLE GENOME, KINASE, TUMOR SUPPRESSOR | antagonist | AT-406 | AT-406 | |
| 330 | BIRC3 | CLINICALLY ACTIONABLE, ENZYME, DRUGGABLE GENOME, KINASE, TUMOR SUPPRESSOR | PMID25980951-Compound-1 | |||
| 330 | BIRC3 | CLINICALLY ACTIONABLE, ENZYME, DRUGGABLE GENOME, KINASE, TUMOR SUPPRESSOR | HGS1029 | |||
| 330 | BIRC3 | CLINICALLY ACTIONABLE, ENZYME, DRUGGABLE GENOME, KINASE, TUMOR SUPPRESSOR | BESTATIN METHYL ESTER | BESTATIN METHYL ESTER | 18448338 | |
| 330 | BIRC3 | CLINICALLY ACTIONABLE, ENZYME, DRUGGABLE GENOME, KINASE, TUMOR SUPPRESSOR | PMID25980951-Compound-44 |
| Page: 1 2 |

Copyright 2023-Present -The University of Texas Health Science Center at Houston |