
|
|||||
|
 | |
| |
| |
| |
| |
| |
|
Gene: BIN3 |
Gene summary for BIN3 |
| Gene information | Species | Human | Gene symbol | BIN3 | Gene ID | 55909 |
| Gene name | bridging integrator 3 | |
| Gene Alias | BIN3 | |
| Cytomap | 8p21.3 | |
| Gene Type | protein-coding | GO ID | GO:0000902 | UniProtAcc | Q9NQY0 |
Top |
Malignant transformation analysis |
| Identification of the aberrant gene expression in precancerous and cancerous lesions by comparing the gene expression of stem-like cells in diseased tissues with normal stem cells |
| Entrez ID | Symbol | Replicates | Species | Organ | Tissue | Adj P-value | Log2FC | Malignancy |
| 55909 | BIN3 | C04 | Human | Oral cavity | OSCC | 5.05e-05 | 3.72e-01 | 0.2633 |
| 55909 | BIN3 | C21 | Human | Oral cavity | OSCC | 1.93e-25 | 8.57e-01 | 0.2678 |
| 55909 | BIN3 | C30 | Human | Oral cavity | OSCC | 4.87e-26 | 1.12e+00 | 0.3055 |
| 55909 | BIN3 | C43 | Human | Oral cavity | OSCC | 8.36e-13 | 2.60e-01 | 0.1704 |
| 55909 | BIN3 | C46 | Human | Oral cavity | OSCC | 5.54e-18 | 3.46e-01 | 0.1673 |
| 55909 | BIN3 | C51 | Human | Oral cavity | OSCC | 2.13e-05 | 3.51e-01 | 0.2674 |
| 55909 | BIN3 | C57 | Human | Oral cavity | OSCC | 8.88e-08 | 4.73e-01 | 0.1679 |
| 55909 | BIN3 | C08 | Human | Oral cavity | OSCC | 1.91e-05 | 1.31e-01 | 0.1919 |
| 55909 | BIN3 | C09 | Human | Oral cavity | OSCC | 2.13e-10 | 3.96e-01 | 0.1431 |
| 55909 | BIN3 | LN46 | Human | Oral cavity | OSCC | 7.99e-09 | 3.62e-01 | 0.1666 |
| 55909 | BIN3 | LP17 | Human | Oral cavity | LP | 2.64e-02 | 5.06e-01 | 0.2349 |
| 55909 | BIN3 | EOLP-1 | Human | Oral cavity | EOLP | 2.78e-07 | 1.53e-01 | -0.0202 |
| 55909 | BIN3 | SYSMH1 | Human | Oral cavity | OSCC | 8.11e-07 | 1.38e-01 | 0.1127 |
| 55909 | BIN3 | SYSMH2 | Human | Oral cavity | OSCC | 1.18e-03 | 1.99e-01 | 0.2326 |
| 55909 | BIN3 | SYSMH3 | Human | Oral cavity | OSCC | 7.87e-07 | 1.62e-01 | 0.2442 |
| Page: 1 |
| Tissue | Expression Dynamics | Abbreviation |
| Oral Cavity | 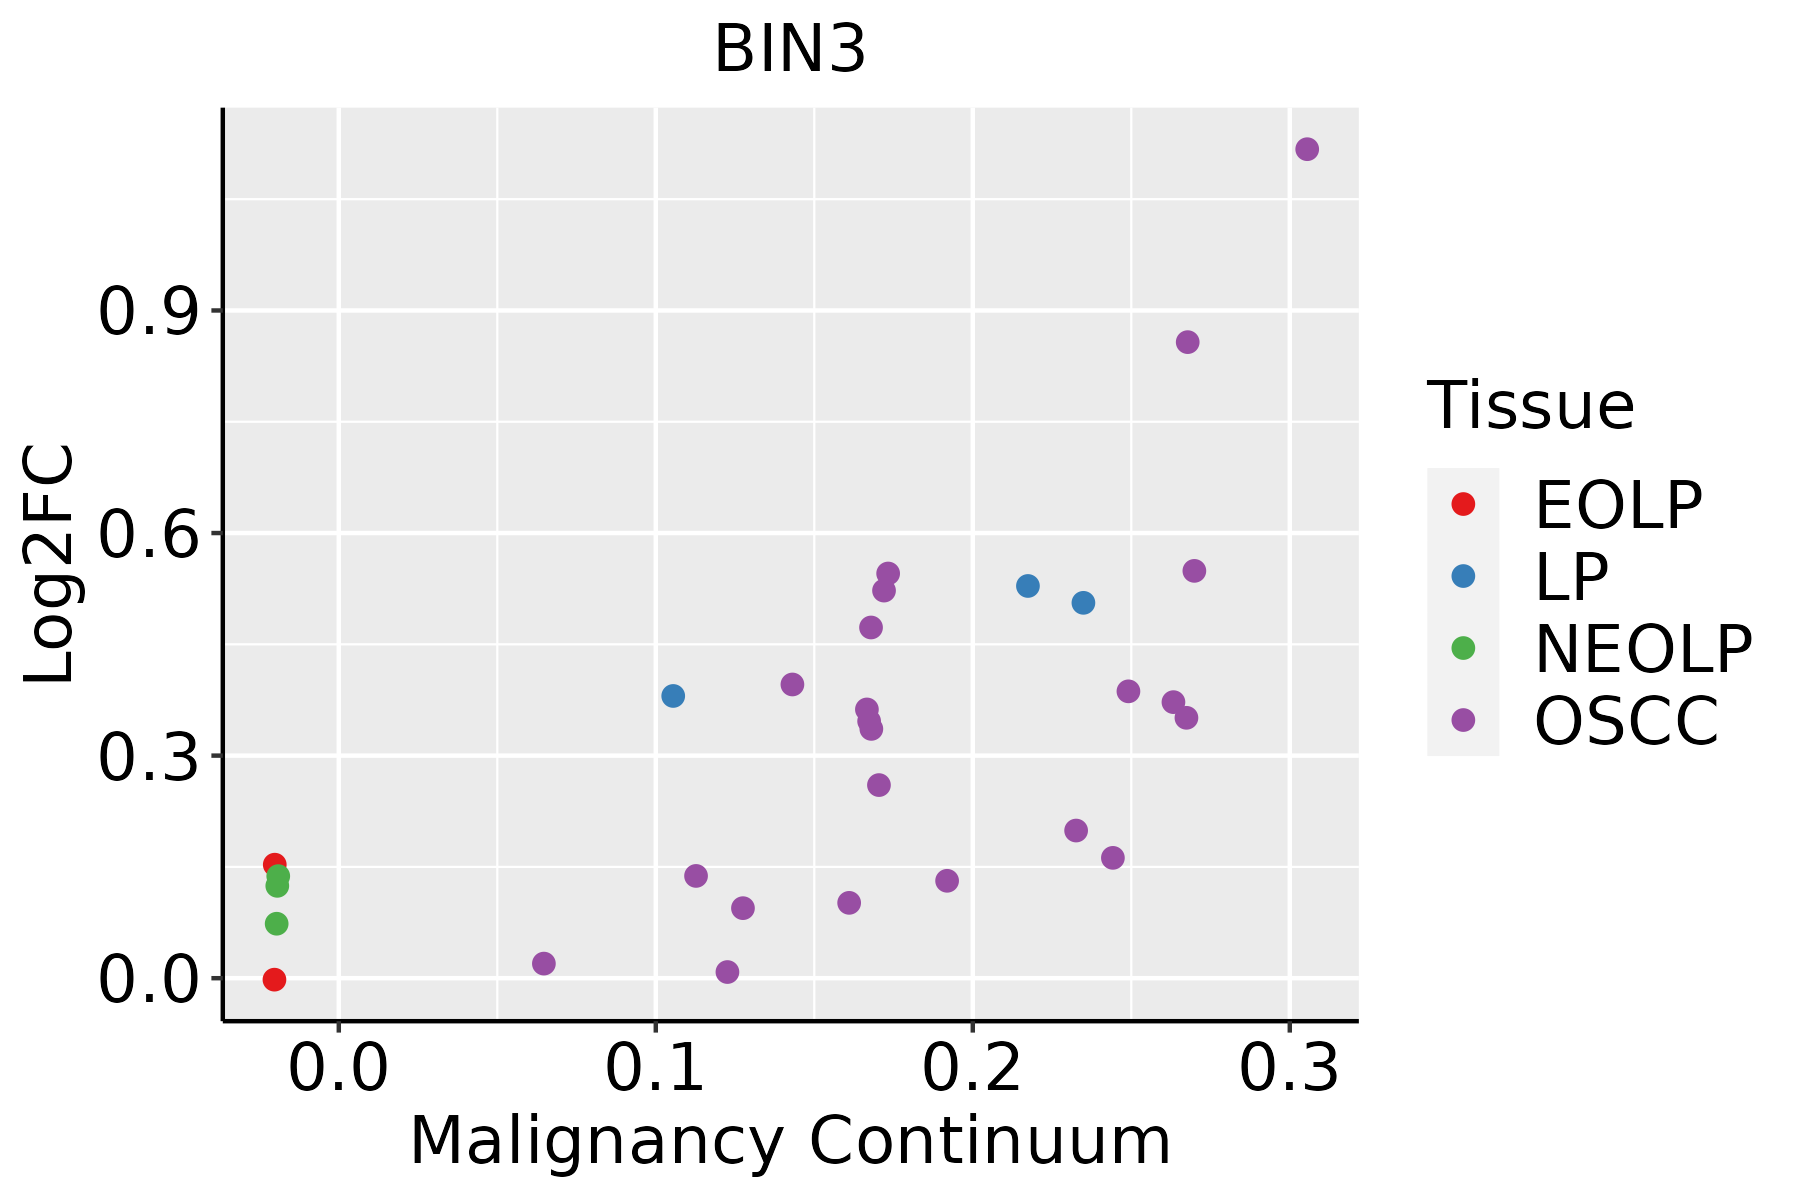 | EOLP: Erosive Oral lichen planus |
| LP: leukoplakia | ||
| NEOLP: Non-erosive oral lichen planus | ||
| OSCC: Oral squamous cell carcinoma |
| ∗log2FC in expression of this searched gene in stem-like cells from each diseased tissue sample relative to stem-like cells in normal samples in each tissue plotted against the malignancy continuum. Samples are colored based on if they are from different disease stage. |
Top |
Malignant transformation related pathway analysis |
| Find out the enriched GO biological processes and KEGG pathways involved in transition from healthy to precancer to cancer |
| Tissue | Disease Stage | Enriched GO biological Processes |
| Colorectum | AD |  |
| Colorectum | SER |  |
| Colorectum | MSS |  |
| Colorectum | MSI-H |  |
| Colorectum | FAP |  |
| ∗Top 15 enriched GO BP terms are showed in the bar plot of each disease state in each tissue. Each row represents a significant GO biological process which is colored according to the -log10(p.adjust). |
| Page: 1 2 3 4 5 6 7 8 9 |
| GO ID | Tissue | Disease Stage | Description | Gene Ratio | Bg Ratio | pvalue | p.adjust | Count |
| GO:001604917 | Oral cavity | OSCC | cell growth | 268/7305 | 482/18723 | 6.55e-14 | 3.51e-12 | 268 |
| GO:00325065 | Oral cavity | OSCC | cytokinetic process | 33/7305 | 39/18723 | 5.91e-09 | 1.26e-07 | 33 |
| GO:000701520 | Oral cavity | OSCC | actin filament organization | 230/7305 | 442/18723 | 1.37e-08 | 2.77e-07 | 230 |
| GO:00310999 | Oral cavity | OSCC | regeneration | 114/7305 | 198/18723 | 8.54e-08 | 1.50e-06 | 114 |
| GO:000091010 | Oral cavity | OSCC | cytokinesis | 97/7305 | 173/18723 | 3.82e-06 | 4.51e-05 | 97 |
| GO:00616405 | Oral cavity | OSCC | cytoskeleton-dependent cytokinesis | 60/7305 | 100/18723 | 1.69e-05 | 1.67e-04 | 60 |
| GO:009758110 | Oral cavity | OSCC | lamellipodium organization | 54/7305 | 90/18723 | 4.39e-05 | 3.76e-04 | 54 |
| GO:006049110 | Oral cavity | OSCC | regulation of cell projection assembly | 100/7305 | 188/18723 | 5.27e-05 | 4.38e-04 | 100 |
| GO:012003216 | Oral cavity | OSCC | regulation of plasma membrane bounded cell projection assembly | 98/7305 | 186/18723 | 1.00e-04 | 7.54e-04 | 98 |
| GO:00605609 | Oral cavity | OSCC | developmental growth involved in morphogenesis | 116/7305 | 234/18723 | 6.20e-04 | 3.50e-03 | 116 |
| GO:00422464 | Oral cavity | OSCC | tissue regeneration | 42/7305 | 72/18723 | 6.89e-04 | 3.84e-03 | 42 |
| GO:0097320 | Oral cavity | OSCC | plasma membrane tubulation | 15/7305 | 20/18723 | 1.19e-03 | 5.99e-03 | 15 |
| GO:00300328 | Oral cavity | OSCC | lamellipodium assembly | 41/7305 | 72/18723 | 1.53e-03 | 7.31e-03 | 41 |
| GO:00605378 | Oral cavity | OSCC | muscle tissue development | 185/7305 | 403/18723 | 2.60e-03 | 1.14e-02 | 185 |
| GO:00434034 | Oral cavity | OSCC | skeletal muscle tissue regeneration | 23/7305 | 37/18723 | 3.66e-03 | 1.51e-02 | 23 |
| GO:190274310 | Oral cavity | OSCC | regulation of lamellipodium organization | 31/7305 | 54/18723 | 4.66e-03 | 1.87e-02 | 31 |
| GO:00426927 | Oral cavity | OSCC | muscle cell differentiation | 175/7305 | 384/18723 | 4.79e-03 | 1.92e-02 | 175 |
| GO:00147067 | Oral cavity | OSCC | striated muscle tissue development | 174/7305 | 384/18723 | 6.45e-03 | 2.40e-02 | 174 |
| GO:003250613 | Oral cavity | LP | cytokinetic process | 24/4623 | 39/18723 | 1.13e-06 | 2.78e-05 | 24 |
| GO:003109916 | Oral cavity | LP | regeneration | 76/4623 | 198/18723 | 1.25e-05 | 2.24e-04 | 76 |
| Page: 1 2 3 |
| Pathway ID | Tissue | Disease Stage | Description | Gene Ratio | Bg Ratio | pvalue | p.adjust | qvalue | Count |
| Page: 1 |
Top |
Cell-cell communication analysis |
| Identification of potential cell-cell interactions between two cell types and their ligand-receptor pairs for different disease states |
| Ligand | Receptor | LRpair | Pathway | Tissue | Disease Stage |
| Page: 1 |
Top |
Single-cell gene regulatory network inference analysis |
| Find out the significant the regulons (TFs) and the target genes of each regulon across cell types for different disease states |
| TF | Cell Type | Tissue | Disease Stage | Target Gene | RSS | Regulon Activity |
| ∗The dot plots of a searched regulon are shown for all cell subpopulations in each disease state of each tissue based on the regulon specific score inferred using pySCENIC and by calculating the average expression. |
| Page: 1 |
Top |
Somatic mutation of malignant transformation related genes |
| Annotation of somatic variants for genes involved in malignant transformation |
| Hugo Symbol | Variant Class | Variant Classification | dbSNP RS | HGVSc | HGVSp | HGVSp Short | SWISSPROT | BIOTYPE | SIFT | PolyPhen | Tumor Sample Barcode | Tissue | Histology | Sex | Age | Stage | Therapy Types | Drugs | Outcome |
| BIN3 | SNV | Missense_Mutation | rs372409275 | c.506N>A | p.Arg169Gln | p.R169Q | Q9NQY0 | protein_coding | tolerated(0.2) | benign(0.003) | TCGA-A6-6780-01 | Colorectum | colon adenocarcinoma | Male | >=65 | I/II | Unknown | Unknown | SD |
| BIN3 | SNV | Missense_Mutation | novel | c.747T>G | p.Ile249Met | p.I249M | Q9NQY0 | protein_coding | deleterious(0) | probably_damaging(0.997) | TCGA-AA-A00N-01 | Colorectum | colon adenocarcinoma | Male | >=65 | I/II | Unknown | Unknown | PD |
| BIN3 | SNV | Missense_Mutation | c.77N>T | p.Arg26Met | p.R26M | Q9NQY0 | protein_coding | deleterious(0) | probably_damaging(0.975) | TCGA-AD-A5EJ-01 | Colorectum | colon adenocarcinoma | Female | >=65 | I/II | Unknown | Unknown | SD | |
| BIN3 | SNV | Missense_Mutation | novel | c.356N>G | p.Pro119Arg | p.P119R | Q9NQY0 | protein_coding | deleterious(0) | probably_damaging(0.996) | TCGA-CK-4948-01 | Colorectum | colon adenocarcinoma | Female | <65 | III/IV | Unknown | Unknown | SD |
| BIN3 | SNV | Missense_Mutation | c.623N>G | p.Tyr208Cys | p.Y208C | Q9NQY0 | protein_coding | deleterious(0.02) | probably_damaging(0.995) | TCGA-CK-5916-01 | Colorectum | colon adenocarcinoma | Female | >=65 | I/II | Unknown | Unknown | PD | |
| BIN3 | SNV | Missense_Mutation | rs750251598 | c.568N>T | p.Arg190Cys | p.R190C | Q9NQY0 | protein_coding | deleterious(0) | probably_damaging(0.971) | TCGA-D5-6928-01 | Colorectum | colon adenocarcinoma | Male | >=65 | I/II | Unknown | Unknown | SD |
| BIN3 | SNV | Missense_Mutation | rs776836042 | c.260C>T | p.Thr87Met | p.T87M | Q9NQY0 | protein_coding | tolerated(0.15) | possibly_damaging(0.809) | TCGA-A5-A0G2-01 | Endometrium | uterine corpus endometrioid carcinoma | Female | <65 | III/IV | Unknown | Unknown | SD |
| BIN3 | SNV | Missense_Mutation | c.151N>A | p.Ala51Thr | p.A51T | Q9NQY0 | protein_coding | deleterious(0.03) | possibly_damaging(0.858) | TCGA-AP-A059-01 | Endometrium | uterine corpus endometrioid carcinoma | Female | >=65 | I/II | Unknown | Unknown | SD | |
| BIN3 | SNV | Missense_Mutation | novel | c.183N>T | p.Lys61Asn | p.K61N | Q9NQY0 | protein_coding | deleterious(0) | possibly_damaging(0.609) | TCGA-AX-A2HC-01 | Endometrium | uterine corpus endometrioid carcinoma | Female | <65 | III/IV | Chemotherapy | paclitaxel | PD |
| BIN3 | SNV | Missense_Mutation | rs750251598 | c.568C>T | p.Arg190Cys | p.R190C | Q9NQY0 | protein_coding | deleterious(0) | probably_damaging(0.971) | TCGA-B5-A3FC-01 | Endometrium | uterine corpus endometrioid carcinoma | Female | <65 | I/II | Unknown | Unknown | SD |
| Page: 1 2 |
Top |
Related drugs of malignant transformation related genes |
| Identification of chemicals and drugs interact with genes involved in malignant transfromation |
| (DGIdb 4.0) |
| Entrez ID | Symbol | Category | Interaction Types | Drug Claim Name | Drug Name | PMIDs |
| Page: 1 |

Copyright 2023-Present -The University of Texas Health Science Center at Houston |