
|
|||||
|
 | |
| |
| |
| |
| |
| |
|
Gene: BIK |
Gene summary for BIK |
| Gene information | Species | Human | Gene symbol | BIK | Gene ID | 638 |
| Gene name | BCL2 interacting killer | |
| Gene Alias | BIP1 | |
| Cytomap | 22q13.2 | |
| Gene Type | protein-coding | GO ID | GO:0000003 | UniProtAcc | A0A024R4X6 |
Top |
Malignant transformation analysis |
| Identification of the aberrant gene expression in precancerous and cancerous lesions by comparing the gene expression of stem-like cells in diseased tissues with normal stem cells |
| Entrez ID | Symbol | Replicates | Species | Organ | Tissue | Adj P-value | Log2FC | Malignancy |
| 638 | BIK | LZE4T | Human | Esophagus | ESCC | 1.42e-05 | 2.64e-01 | 0.0811 |
| 638 | BIK | LZE5T | Human | Esophagus | ESCC | 3.58e-14 | 1.08e+00 | 0.0514 |
| 638 | BIK | LZE7T | Human | Esophagus | ESCC | 9.23e-18 | 1.17e+00 | 0.0667 |
| 638 | BIK | LZE8T | Human | Esophagus | ESCC | 7.05e-07 | 3.51e-01 | 0.067 |
| 638 | BIK | LZE20T | Human | Esophagus | ESCC | 9.90e-06 | 4.29e-01 | 0.0662 |
| 638 | BIK | LZE22D1 | Human | Esophagus | HGIN | 1.01e-06 | 3.08e-01 | 0.0595 |
| 638 | BIK | LZE22T | Human | Esophagus | ESCC | 6.52e-06 | 6.39e-01 | 0.068 |
| 638 | BIK | LZE24T | Human | Esophagus | ESCC | 3.15e-47 | 1.92e+00 | 0.0596 |
| 638 | BIK | P1T-E | Human | Esophagus | ESCC | 9.21e-15 | 9.43e-01 | 0.0875 |
| 638 | BIK | P2T-E | Human | Esophagus | ESCC | 3.04e-08 | 3.43e-01 | 0.1177 |
| 638 | BIK | P4T-E | Human | Esophagus | ESCC | 1.27e-21 | 5.65e-01 | 0.1323 |
| 638 | BIK | P5T-E | Human | Esophagus | ESCC | 4.58e-77 | 1.54e+00 | 0.1327 |
| 638 | BIK | P8T-E | Human | Esophagus | ESCC | 8.34e-49 | 1.10e+00 | 0.0889 |
| 638 | BIK | P9T-E | Human | Esophagus | ESCC | 1.02e-02 | 2.67e-01 | 0.1131 |
| 638 | BIK | P10T-E | Human | Esophagus | ESCC | 1.59e-20 | 5.14e-01 | 0.116 |
| 638 | BIK | P11T-E | Human | Esophagus | ESCC | 6.62e-03 | 2.45e-01 | 0.1426 |
| 638 | BIK | P12T-E | Human | Esophagus | ESCC | 8.55e-29 | 7.07e-01 | 0.1122 |
| 638 | BIK | P15T-E | Human | Esophagus | ESCC | 1.98e-21 | 6.67e-01 | 0.1149 |
| 638 | BIK | P16T-E | Human | Esophagus | ESCC | 4.33e-24 | 4.80e-01 | 0.1153 |
| 638 | BIK | P17T-E | Human | Esophagus | ESCC | 4.06e-12 | 6.34e-01 | 0.1278 |
| Page: 1 2 3 4 5 |
| Tissue | Expression Dynamics | Abbreviation |
| Esophagus |  | ESCC: Esophageal squamous cell carcinoma |
| HGIN: High-grade intraepithelial neoplasias | ||
| LGIN: Low-grade intraepithelial neoplasias | ||
| Liver | 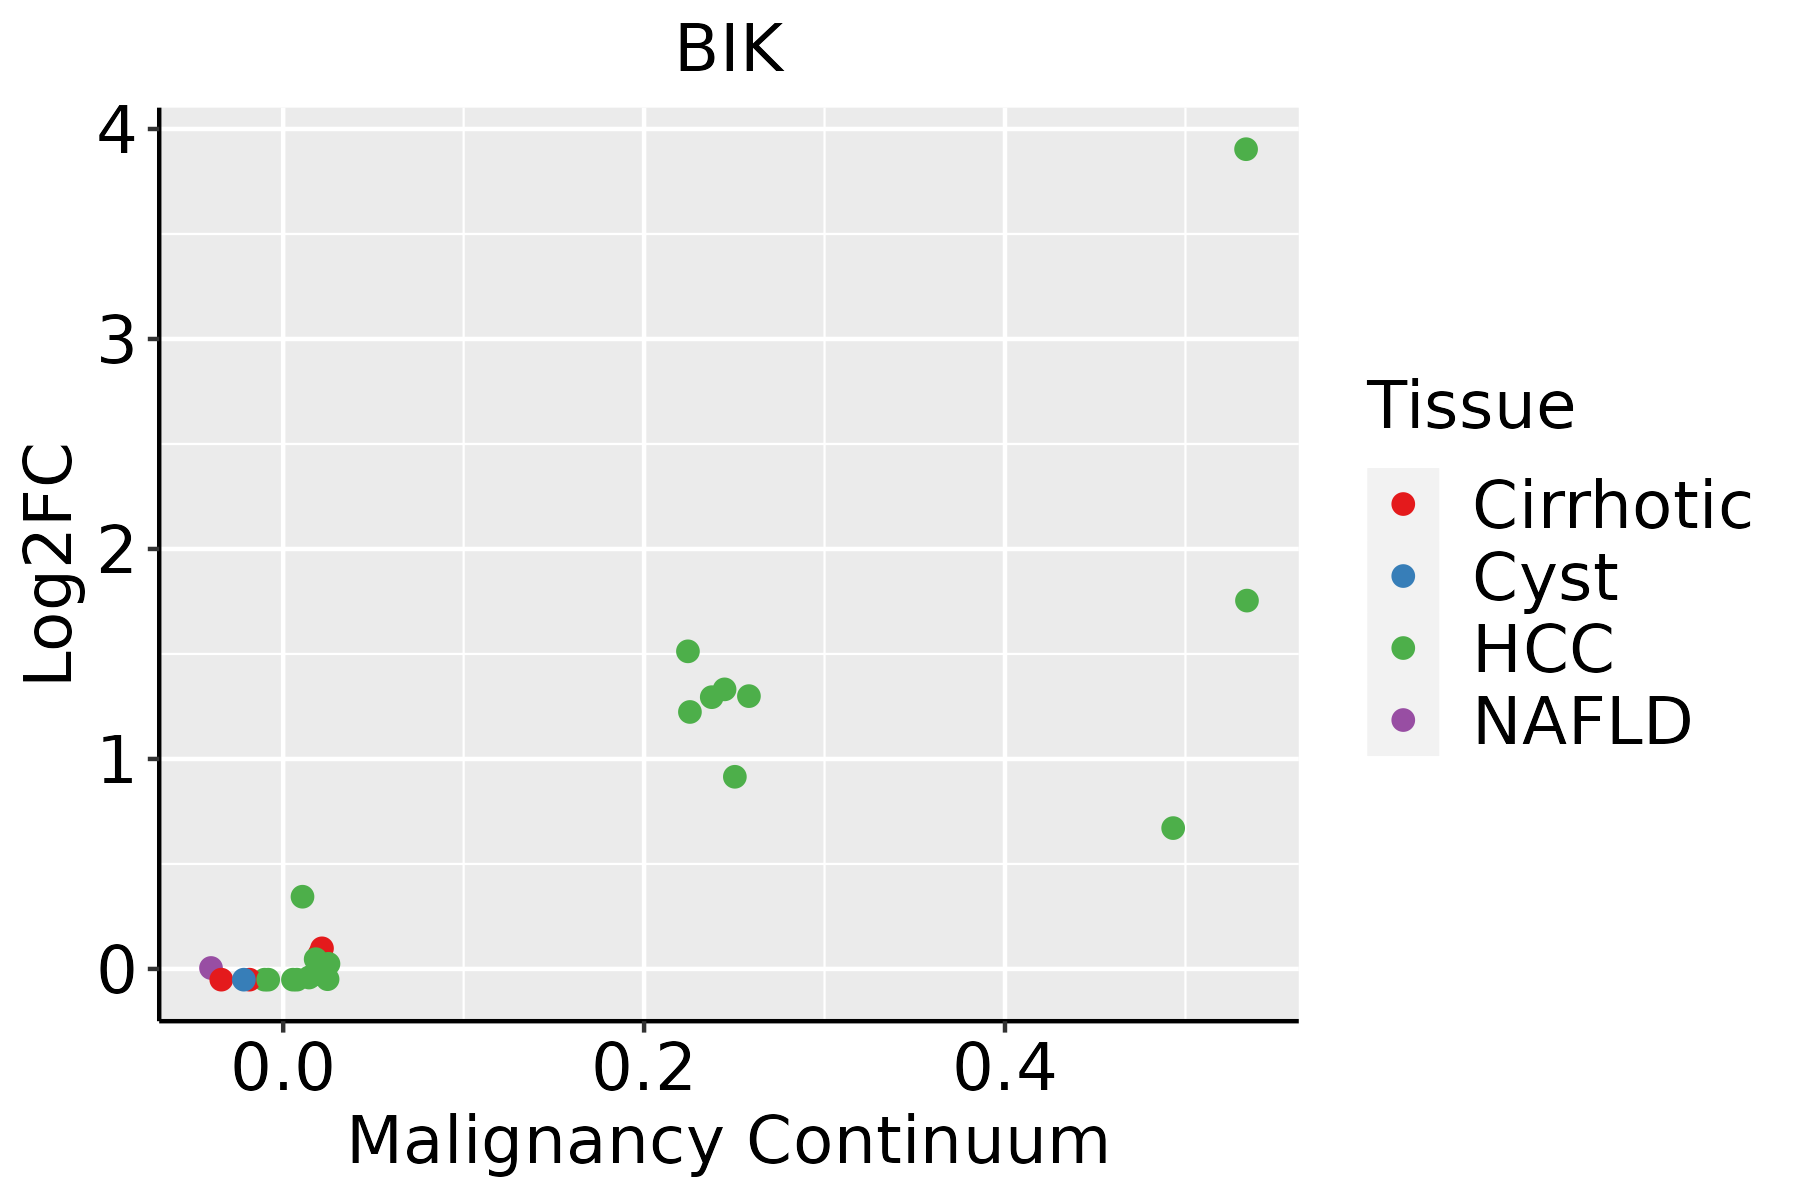 | HCC: Hepatocellular carcinoma |
| NAFLD: Non-alcoholic fatty liver disease | ||
| Oral Cavity | 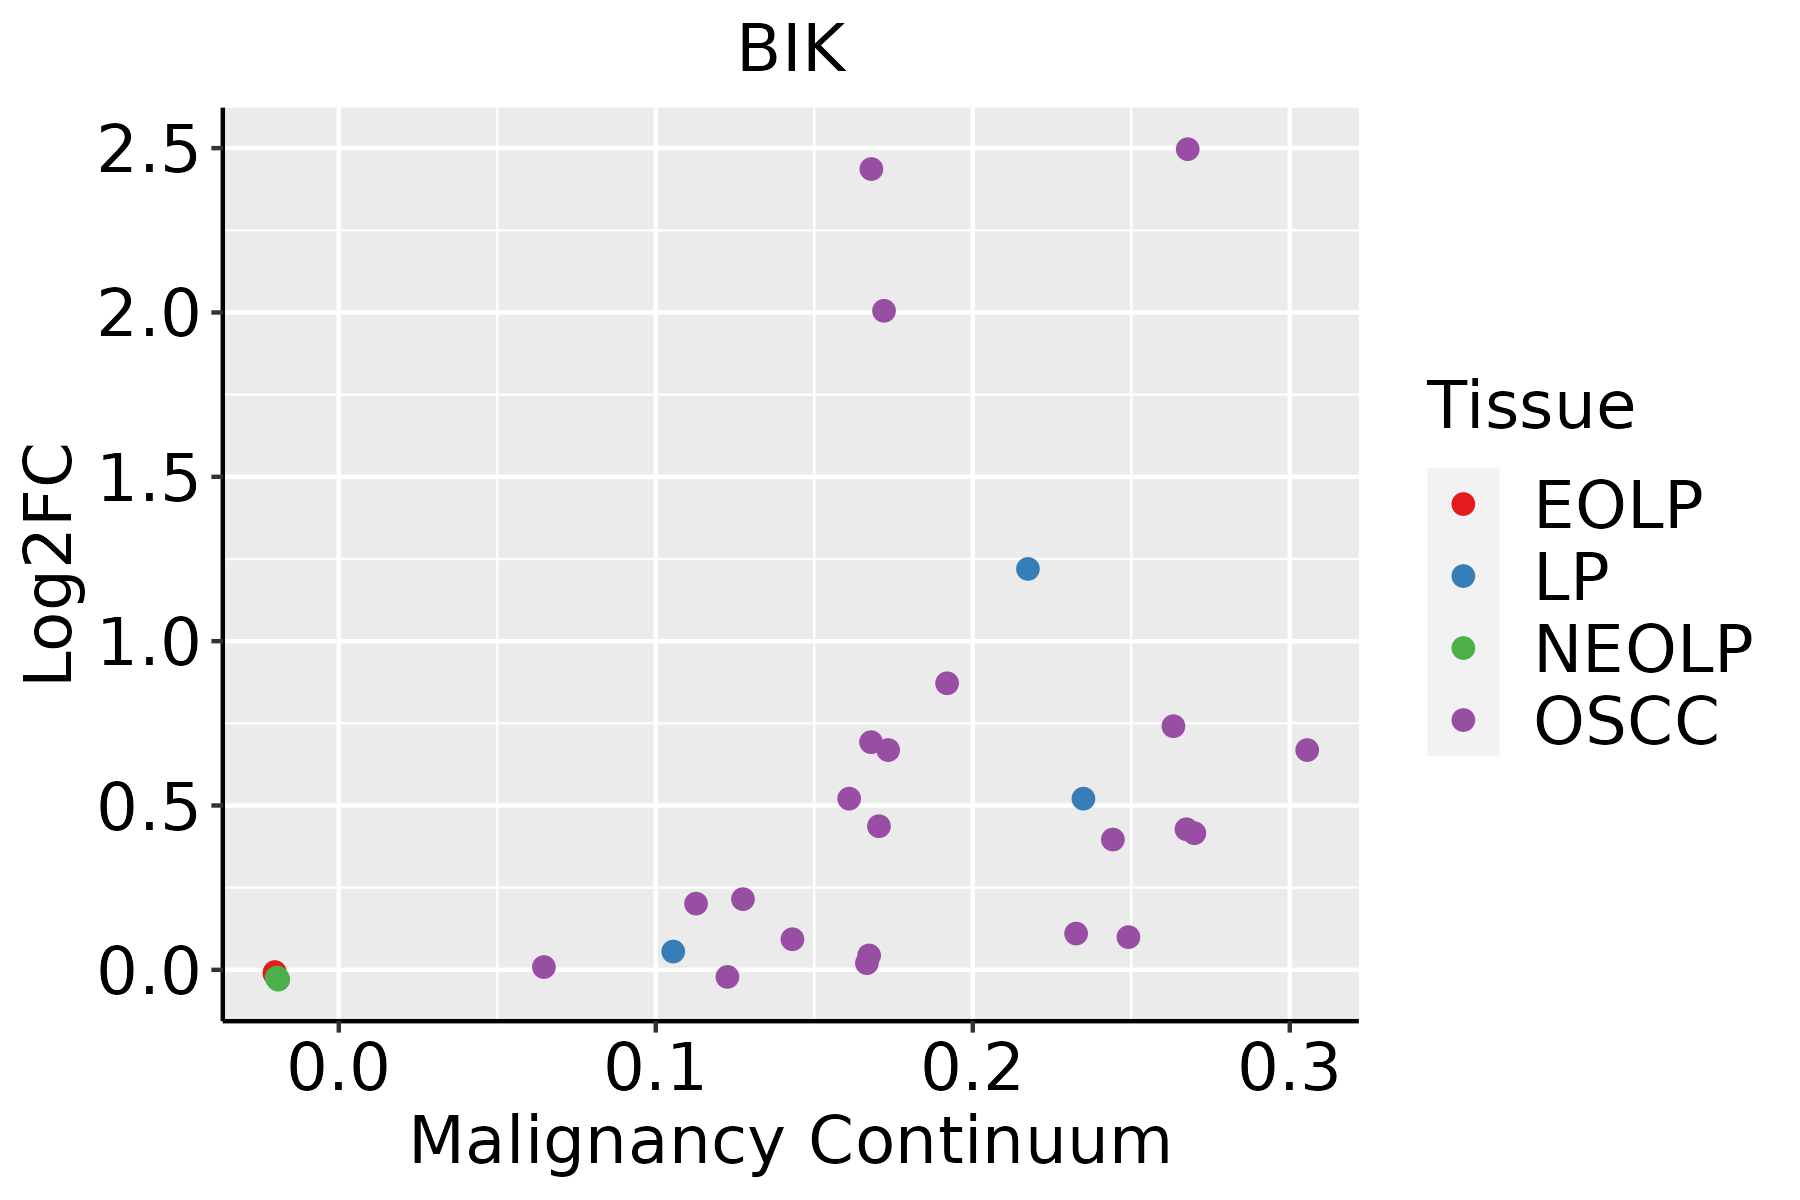 | EOLP: Erosive Oral lichen planus |
| LP: leukoplakia | ||
| NEOLP: Non-erosive oral lichen planus | ||
| OSCC: Oral squamous cell carcinoma | ||
| Prostate | 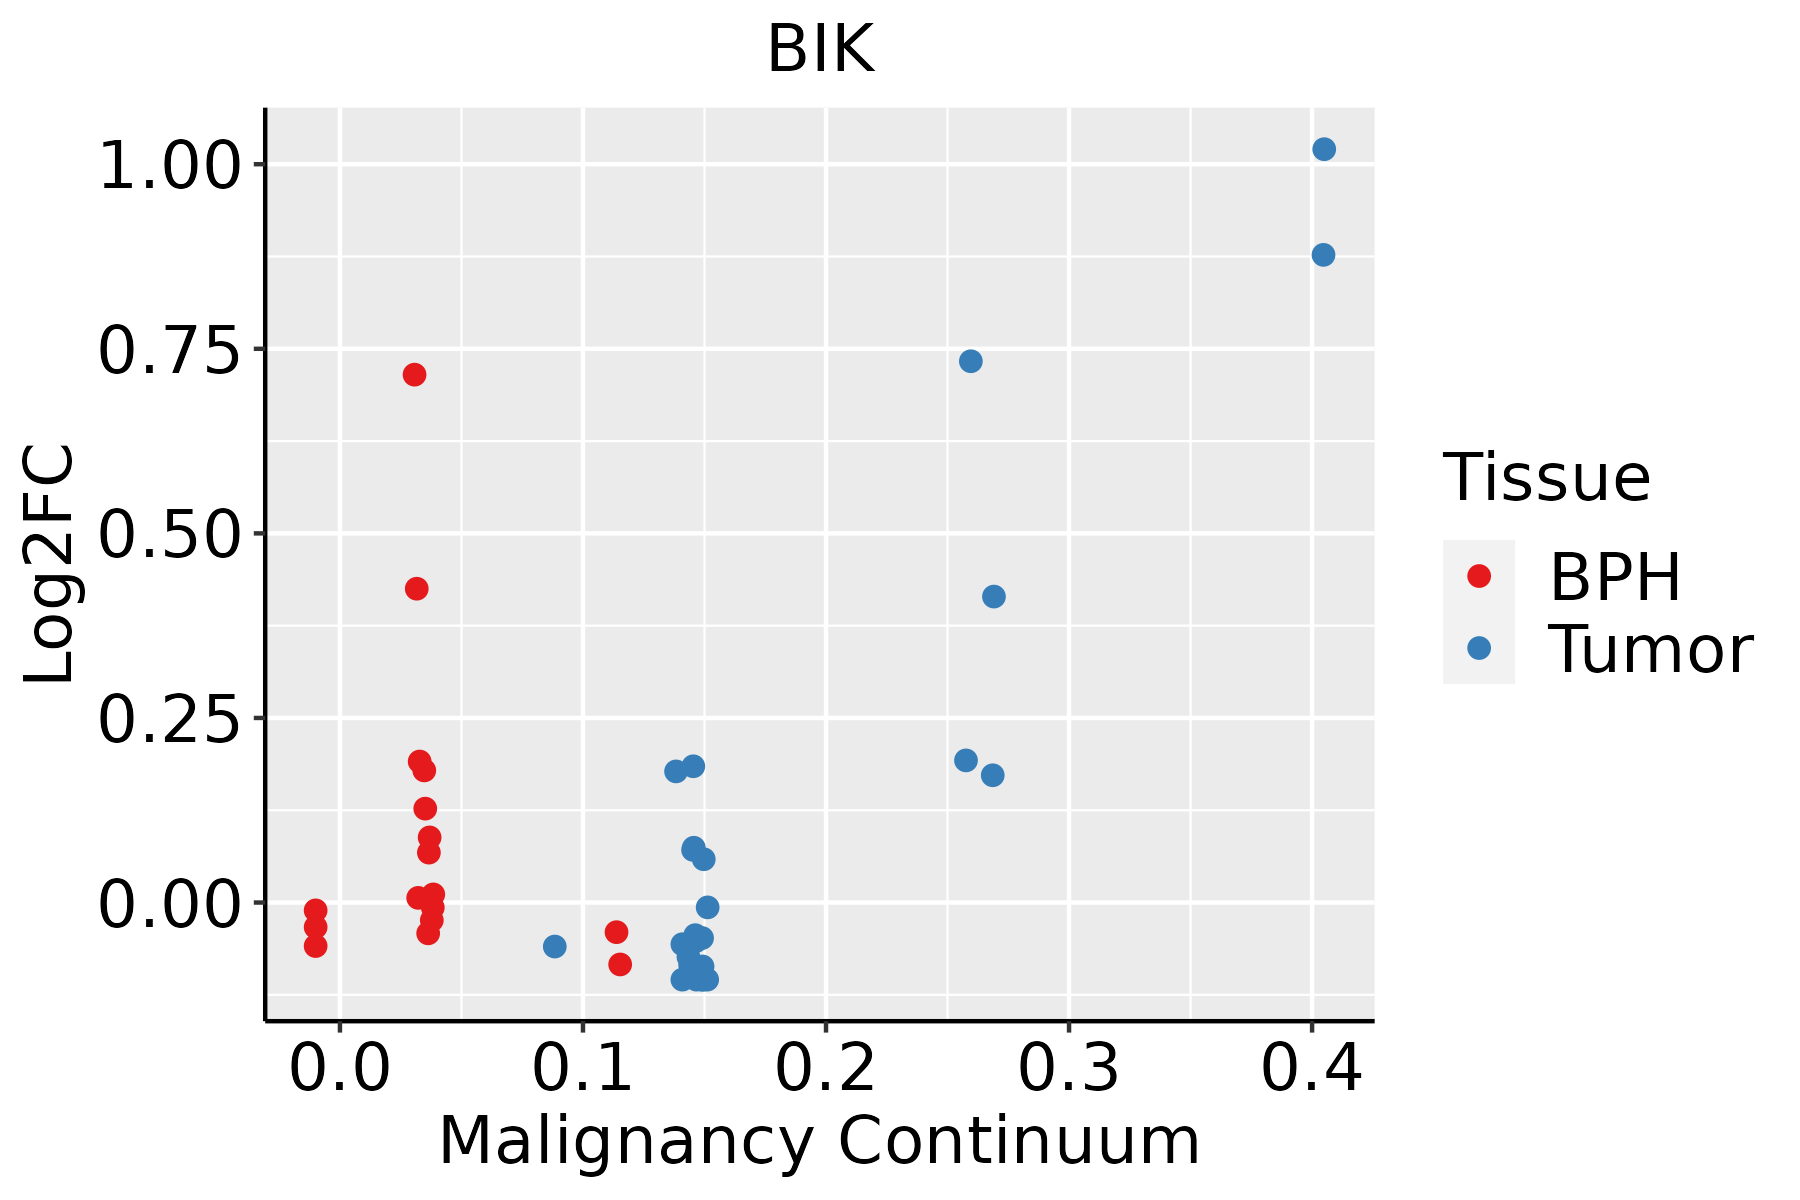 | BPH: Benign Prostatic Hyperplasia |
| ∗log2FC in expression of this searched gene in stem-like cells from each diseased tissue sample relative to stem-like cells in normal samples in each tissue plotted against the malignancy continuum. Samples are colored based on if they are from different disease stage. |
Top |
Malignant transformation related pathway analysis |
| Find out the enriched GO biological processes and KEGG pathways involved in transition from healthy to precancer to cancer |
| Tissue | Disease Stage | Enriched GO biological Processes |
| Colorectum | AD |  |
| Colorectum | SER |  |
| Colorectum | MSS |  |
| Colorectum | MSI-H |  |
| Colorectum | FAP |  |
| ∗Top 15 enriched GO BP terms are showed in the bar plot of each disease state in each tissue. Each row represents a significant GO biological process which is colored according to the -log10(p.adjust). |
| Page: 1 2 3 4 5 6 7 8 9 |
| GO ID | Tissue | Disease Stage | Description | Gene Ratio | Bg Ratio | pvalue | p.adjust | Count |
| GO:003133425 | Esophagus | HGIN | positive regulation of protein-containing complex assembly | 61/2587 | 237/18723 | 7.10e-07 | 3.00e-05 | 61 |
| GO:001082119 | Esophagus | HGIN | regulation of mitochondrion organization | 42/2587 | 144/18723 | 1.20e-06 | 4.68e-05 | 42 |
| GO:004325427 | Esophagus | HGIN | regulation of protein-containing complex assembly | 94/2587 | 428/18723 | 2.39e-06 | 8.55e-05 | 94 |
| GO:000863720 | Esophagus | HGIN | apoptotic mitochondrial changes | 33/2587 | 107/18723 | 4.32e-06 | 1.42e-04 | 33 |
| GO:000183618 | Esophagus | HGIN | release of cytochrome c from mitochondria | 21/2587 | 59/18723 | 2.14e-05 | 5.72e-04 | 21 |
| GO:00901998 | Esophagus | HGIN | regulation of release of cytochrome c from mitochondria | 18/2587 | 48/18723 | 3.67e-05 | 9.22e-04 | 18 |
| GO:00108228 | Esophagus | HGIN | positive regulation of mitochondrion organization | 20/2587 | 74/18723 | 2.00e-03 | 2.12e-02 | 20 |
| GO:006145819 | Esophagus | HGIN | reproductive system development | 78/2587 | 427/18723 | 5.53e-03 | 4.52e-02 | 78 |
| GO:0043254111 | Esophagus | ESCC | regulation of protein-containing complex assembly | 278/8552 | 428/18723 | 3.81e-16 | 2.77e-14 | 278 |
| GO:0031334111 | Esophagus | ESCC | positive regulation of protein-containing complex assembly | 166/8552 | 237/18723 | 2.06e-14 | 1.07e-12 | 166 |
| GO:0010821110 | Esophagus | ESCC | regulation of mitochondrion organization | 107/8552 | 144/18723 | 2.31e-12 | 9.41e-11 | 107 |
| GO:0008637110 | Esophagus | ESCC | apoptotic mitochondrial changes | 83/8552 | 107/18723 | 1.43e-11 | 5.08e-10 | 83 |
| GO:001082215 | Esophagus | ESCC | positive regulation of mitochondrion organization | 58/8552 | 74/18723 | 8.55e-09 | 1.73e-07 | 58 |
| GO:000183619 | Esophagus | ESCC | release of cytochrome c from mitochondria | 47/8552 | 59/18723 | 9.02e-08 | 1.51e-06 | 47 |
| GO:0061458110 | Esophagus | ESCC | reproductive system development | 247/8552 | 427/18723 | 2.24e-07 | 3.42e-06 | 247 |
| GO:004860818 | Esophagus | ESCC | reproductive structure development | 245/8552 | 424/18723 | 2.82e-07 | 4.14e-06 | 245 |
| GO:009019914 | Esophagus | ESCC | regulation of release of cytochrome c from mitochondria | 38/8552 | 48/18723 | 2.11e-06 | 2.43e-05 | 38 |
| GO:00902004 | Esophagus | ESCC | positive regulation of release of cytochrome c from mitochondria | 22/8552 | 28/18723 | 3.95e-04 | 2.26e-03 | 22 |
| GO:004325422 | Liver | HCC | regulation of protein-containing complex assembly | 264/7958 | 428/18723 | 5.47e-16 | 4.39e-14 | 264 |
| GO:003133412 | Liver | HCC | positive regulation of protein-containing complex assembly | 150/7958 | 237/18723 | 7.35e-11 | 2.63e-09 | 150 |
| Page: 1 2 3 4 |
| Pathway ID | Tissue | Disease Stage | Description | Gene Ratio | Bg Ratio | pvalue | p.adjust | qvalue | Count |
| hsa015227 | Esophagus | ESCC | Endocrine resistance | 63/4205 | 98/8465 | 2.38e-03 | 6.58e-03 | 3.37e-03 | 63 |
| hsa0152215 | Esophagus | ESCC | Endocrine resistance | 63/4205 | 98/8465 | 2.38e-03 | 6.58e-03 | 3.37e-03 | 63 |
| hsa01522 | Liver | HCC | Endocrine resistance | 58/4020 | 98/8465 | 1.28e-02 | 3.19e-02 | 1.78e-02 | 58 |
| hsa015221 | Liver | HCC | Endocrine resistance | 58/4020 | 98/8465 | 1.28e-02 | 3.19e-02 | 1.78e-02 | 58 |
| hsa015226 | Oral cavity | OSCC | Endocrine resistance | 63/3704 | 98/8465 | 3.09e-05 | 1.31e-04 | 6.67e-05 | 63 |
| hsa0152214 | Oral cavity | OSCC | Endocrine resistance | 63/3704 | 98/8465 | 3.09e-05 | 1.31e-04 | 6.67e-05 | 63 |
| hsa015224 | Prostate | BPH | Endocrine resistance | 34/1718 | 98/8465 | 5.96e-04 | 2.98e-03 | 1.85e-03 | 34 |
| hsa0152213 | Prostate | BPH | Endocrine resistance | 34/1718 | 98/8465 | 5.96e-04 | 2.98e-03 | 1.85e-03 | 34 |
| hsa0152221 | Prostate | Tumor | Endocrine resistance | 37/1791 | 98/8465 | 1.17e-04 | 7.42e-04 | 4.60e-04 | 37 |
| hsa0152231 | Prostate | Tumor | Endocrine resistance | 37/1791 | 98/8465 | 1.17e-04 | 7.42e-04 | 4.60e-04 | 37 |
| Page: 1 |
Top |
Cell-cell communication analysis |
| Identification of potential cell-cell interactions between two cell types and their ligand-receptor pairs for different disease states |
| Ligand | Receptor | LRpair | Pathway | Tissue | Disease Stage |
| Page: 1 |
Top |
Single-cell gene regulatory network inference analysis |
| Find out the significant the regulons (TFs) and the target genes of each regulon across cell types for different disease states |
| TF | Cell Type | Tissue | Disease Stage | Target Gene | RSS | Regulon Activity |
| ∗The dot plots of a searched regulon are shown for all cell subpopulations in each disease state of each tissue based on the regulon specific score inferred using pySCENIC and by calculating the average expression. |
| Page: 1 |
Top |
Somatic mutation of malignant transformation related genes |
| Annotation of somatic variants for genes involved in malignant transformation |
| Hugo Symbol | Variant Class | Variant Classification | dbSNP RS | HGVSc | HGVSp | HGVSp Short | SWISSPROT | BIOTYPE | SIFT | PolyPhen | Tumor Sample Barcode | Tissue | Histology | Sex | Age | Stage | Therapy Types | Drugs | Outcome |
| BIK | SNV | Missense_Mutation | rs532663391 | c.400N>A | p.Glu134Lys | p.E134K | Q13323 | protein_coding | tolerated(0.83) | benign(0.003) | TCGA-DR-A0ZM-01 | Cervix | cervical & endocervical cancer | Female | <65 | III/IV | Unspecific | Cisplatin | SD |
| BIK | SNV | Missense_Mutation | rs4988415 | c.55N>A | p.Glu19Lys | p.E19K | Q13323 | protein_coding | deleterious(0.02) | possibly_damaging(0.549) | TCGA-AA-3663-01 | Colorectum | colon adenocarcinoma | Male | <65 | I/II | Unknown | Unknown | SD |
| BIK | SNV | Missense_Mutation | novel | c.427N>A | p.Leu143Met | p.L143M | Q13323 | protein_coding | tolerated_low_confidence(0.19) | benign(0.245) | TCGA-AA-3819-01 | Colorectum | colon adenocarcinoma | Female | <65 | I/II | Unknown | Unknown | SD |
| BIK | SNV | Missense_Mutation | c.94N>C | p.Met32Leu | p.M32L | Q13323 | protein_coding | tolerated(0.47) | benign(0) | TCGA-AX-A0IS-01 | Endometrium | uterine corpus endometrioid carcinoma | Female | <65 | I/II | Chemotherapy | carboplatin | PD | |
| BIK | SNV | Missense_Mutation | novel | c.184G>A | p.Ala62Thr | p.A62T | Q13323 | protein_coding | deleterious(0) | probably_damaging(0.987) | TCGA-AX-A2HD-01 | Endometrium | uterine corpus endometrioid carcinoma | Female | >=65 | III/IV | Unknown | Unknown | SD |
| BIK | SNV | Missense_Mutation | novel | c.115N>A | p.Leu39Met | p.L39M | Q13323 | protein_coding | tolerated(0.07) | possibly_damaging(0.486) | TCGA-B5-A3FA-01 | Endometrium | uterine corpus endometrioid carcinoma | Female | >=65 | I/II | Unknown | Unknown | SD |
| BIK | SNV | Missense_Mutation | rs545742731 | c.283N>A | p.Asp95Asn | p.D95N | Q13323 | protein_coding | tolerated(0.91) | benign(0.01) | TCGA-BS-A0TC-01 | Endometrium | uterine corpus endometrioid carcinoma | Female | >=65 | I/II | Unknown | Unknown | SD |
| BIK | SNV | Missense_Mutation | rs532663391 | c.400N>A | p.Glu134Lys | p.E134K | Q13323 | protein_coding | tolerated(0.83) | benign(0.003) | TCGA-EO-A22R-01 | Endometrium | uterine corpus endometrioid carcinoma | Female | <65 | I/II | Unknown | Unknown | SD |
| BIK | SNV | Missense_Mutation | novel | c.324N>A | p.Met108Ile | p.M108I | Q13323 | protein_coding | tolerated(0.69) | benign(0) | TCGA-DQ-7591-01 | Oral cavity | head & neck squamous cell carcinoma | Male | <65 | I/II | Chemotherapy | taxol | SD |
| Page: 1 |
Top |
Related drugs of malignant transformation related genes |
| Identification of chemicals and drugs interact with genes involved in malignant transfromation |
| (DGIdb 4.0) |
| Entrez ID | Symbol | Category | Interaction Types | Drug Claim Name | Drug Name | PMIDs |
| Page: 1 |

Copyright 2023-Present -The University of Texas Health Science Center at Houston |