
|
|||||
|
 | |
| |
| |
| |
| |
| |
|
Gene: BICC1 |
Gene summary for BICC1 |
| Gene information | Species | Human | Gene symbol | BICC1 | Gene ID | 80114 |
| Gene name | BicC family RNA binding protein 1 | |
| Gene Alias | BICC | |
| Cytomap | 10q21.1 | |
| Gene Type | protein-coding | GO ID | GO:0001655 | UniProtAcc | Q9H694 |
Top |
Malignant transformation analysis |
| Identification of the aberrant gene expression in precancerous and cancerous lesions by comparing the gene expression of stem-like cells in diseased tissues with normal stem cells |
| Entrez ID | Symbol | Replicates | Species | Organ | Tissue | Adj P-value | Log2FC | Malignancy |
| 80114 | BICC1 | S42 | Human | Liver | HCC | 9.49e-03 | -8.02e-01 | -0.0103 |
| 80114 | BICC1 | S43 | Human | Liver | Cirrhotic | 4.10e-18 | -2.11e-01 | -0.0187 |
| 80114 | BICC1 | HCC1_Meng | Human | Liver | HCC | 1.64e-81 | -6.29e-01 | 0.0246 |
| 80114 | BICC1 | HCC2_Meng | Human | Liver | HCC | 6.06e-28 | -7.23e-01 | 0.0107 |
| 80114 | BICC1 | cirrhotic1 | Human | Liver | Cirrhotic | 3.21e-26 | -4.02e-01 | 0.0202 |
| 80114 | BICC1 | cirrhotic2 | Human | Liver | Cirrhotic | 5.99e-23 | 3.31e-01 | 0.0201 |
| 80114 | BICC1 | cirrhotic3 | Human | Liver | Cirrhotic | 3.87e-20 | -1.05e-01 | 0.0215 |
| 80114 | BICC1 | p6 | Human | Liver | Cyst | 4.50e-06 | -8.63e-02 | -0.0218 |
| 80114 | BICC1 | HCC1 | Human | Liver | HCC | 5.84e-07 | 2.00e+00 | 0.5336 |
| 80114 | BICC1 | HCC2 | Human | Liver | HCC | 9.49e-10 | 1.88e+00 | 0.5341 |
| 80114 | BICC1 | HCC5 | Human | Liver | HCC | 8.27e-16 | -8.02e-01 | 0.4932 |
| 80114 | BICC1 | Pt13.a | Human | Liver | HCC | 1.84e-25 | -7.41e-01 | 0.021 |
| 80114 | BICC1 | Pt13.b | Human | Liver | HCC | 3.73e-23 | -6.62e-01 | 0.0251 |
| 80114 | BICC1 | Pt13.c | Human | Liver | HCC | 1.76e-15 | -7.83e-01 | 0.0076 |
| 80114 | BICC1 | Pt14.a | Human | Liver | HCC | 7.03e-04 | -5.78e-01 | 0.0169 |
| 80114 | BICC1 | Pt14.b | Human | Liver | HCC | 6.38e-05 | -4.36e-01 | 0.018 |
| 80114 | BICC1 | Pt14.c | Human | Liver | HCC | 1.88e-02 | -6.59e-01 | 0.0054 |
| 80114 | BICC1 | Pt14.d | Human | Liver | HCC | 9.73e-16 | -5.93e-01 | 0.0143 |
| 80114 | BICC1 | S014 | Human | Liver | HCC | 2.20e-16 | -7.58e-01 | 0.2254 |
| 80114 | BICC1 | S015 | Human | Liver | HCC | 1.22e-11 | -7.50e-01 | 0.2375 |
| Page: 1 2 3 |
| Tissue | Expression Dynamics | Abbreviation |
| Liver | 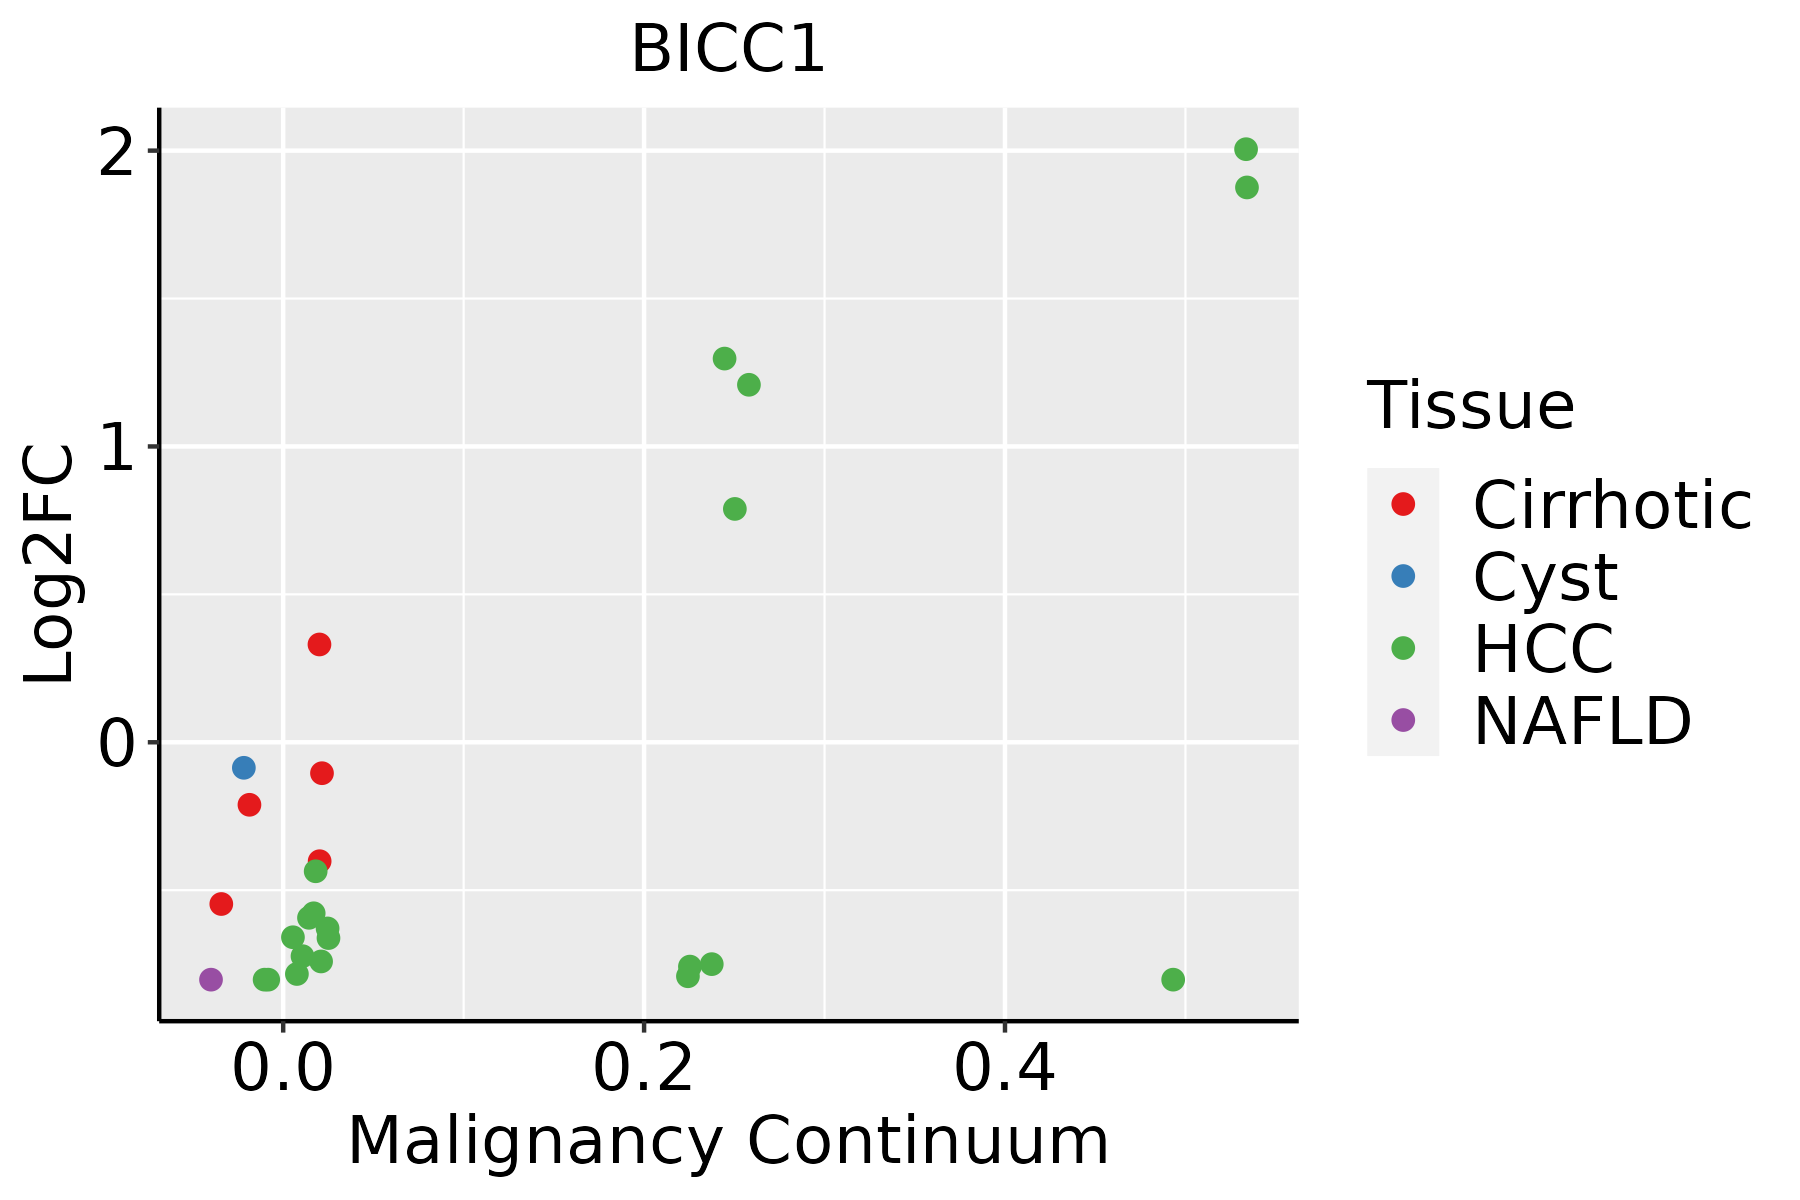 | HCC: Hepatocellular carcinoma |
| NAFLD: Non-alcoholic fatty liver disease | ||
| Lung | 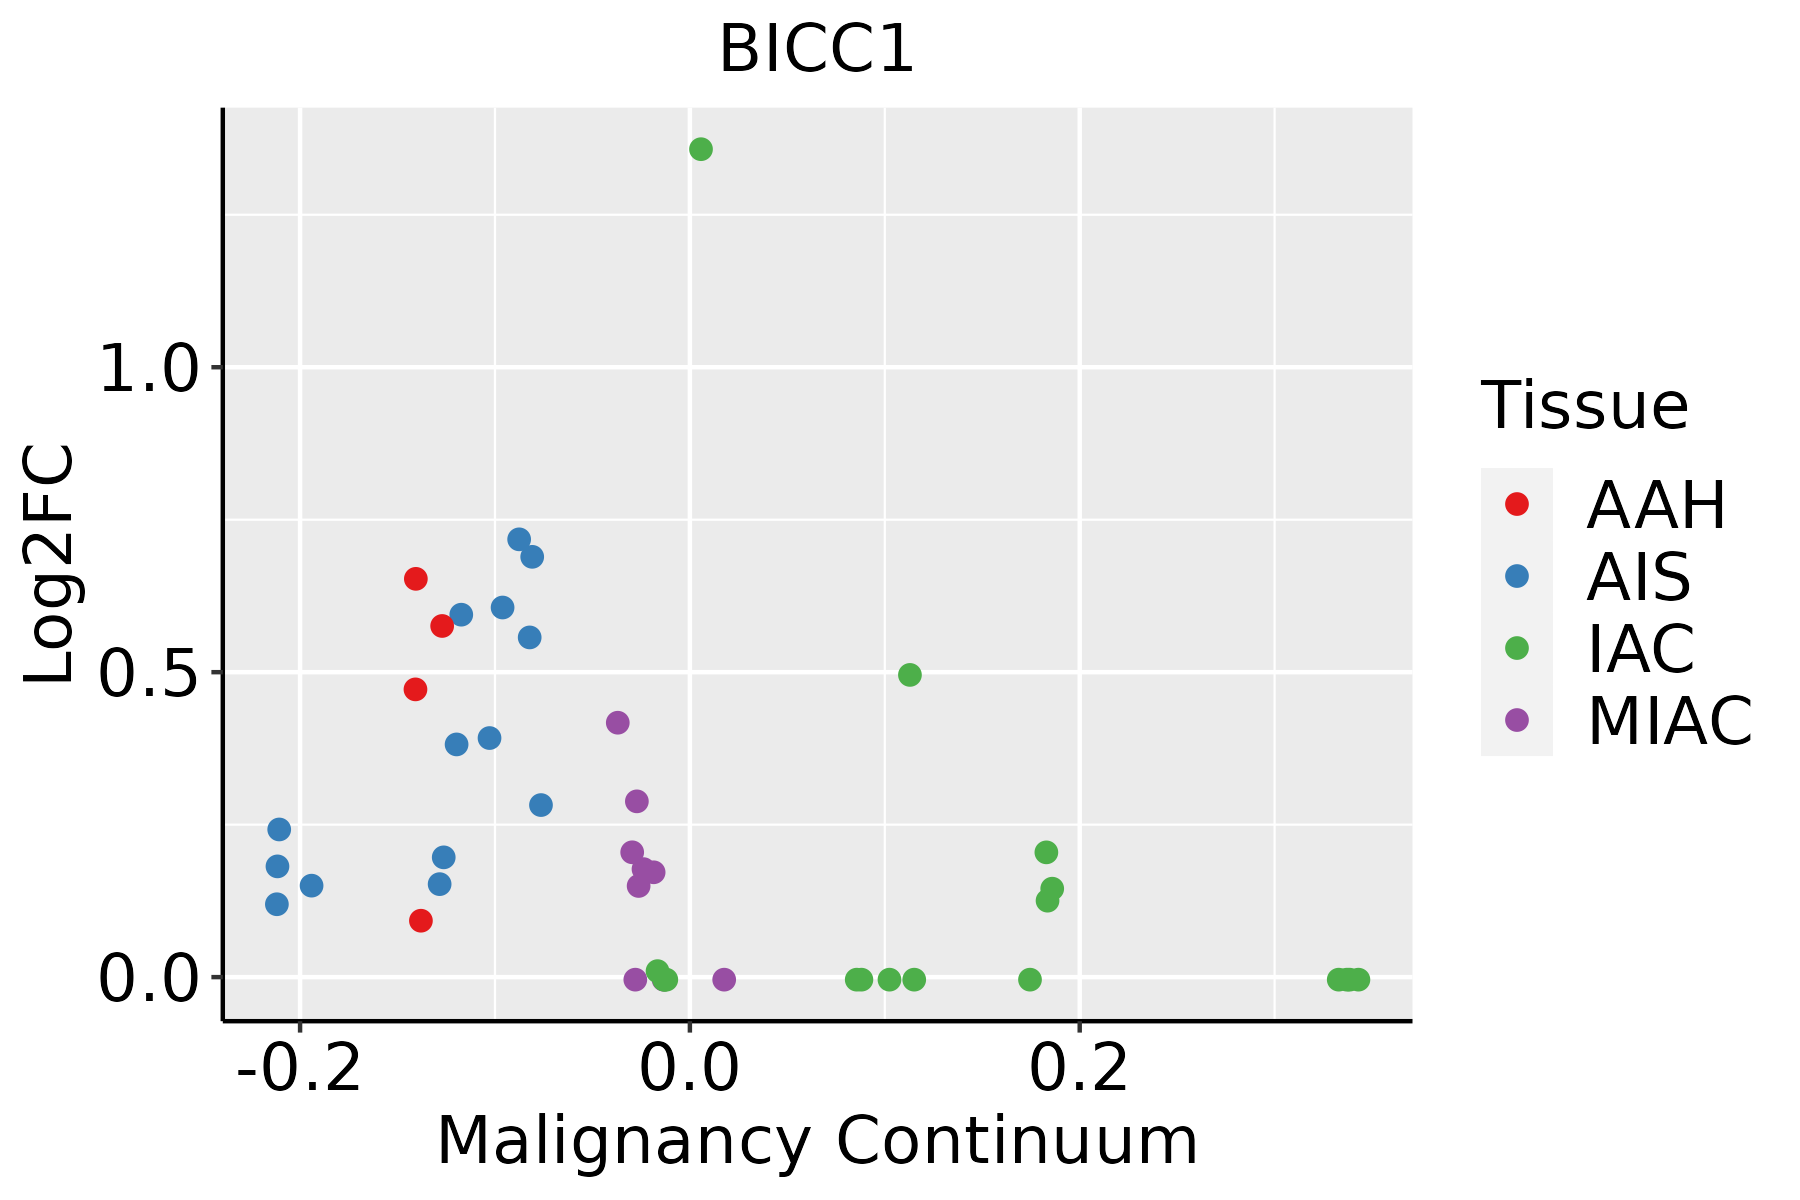 | AAH: Atypical adenomatous hyperplasia |
| AIS: Adenocarcinoma in situ | ||
| IAC: Invasive lung adenocarcinoma | ||
| MIA: Minimally invasive adenocarcinoma | ||
| Thyroid | 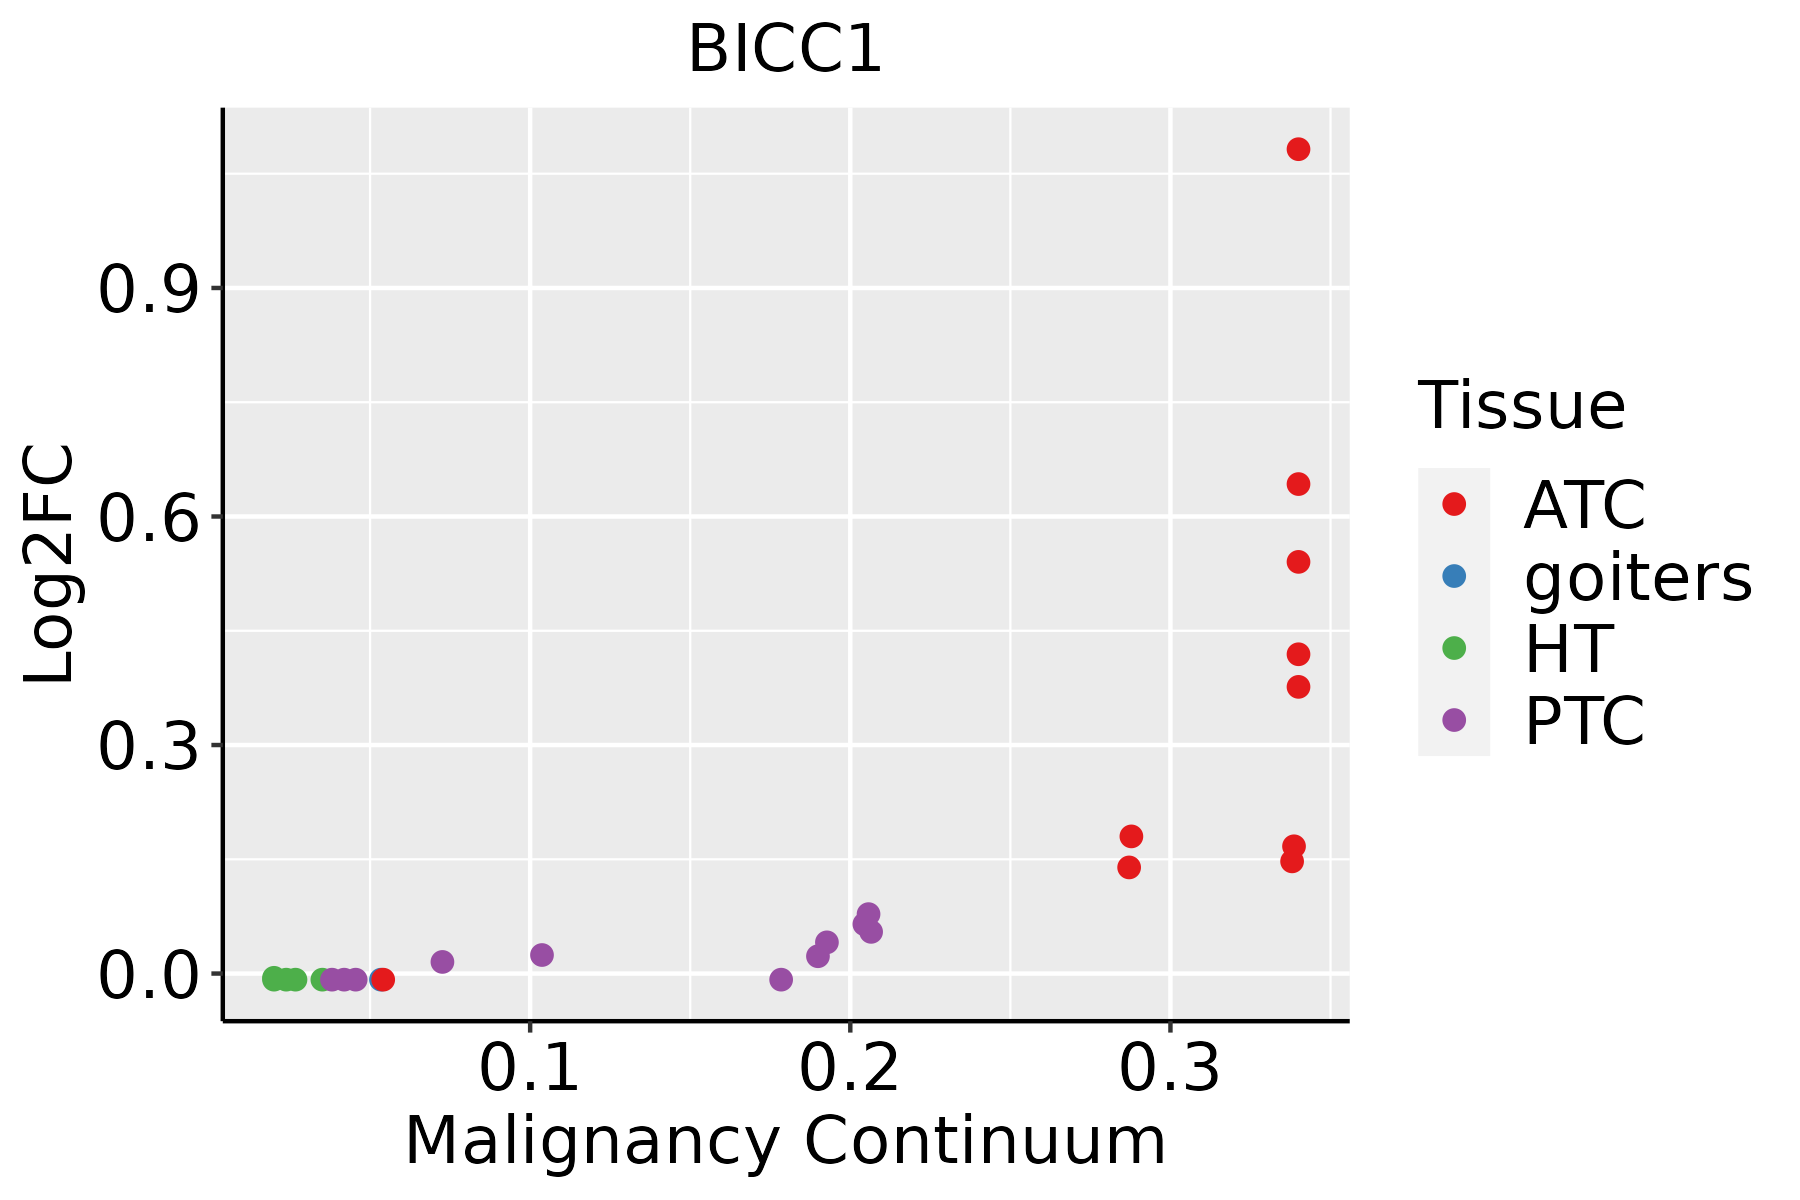 | ATC: Anaplastic thyroid cancer |
| HT: Hashimoto's thyroiditis | ||
| PTC: Papillary thyroid cancer |
| ∗log2FC in expression of this searched gene in stem-like cells from each diseased tissue sample relative to stem-like cells in normal samples in each tissue plotted against the malignancy continuum. Samples are colored based on if they are from different disease stage. |
Top |
Malignant transformation related pathway analysis |
| Find out the enriched GO biological processes and KEGG pathways involved in transition from healthy to precancer to cancer |
| Tissue | Disease Stage | Enriched GO biological Processes |
| Colorectum | AD |  |
| Colorectum | SER |  |
| Colorectum | MSS |  |
| Colorectum | MSI-H |  |
| Colorectum | FAP |  |
| ∗Top 15 enriched GO BP terms are showed in the bar plot of each disease state in each tissue. Each row represents a significant GO biological process which is colored according to the -log10(p.adjust). |
| Page: 1 2 3 4 5 6 7 8 9 |
| GO ID | Tissue | Disease Stage | Description | Gene Ratio | Bg Ratio | pvalue | p.adjust | Count |
| GO:001605511 | Liver | Cirrhotic | Wnt signaling pathway | 150/4634 | 444/18723 | 9.75e-06 | 1.42e-04 | 150 |
| GO:019873811 | Liver | Cirrhotic | cell-cell signaling by wnt | 150/4634 | 446/18723 | 1.28e-05 | 1.80e-04 | 150 |
| GO:003011111 | Liver | Cirrhotic | regulation of Wnt signaling pathway | 112/4634 | 328/18723 | 7.57e-05 | 8.40e-04 | 112 |
| GO:006082811 | Liver | Cirrhotic | regulation of canonical Wnt signaling pathway | 86/4634 | 253/18723 | 5.70e-04 | 4.46e-03 | 86 |
| GO:006007011 | Liver | Cirrhotic | canonical Wnt signaling pathway | 97/4634 | 303/18723 | 2.42e-03 | 1.46e-02 | 97 |
| GO:019873821 | Liver | HCC | cell-cell signaling by wnt | 247/7958 | 446/18723 | 2.11e-08 | 4.96e-07 | 247 |
| GO:001605521 | Liver | HCC | Wnt signaling pathway | 245/7958 | 444/18723 | 3.68e-08 | 8.09e-07 | 245 |
| GO:003011121 | Liver | HCC | regulation of Wnt signaling pathway | 180/7958 | 328/18723 | 3.62e-06 | 4.72e-05 | 180 |
| GO:006007021 | Liver | HCC | canonical Wnt signaling pathway | 162/7958 | 303/18723 | 7.00e-05 | 6.32e-04 | 162 |
| GO:006082821 | Liver | HCC | regulation of canonical Wnt signaling pathway | 137/7958 | 253/18723 | 1.15e-04 | 9.70e-04 | 137 |
| GO:00016553 | Liver | HCC | urogenital system development | 170/7958 | 338/18723 | 2.15e-03 | 1.08e-02 | 170 |
| GO:00018222 | Liver | HCC | kidney development | 148/7958 | 293/18723 | 3.25e-03 | 1.49e-02 | 148 |
| GO:00720012 | Liver | HCC | renal system development | 152/7958 | 302/18723 | 3.45e-03 | 1.56e-02 | 152 |
| GO:00160556 | Lung | IAC | Wnt signaling pathway | 95/2061 | 444/18723 | 1.13e-10 | 2.80e-08 | 95 |
| GO:01987386 | Lung | IAC | cell-cell signaling by wnt | 95/2061 | 446/18723 | 1.46e-10 | 3.48e-08 | 95 |
| GO:00301116 | Lung | IAC | regulation of Wnt signaling pathway | 74/2061 | 328/18723 | 1.14e-09 | 2.05e-07 | 74 |
| GO:00608286 | Lung | IAC | regulation of canonical Wnt signaling pathway | 54/2061 | 253/18723 | 1.25e-06 | 6.46e-05 | 54 |
| GO:00600706 | Lung | IAC | canonical Wnt signaling pathway | 61/2061 | 303/18723 | 2.09e-06 | 9.45e-05 | 61 |
| GO:00016554 | Lung | IAC | urogenital system development | 59/2061 | 338/18723 | 2.27e-04 | 3.93e-03 | 59 |
| GO:00301783 | Lung | IAC | negative regulation of Wnt signaling pathway | 32/2061 | 170/18723 | 1.68e-03 | 1.76e-02 | 32 |
| Page: 1 2 3 |
| Pathway ID | Tissue | Disease Stage | Description | Gene Ratio | Bg Ratio | pvalue | p.adjust | qvalue | Count |
| Page: 1 |
Top |
Cell-cell communication analysis |
| Identification of potential cell-cell interactions between two cell types and their ligand-receptor pairs for different disease states |
| Ligand | Receptor | LRpair | Pathway | Tissue | Disease Stage |
| Page: 1 |
Top |
Single-cell gene regulatory network inference analysis |
| Find out the significant the regulons (TFs) and the target genes of each regulon across cell types for different disease states |
| TF | Cell Type | Tissue | Disease Stage | Target Gene | RSS | Regulon Activity |
| ∗The dot plots of a searched regulon are shown for all cell subpopulations in each disease state of each tissue based on the regulon specific score inferred using pySCENIC and by calculating the average expression. |
| Page: 1 |
Top |
Somatic mutation of malignant transformation related genes |
| Annotation of somatic variants for genes involved in malignant transformation |
| Hugo Symbol | Variant Class | Variant Classification | dbSNP RS | HGVSc | HGVSp | HGVSp Short | SWISSPROT | BIOTYPE | SIFT | PolyPhen | Tumor Sample Barcode | Tissue | Histology | Sex | Age | Stage | Therapy Types | Drugs | Outcome |
| BICC1 | SNV | Missense_Mutation | c.1214N>C | p.Leu405Ser | p.L405S | Q9H694 | protein_coding | tolerated(0.45) | possibly_damaging(0.558) | TCGA-A2-A04T-01 | Breast | breast invasive carcinoma | Female | <65 | I/II | Chemotherapy | cyclophosphamide | SD | |
| BICC1 | SNV | Missense_Mutation | c.1080N>A | p.Met360Ile | p.M360I | Q9H694 | protein_coding | tolerated(0.33) | benign(0.001) | TCGA-AR-A0TU-01 | Breast | breast invasive carcinoma | Female | <65 | I/II | Unspecific | Doxorubicin | SD | |
| BICC1 | SNV | Missense_Mutation | c.1936A>T | p.Met646Leu | p.M646L | Q9H694 | protein_coding | tolerated(0.21) | benign(0) | TCGA-D8-A143-01 | Breast | breast invasive carcinoma | Female | <65 | I/II | Chemotherapy | doxorubicin | SD | |
| BICC1 | SNV | Missense_Mutation | c.664G>A | p.Asp222Asn | p.D222N | Q9H694 | protein_coding | deleterious(0.01) | possibly_damaging(0.877) | TCGA-D8-A1J8-01 | Breast | breast invasive carcinoma | Female | >=65 | I/II | Hormone Therapy | nolvadex | SD | |
| BICC1 | SNV | Missense_Mutation | c.1135N>A | p.Asp379Asn | p.D379N | Q9H694 | protein_coding | tolerated(0.06) | probably_damaging(0.989) | TCGA-D8-A27G-01 | Breast | breast invasive carcinoma | Female | >=65 | I/II | Unknown | Unknown | SD | |
| BICC1 | SNV | Missense_Mutation | c.1935G>C | p.Gln645His | p.Q645H | Q9H694 | protein_coding | deleterious(0.01) | probably_damaging(0.986) | TCGA-GM-A2D9-01 | Breast | breast invasive carcinoma | Female | >=65 | I/II | Hormone Therapy | arimidex | SD | |
| BICC1 | SNV | Missense_Mutation | novel | c.2117N>A | p.Ala706Glu | p.A706E | Q9H694 | protein_coding | deleterious(0.01) | probably_damaging(0.994) | TCGA-OL-A66N-01 | Breast | breast invasive carcinoma | Female | <65 | III/IV | Unknown | Unknown | SD |
| BICC1 | SNV | Missense_Mutation | novel | c.2863G>T | p.Ala955Ser | p.A955S | Q9H694 | protein_coding | deleterious(0.01) | benign(0.223) | TCGA-2W-A8YY-01 | Cervix | cervical & endocervical cancer | Female | <65 | I/II | Chemotherapy | cisplatin | CR |
| BICC1 | SNV | Missense_Mutation | c.2302N>T | p.Pro768Ser | p.P768S | Q9H694 | protein_coding | deleterious(0) | probably_damaging(0.996) | TCGA-C5-A1BN-01 | Cervix | cervical & endocervical cancer | Female | <65 | I/II | Chemotherapy | cisplatin | PD | |
| BICC1 | SNV | Missense_Mutation | rs757528583 | c.2491G>A | p.Ala831Thr | p.A831T | Q9H694 | protein_coding | tolerated(0.46) | benign(0) | TCGA-C5-A7X8-01 | Cervix | cervical & endocervical cancer | Female | <65 | I/II | Chemotherapy | cisplatin | SD |
| Page: 1 2 3 4 5 6 7 8 9 10 11 12 13 14 15 |
Top |
Related drugs of malignant transformation related genes |
| Identification of chemicals and drugs interact with genes involved in malignant transfromation |
| (DGIdb 4.0) |
| Entrez ID | Symbol | Category | Interaction Types | Drug Claim Name | Drug Name | PMIDs |
| Page: 1 |

Copyright 2023-Present -The University of Texas Health Science Center at Houston |