
|
|||||
|
 | |
| |
| |
| |
| |
| |
|
Gene: BHLHE41 |
Gene summary for BHLHE41 |
| Gene information | Species | Human | Gene symbol | BHLHE41 | Gene ID | 79365 |
| Gene name | basic helix-loop-helix family member e41 | |
| Gene Alias | BHLHB3 | |
| Cytomap | 12p12.1 | |
| Gene Type | protein-coding | GO ID | GO:0000122 | UniProtAcc | A0A024RAV8 |
Top |
Malignant transformation analysis |
| Identification of the aberrant gene expression in precancerous and cancerous lesions by comparing the gene expression of stem-like cells in diseased tissues with normal stem cells |
| Entrez ID | Symbol | Replicates | Species | Organ | Tissue | Adj P-value | Log2FC | Malignancy |
| 79365 | BHLHE41 | LZE3D | Human | Esophagus | HGIN | 1.24e-02 | 7.07e-01 | 0.0668 |
| 79365 | BHLHE41 | P2T-E | Human | Esophagus | ESCC | 5.09e-28 | 7.93e-01 | 0.1177 |
| 79365 | BHLHE41 | P8T-E | Human | Esophagus | ESCC | 6.40e-09 | 2.31e-01 | 0.0889 |
| 79365 | BHLHE41 | P16T-E | Human | Esophagus | ESCC | 2.66e-11 | 2.73e-01 | 0.1153 |
| 79365 | BHLHE41 | P20T-E | Human | Esophagus | ESCC | 2.18e-08 | 1.26e-01 | 0.1124 |
| 79365 | BHLHE41 | P22T-E | Human | Esophagus | ESCC | 1.96e-04 | 1.75e-01 | 0.1236 |
| 79365 | BHLHE41 | P24T-E | Human | Esophagus | ESCC | 8.74e-04 | 1.68e-01 | 0.1287 |
| 79365 | BHLHE41 | P31T-E | Human | Esophagus | ESCC | 9.72e-15 | 3.31e-01 | 0.1251 |
| 79365 | BHLHE41 | P32T-E | Human | Esophagus | ESCC | 9.05e-07 | 1.67e-01 | 0.1666 |
| 79365 | BHLHE41 | P36T-E | Human | Esophagus | ESCC | 1.87e-05 | 2.62e-01 | 0.1187 |
| 79365 | BHLHE41 | P37T-E | Human | Esophagus | ESCC | 1.15e-14 | 4.68e-01 | 0.1371 |
| 79365 | BHLHE41 | P40T-E | Human | Esophagus | ESCC | 1.26e-05 | 2.77e-01 | 0.109 |
| 79365 | BHLHE41 | P44T-E | Human | Esophagus | ESCC | 1.45e-07 | 1.90e-01 | 0.1096 |
| 79365 | BHLHE41 | P47T-E | Human | Esophagus | ESCC | 3.90e-05 | 1.13e-01 | 0.1067 |
| 79365 | BHLHE41 | P48T-E | Human | Esophagus | ESCC | 2.30e-02 | 1.07e-01 | 0.0959 |
| 79365 | BHLHE41 | P49T-E | Human | Esophagus | ESCC | 5.71e-07 | 4.60e-01 | 0.1768 |
| 79365 | BHLHE41 | P54T-E | Human | Esophagus | ESCC | 1.89e-08 | 3.07e-01 | 0.0975 |
| 79365 | BHLHE41 | P57T-E | Human | Esophagus | ESCC | 1.30e-11 | 4.43e-01 | 0.0926 |
| 79365 | BHLHE41 | P62T-E | Human | Esophagus | ESCC | 1.98e-14 | 3.69e-01 | 0.1302 |
| 79365 | BHLHE41 | P65T-E | Human | Esophagus | ESCC | 1.05e-05 | 8.73e-02 | 0.0978 |
| Page: 1 2 |
| Tissue | Expression Dynamics | Abbreviation |
| Esophagus |  | ESCC: Esophageal squamous cell carcinoma |
| HGIN: High-grade intraepithelial neoplasias | ||
| LGIN: Low-grade intraepithelial neoplasias | ||
| Thyroid | 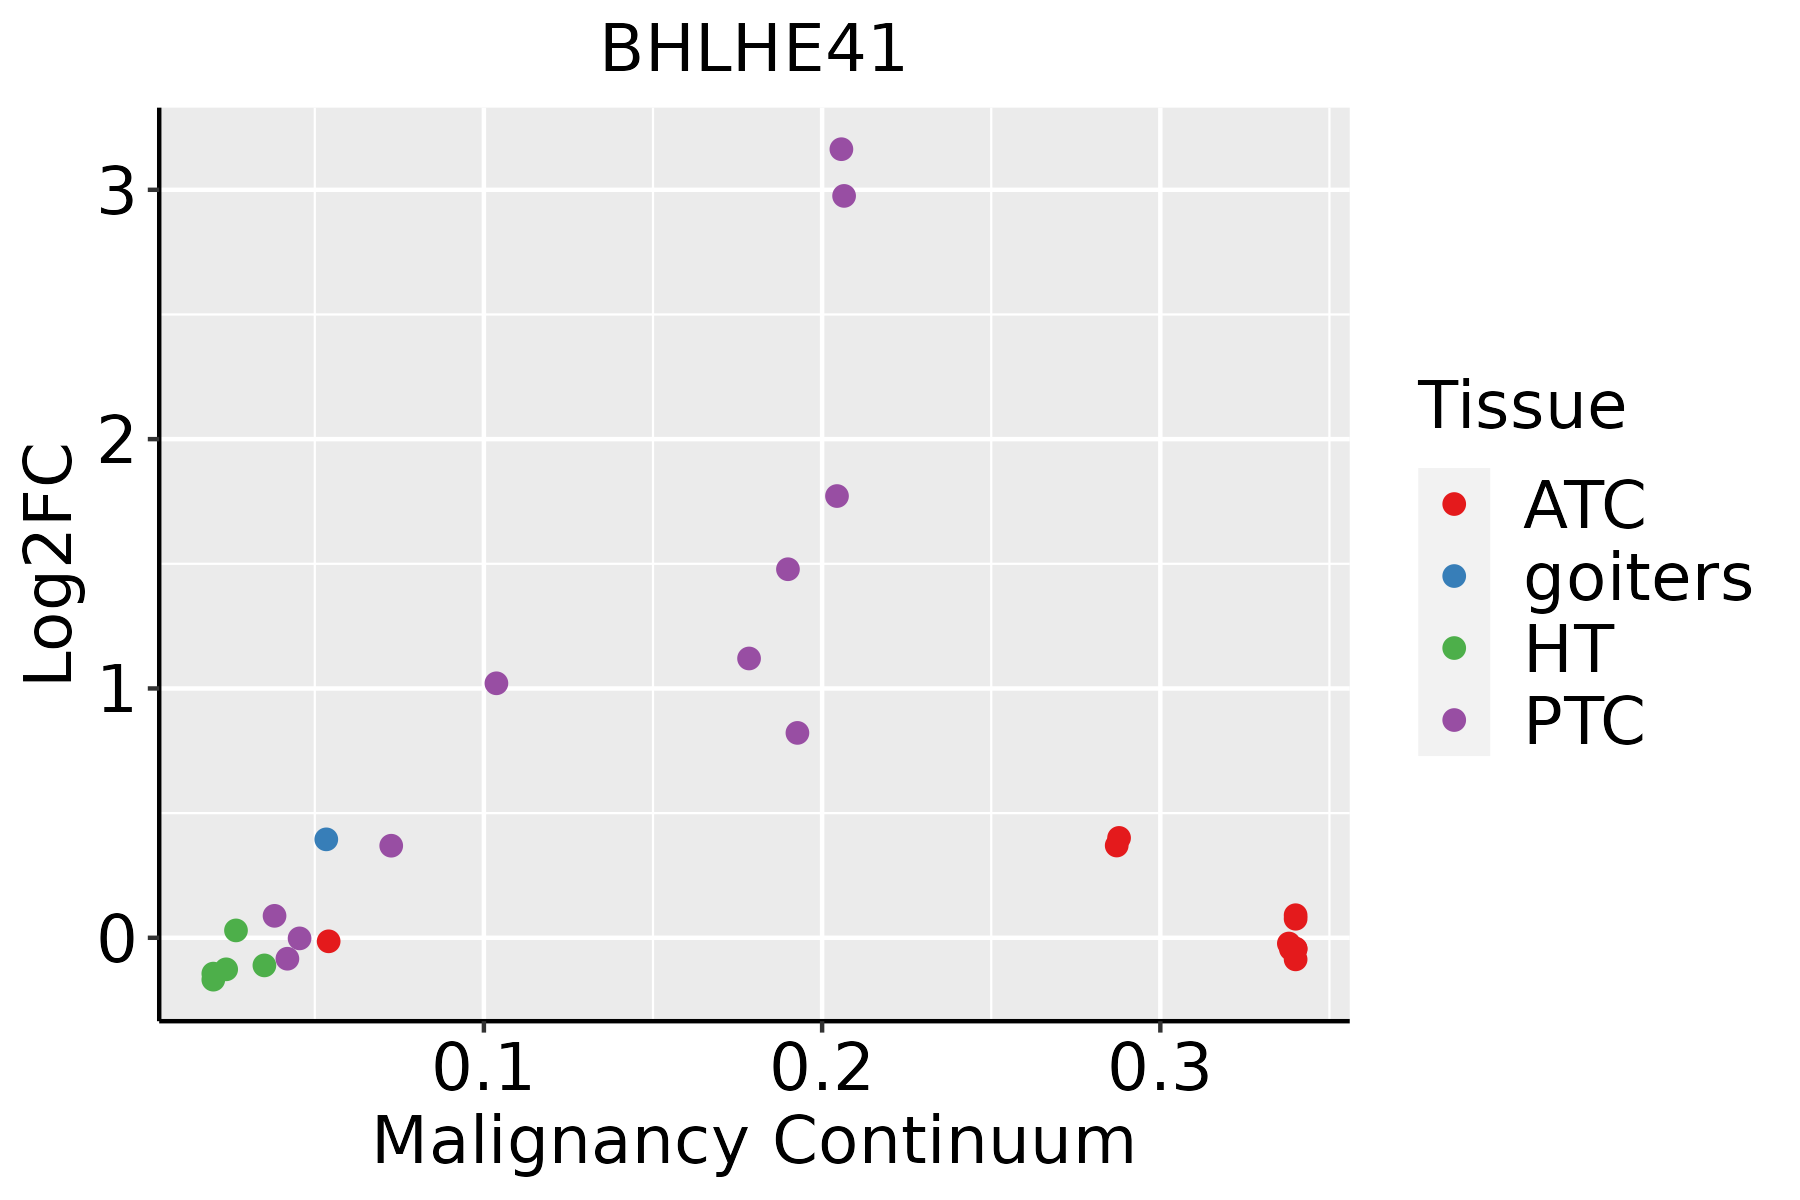 | ATC: Anaplastic thyroid cancer |
| HT: Hashimoto's thyroiditis | ||
| PTC: Papillary thyroid cancer |
| ∗log2FC in expression of this searched gene in stem-like cells from each diseased tissue sample relative to stem-like cells in normal samples in each tissue plotted against the malignancy continuum. Samples are colored based on if they are from different disease stage. |
Top |
Malignant transformation related pathway analysis |
| Find out the enriched GO biological processes and KEGG pathways involved in transition from healthy to precancer to cancer |
| Tissue | Disease Stage | Enriched GO biological Processes |
| Colorectum | AD |  |
| Colorectum | SER |  |
| Colorectum | MSS |  |
| Colorectum | MSI-H |  |
| Colorectum | FAP |  |
| ∗Top 15 enriched GO BP terms are showed in the bar plot of each disease state in each tissue. Each row represents a significant GO biological process which is colored according to the -log10(p.adjust). |
| Page: 1 2 3 4 5 6 7 8 9 |
| GO ID | Tissue | Disease Stage | Description | Gene Ratio | Bg Ratio | pvalue | p.adjust | Count |
| GO:003292215 | Esophagus | ESCC | circadian regulation of gene expression | 48/8552 | 68/18723 | 2.76e-05 | 2.30e-04 | 48 |
| GO:005076710 | Esophagus | ESCC | regulation of neurogenesis | 203/8552 | 364/18723 | 6.10e-05 | 4.68e-04 | 203 |
| GO:00519606 | Esophagus | ESCC | regulation of nervous system development | 237/8552 | 443/18723 | 5.02e-04 | 2.78e-03 | 237 |
| GO:004851118 | Esophagus | ESCC | rhythmic process | 164/8552 | 298/18723 | 6.80e-04 | 3.57e-03 | 164 |
| GO:000762319 | Esophagus | ESCC | circadian rhythm | 119/8552 | 210/18723 | 8.47e-04 | 4.36e-03 | 119 |
| GO:003292219 | Thyroid | PTC | circadian regulation of gene expression | 43/5968 | 68/18723 | 1.03e-07 | 2.05e-06 | 43 |
| GO:005076716 | Thyroid | PTC | regulation of neurogenesis | 156/5968 | 364/18723 | 5.86e-06 | 7.05e-05 | 156 |
| GO:0048511111 | Thyroid | PTC | rhythmic process | 131/5968 | 298/18723 | 7.06e-06 | 8.33e-05 | 131 |
| GO:0007623111 | Thyroid | PTC | circadian rhythm | 96/5968 | 210/18723 | 1.74e-05 | 1.82e-04 | 96 |
| GO:00519608 | Thyroid | PTC | regulation of nervous system development | 177/5968 | 443/18723 | 1.72e-04 | 1.32e-03 | 177 |
| GO:005076723 | Thyroid | ATC | regulation of neurogenesis | 168/6293 | 364/18723 | 3.73e-07 | 5.48e-06 | 168 |
| GO:003292223 | Thyroid | ATC | circadian regulation of gene expression | 43/6293 | 68/18723 | 5.45e-07 | 7.79e-06 | 43 |
| GO:004851124 | Thyroid | ATC | rhythmic process | 141/6293 | 298/18723 | 5.58e-07 | 7.93e-06 | 141 |
| GO:005196014 | Thyroid | ATC | regulation of nervous system development | 195/6293 | 443/18723 | 2.62e-06 | 3.06e-05 | 195 |
| GO:000762325 | Thyroid | ATC | circadian rhythm | 100/6293 | 210/18723 | 1.67e-05 | 1.54e-04 | 100 |
| GO:004269216 | Thyroid | ATC | muscle cell differentiation | 165/6293 | 384/18723 | 7.17e-05 | 5.46e-04 | 165 |
| GO:005114617 | Thyroid | ATC | striated muscle cell differentiation | 119/6293 | 283/18723 | 1.74e-03 | 8.70e-03 | 119 |
| Page: 1 |
| Pathway ID | Tissue | Disease Stage | Description | Gene Ratio | Bg Ratio | pvalue | p.adjust | qvalue | Count |
| Page: 1 |
Top |
Cell-cell communication analysis |
| Identification of potential cell-cell interactions between two cell types and their ligand-receptor pairs for different disease states |
| Ligand | Receptor | LRpair | Pathway | Tissue | Disease Stage |
| Page: 1 |
Top |
Single-cell gene regulatory network inference analysis |
| Find out the significant the regulons (TFs) and the target genes of each regulon across cell types for different disease states |
| TF | Cell Type | Tissue | Disease Stage | Target Gene | RSS | Regulon Activity |
| BHLHE41 | DC | Breast | DCIS | CLEC9A,C3,CX3CR1, etc. | 9.52e-02 |  |
| BHLHE41 | INMON | Breast | DCIS | CLEC9A,C3,CX3CR1, etc. | 3.58e-02 | |
| BHLHE41 | DC | Breast | Healthy | CLEC9A,C3,CX3CR1, etc. | 3.99e-01 |  |
| BHLHE41 | BN | Breast | Healthy | CLEC9A,C3,CX3CR1, etc. | 2.66e-02 | |
| BHLHE41 | BN | Breast | Precancer | CLEC9A,C3,CX3CR1, etc. | 5.34e-02 |  |
| BHLHE41 | DC | Breast | Precancer | CLEC9A,C3,CX3CR1, etc. | 5.35e-02 | |
| BHLHE41 | M1MAC | Breast | Precancer | CLEC9A,C3,CX3CR1, etc. | 4.99e-02 | |
| BHLHE41 | MES | Cervix | N_HPV | TFF3,EID1,XBP1, etc. | 5.95e-02 |  |
| BHLHE41 | PLA | Colorectum | AD | TCTN3,PCBD2,ZC4H2, etc. | 4.61e-01 |  |
| BHLHE41 | PLA | Colorectum | CRC | TCTN3,PCBD2,ZC4H2, etc. | 2.66e-01 |  |
| ∗The dot plots of a searched regulon are shown for all cell subpopulations in each disease state of each tissue based on the regulon specific score inferred using pySCENIC and by calculating the average expression. |
| Page: 1 2 3 |
Top |
Somatic mutation of malignant transformation related genes |
| Annotation of somatic variants for genes involved in malignant transformation |
| Hugo Symbol | Variant Class | Variant Classification | dbSNP RS | HGVSc | HGVSp | HGVSp Short | SWISSPROT | BIOTYPE | SIFT | PolyPhen | Tumor Sample Barcode | Tissue | Histology | Sex | Age | Stage | Therapy Types | Drugs | Outcome |
| BHLHE41 | SNV | Missense_Mutation | c.301G>A | p.Ala101Thr | p.A101T | Q9C0J9 | protein_coding | tolerated(0.2) | benign(0.14) | TCGA-A8-A09Q-01 | Breast | breast invasive carcinoma | Female | >=65 | III/IV | Hormone Therapy | anastrozole | SD | |
| BHLHE41 | SNV | Missense_Mutation | c.556N>G | p.Leu186Val | p.L186V | Q9C0J9 | protein_coding | tolerated(0.43) | benign(0.005) | TCGA-AC-A23H-01 | Breast | breast invasive carcinoma | Female | >=65 | I/II | Unknown | Unknown | PD | |
| BHLHE41 | SNV | Missense_Mutation | c.553N>A | p.Pro185Thr | p.P185T | Q9C0J9 | protein_coding | tolerated(0.06) | benign(0.003) | TCGA-BH-A18G-01 | Breast | breast invasive carcinoma | Female | >=65 | I/II | Unknown | Unknown | SD | |
| BHLHE41 | insertion | In_Frame_Ins | novel | c.140_141insCATTGGAACGAGCCCATTTCCCGAAGC | p.Leu47delinsPheIleGlyThrSerProPheProGluAla | p.L47delinsFIGTSPFPEA | Q9C0J9 | protein_coding | TCGA-AO-A0JB-01 | Breast | breast invasive carcinoma | Female | <65 | III/IV | Chemotherapy | cyclophosphamide | SD | ||
| BHLHE41 | deletion | Frame_Shift_Del | novel | c.532delN | p.Gln178SerfsTer3 | p.Q178Sfs*3 | Q9C0J9 | protein_coding | TCGA-D8-A27V-01 | Breast | breast invasive carcinoma | Female | <65 | I/II | Hormone Therapy | tamoxiphen | SD | ||
| BHLHE41 | SNV | Missense_Mutation | novel | c.52N>T | p.Asp18Tyr | p.D18Y | Q9C0J9 | protein_coding | deleterious(0) | probably_damaging(0.986) | TCGA-2W-A8YY-01 | Cervix | cervical & endocervical cancer | Female | <65 | I/II | Chemotherapy | cisplatin | CR |
| BHLHE41 | SNV | Missense_Mutation | novel | c.7G>A | p.Glu3Lys | p.E3K | Q9C0J9 | protein_coding | deleterious_low_confidence(0) | probably_damaging(0.986) | TCGA-VS-A9UH-01 | Cervix | cervical & endocervical cancer | Female | <65 | I/II | Chemotherapy | cisplatin | CR |
| BHLHE41 | SNV | Missense_Mutation | c.55N>G | p.Phe19Val | p.F19V | Q9C0J9 | protein_coding | tolerated(0.16) | benign(0.043) | TCGA-AA-3977-01 | Colorectum | colon adenocarcinoma | Male | >=65 | I/II | Unknown | Unknown | SD | |
| BHLHE41 | SNV | Missense_Mutation | novel | c.355N>C | p.Ser119Pro | p.S119P | Q9C0J9 | protein_coding | tolerated(0.06) | possibly_damaging(0.777) | TCGA-AA-A00N-01 | Colorectum | colon adenocarcinoma | Male | >=65 | I/II | Unknown | Unknown | PD |
| BHLHE41 | SNV | Missense_Mutation | c.436C>T | p.Leu146Phe | p.L146F | Q9C0J9 | protein_coding | deleterious(0) | probably_damaging(0.997) | TCGA-AG-3726-01 | Colorectum | rectum adenocarcinoma | Female | <65 | I/II | Unknown | Unknown | SD |
| Page: 1 2 3 |
Top |
Related drugs of malignant transformation related genes |
| Identification of chemicals and drugs interact with genes involved in malignant transfromation |
| (DGIdb 4.0) |
| Entrez ID | Symbol | Category | Interaction Types | Drug Claim Name | Drug Name | PMIDs |
| Page: 1 |

Copyright 2023-Present -The University of Texas Health Science Center at Houston |