
|
|||||
|
 | |
| |
| |
| |
| |
| |
|
Gene: BHLHE40 |
Gene summary for BHLHE40 |
| Gene information | Species | Human | Gene symbol | BHLHE40 | Gene ID | 8553 |
| Gene name | basic helix-loop-helix family member e40 | |
| Gene Alias | BHLHB2 | |
| Cytomap | 3p26.1 | |
| Gene Type | protein-coding | GO ID | GO:0000122 | UniProtAcc | O14503 |
Top |
Malignant transformation analysis |
| Identification of the aberrant gene expression in precancerous and cancerous lesions by comparing the gene expression of stem-like cells in diseased tissues with normal stem cells |
| Entrez ID | Symbol | Replicates | Species | Organ | Tissue | Adj P-value | Log2FC | Malignancy |
| 8553 | BHLHE40 | GSM4909281 | Human | Breast | IDC | 1.01e-04 | -3.46e-01 | 0.21 |
| 8553 | BHLHE40 | GSM4909285 | Human | Breast | IDC | 3.82e-10 | 7.88e-02 | 0.21 |
| 8553 | BHLHE40 | GSM4909286 | Human | Breast | IDC | 1.63e-22 | -5.36e-01 | 0.1081 |
| 8553 | BHLHE40 | GSM4909290 | Human | Breast | IDC | 4.99e-02 | -3.48e-01 | 0.2096 |
| 8553 | BHLHE40 | GSM4909293 | Human | Breast | IDC | 1.56e-05 | -2.11e-01 | 0.1581 |
| 8553 | BHLHE40 | GSM4909294 | Human | Breast | IDC | 5.73e-17 | -4.63e-01 | 0.2022 |
| 8553 | BHLHE40 | GSM4909296 | Human | Breast | IDC | 1.36e-06 | -3.75e-01 | 0.1524 |
| 8553 | BHLHE40 | GSM4909298 | Human | Breast | IDC | 7.74e-08 | -1.43e-02 | 0.1551 |
| 8553 | BHLHE40 | GSM4909308 | Human | Breast | IDC | 2.69e-03 | 8.69e-02 | 0.158 |
| 8553 | BHLHE40 | GSM4909311 | Human | Breast | IDC | 5.34e-12 | -2.93e-01 | 0.1534 |
| 8553 | BHLHE40 | GSM4909319 | Human | Breast | IDC | 1.25e-13 | -1.65e-01 | 0.1563 |
| 8553 | BHLHE40 | GSM4909320 | Human | Breast | IDC | 1.07e-02 | -4.54e-01 | 0.1575 |
| 8553 | BHLHE40 | ctrl6 | Human | Breast | Precancer | 5.47e-28 | 1.11e+00 | -0.0061 |
| 8553 | BHLHE40 | brca1 | Human | Breast | Precancer | 1.27e-09 | -3.97e-01 | -0.0338 |
| 8553 | BHLHE40 | brca2 | Human | Breast | Precancer | 2.56e-04 | 5.31e-02 | -0.024 |
| 8553 | BHLHE40 | brca7 | Human | Breast | Precancer | 1.24e-07 | 1.04e+00 | -0.009 |
| 8553 | BHLHE40 | brca10 | Human | Breast | Precancer | 7.85e-81 | 1.42e+00 | -0.0029 |
| 8553 | BHLHE40 | NCCBC5 | Human | Breast | DCIS | 2.90e-02 | -2.98e-01 | 0.2046 |
| 8553 | BHLHE40 | P1 | Human | Breast | IDC | 1.26e-03 | -2.47e-01 | 0.1527 |
| 8553 | BHLHE40 | DCIS2 | Human | Breast | DCIS | 5.58e-30 | 1.95e-02 | 0.0085 |
| Page: 1 2 3 4 5 6 7 8 9 10 11 |
| Tissue | Expression Dynamics | Abbreviation |
| Breast | 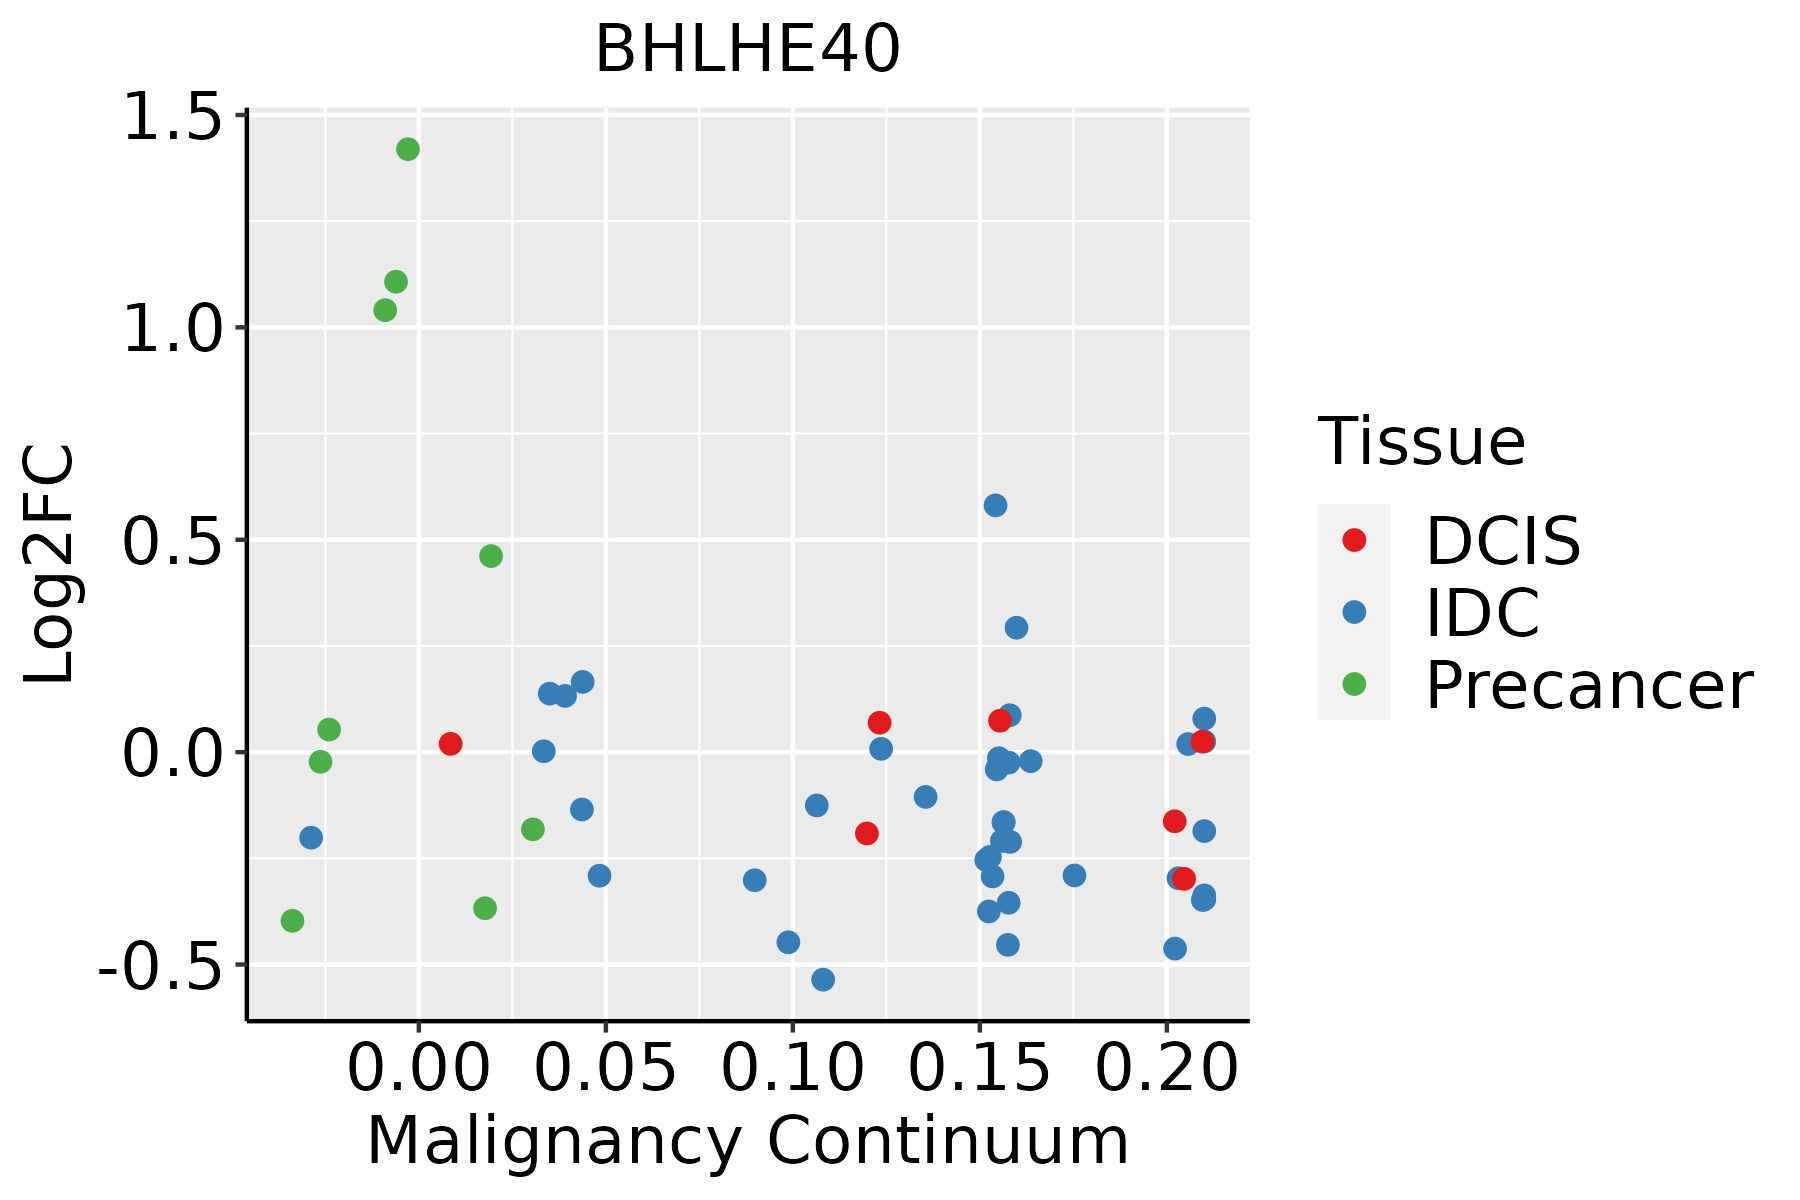 | IDC: Invasive ductal carcinoma |
| DCIS: Ductal carcinoma in situ | ||
| Precancer(BRCA1-mut): Precancerous lesion from BRCA1 mutation carriers | ||
| Endometrium |  | AEH: Atypical endometrial hyperplasia |
| EEC: Endometrioid Cancer | ||
| Esophagus | 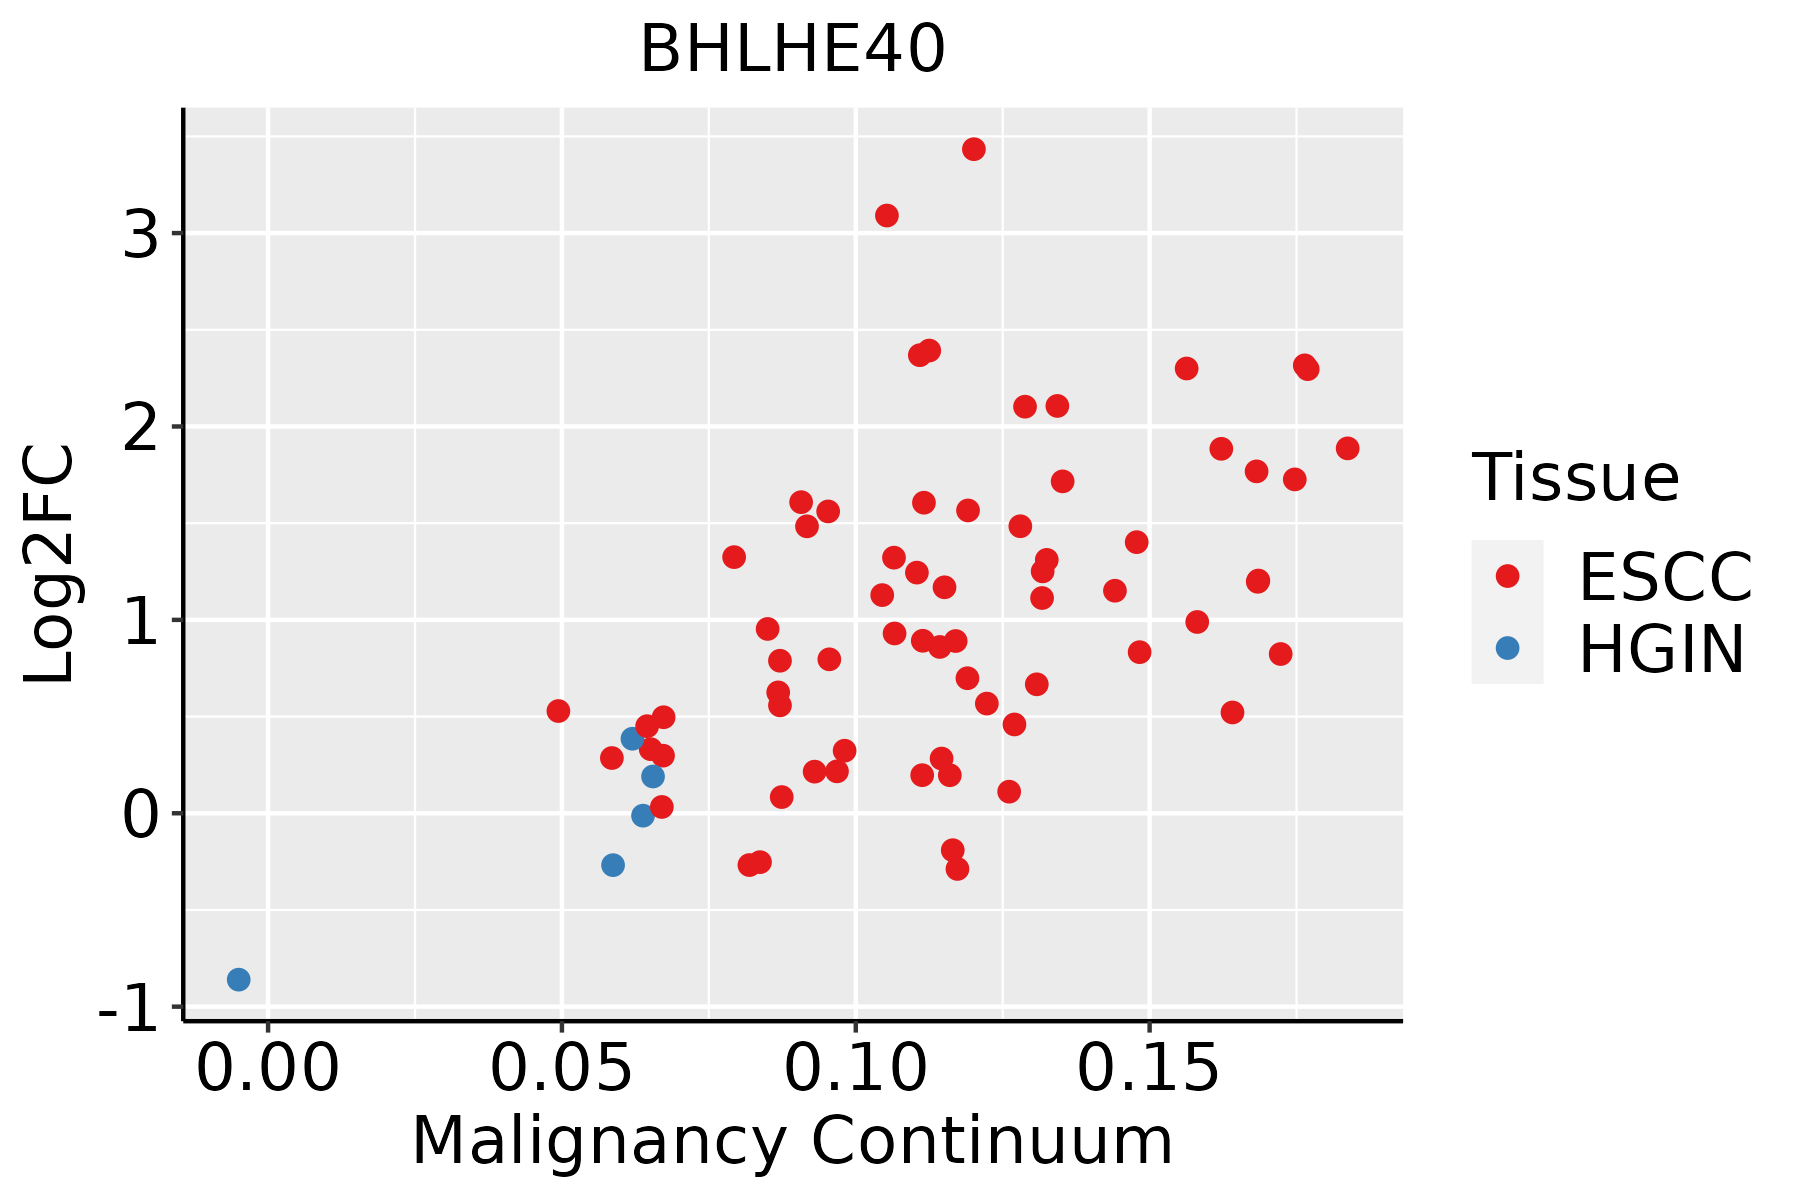 | ESCC: Esophageal squamous cell carcinoma |
| HGIN: High-grade intraepithelial neoplasias | ||
| LGIN: Low-grade intraepithelial neoplasias | ||
| GC | 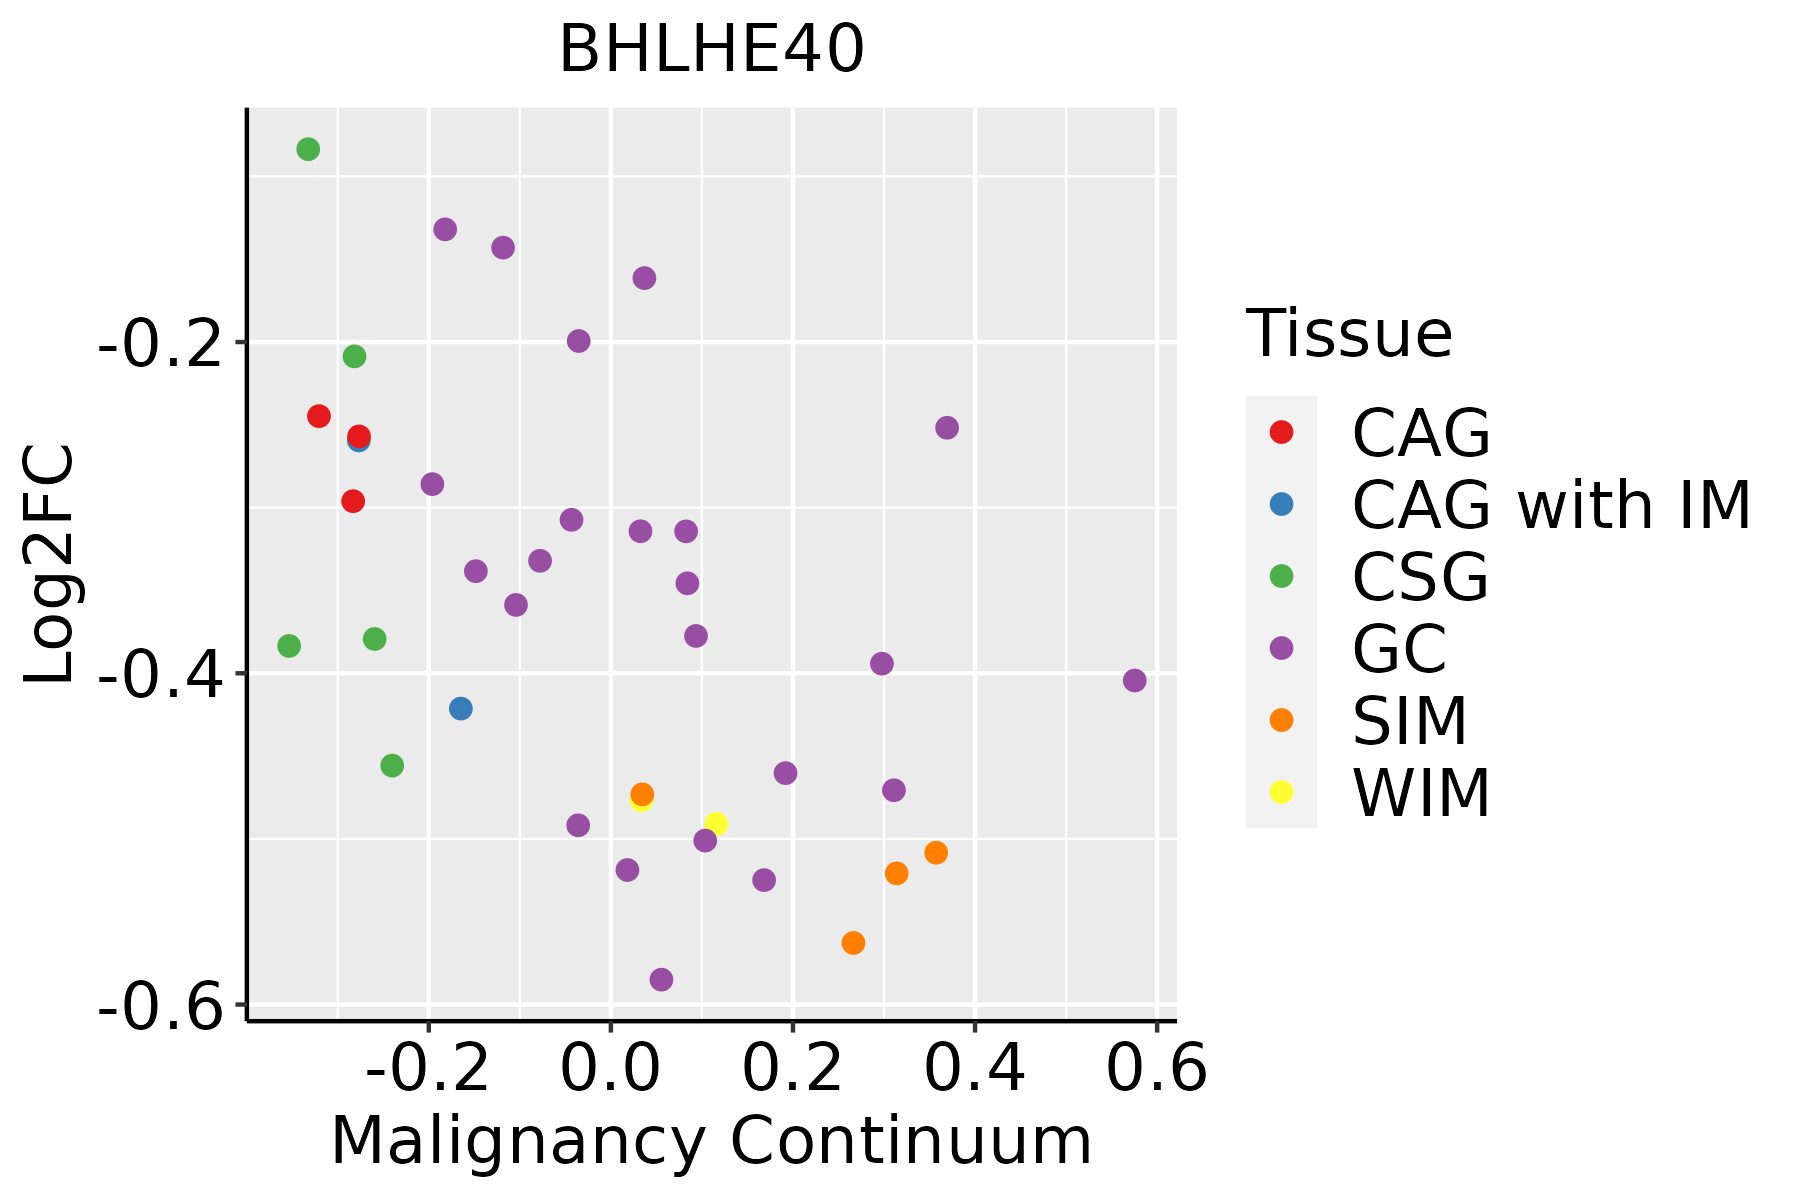 | CAG: Chronic atrophic gastritis |
| CAG with IM: Chronic atrophic gastritis with intestinal metaplasia | ||
| CSG: Chronic superficial gastritis | ||
| GC: Gastric cancer | ||
| SIM: Severe intestinal metaplasia | ||
| WIM: Wild intestinal metaplasia | ||
| Liver | 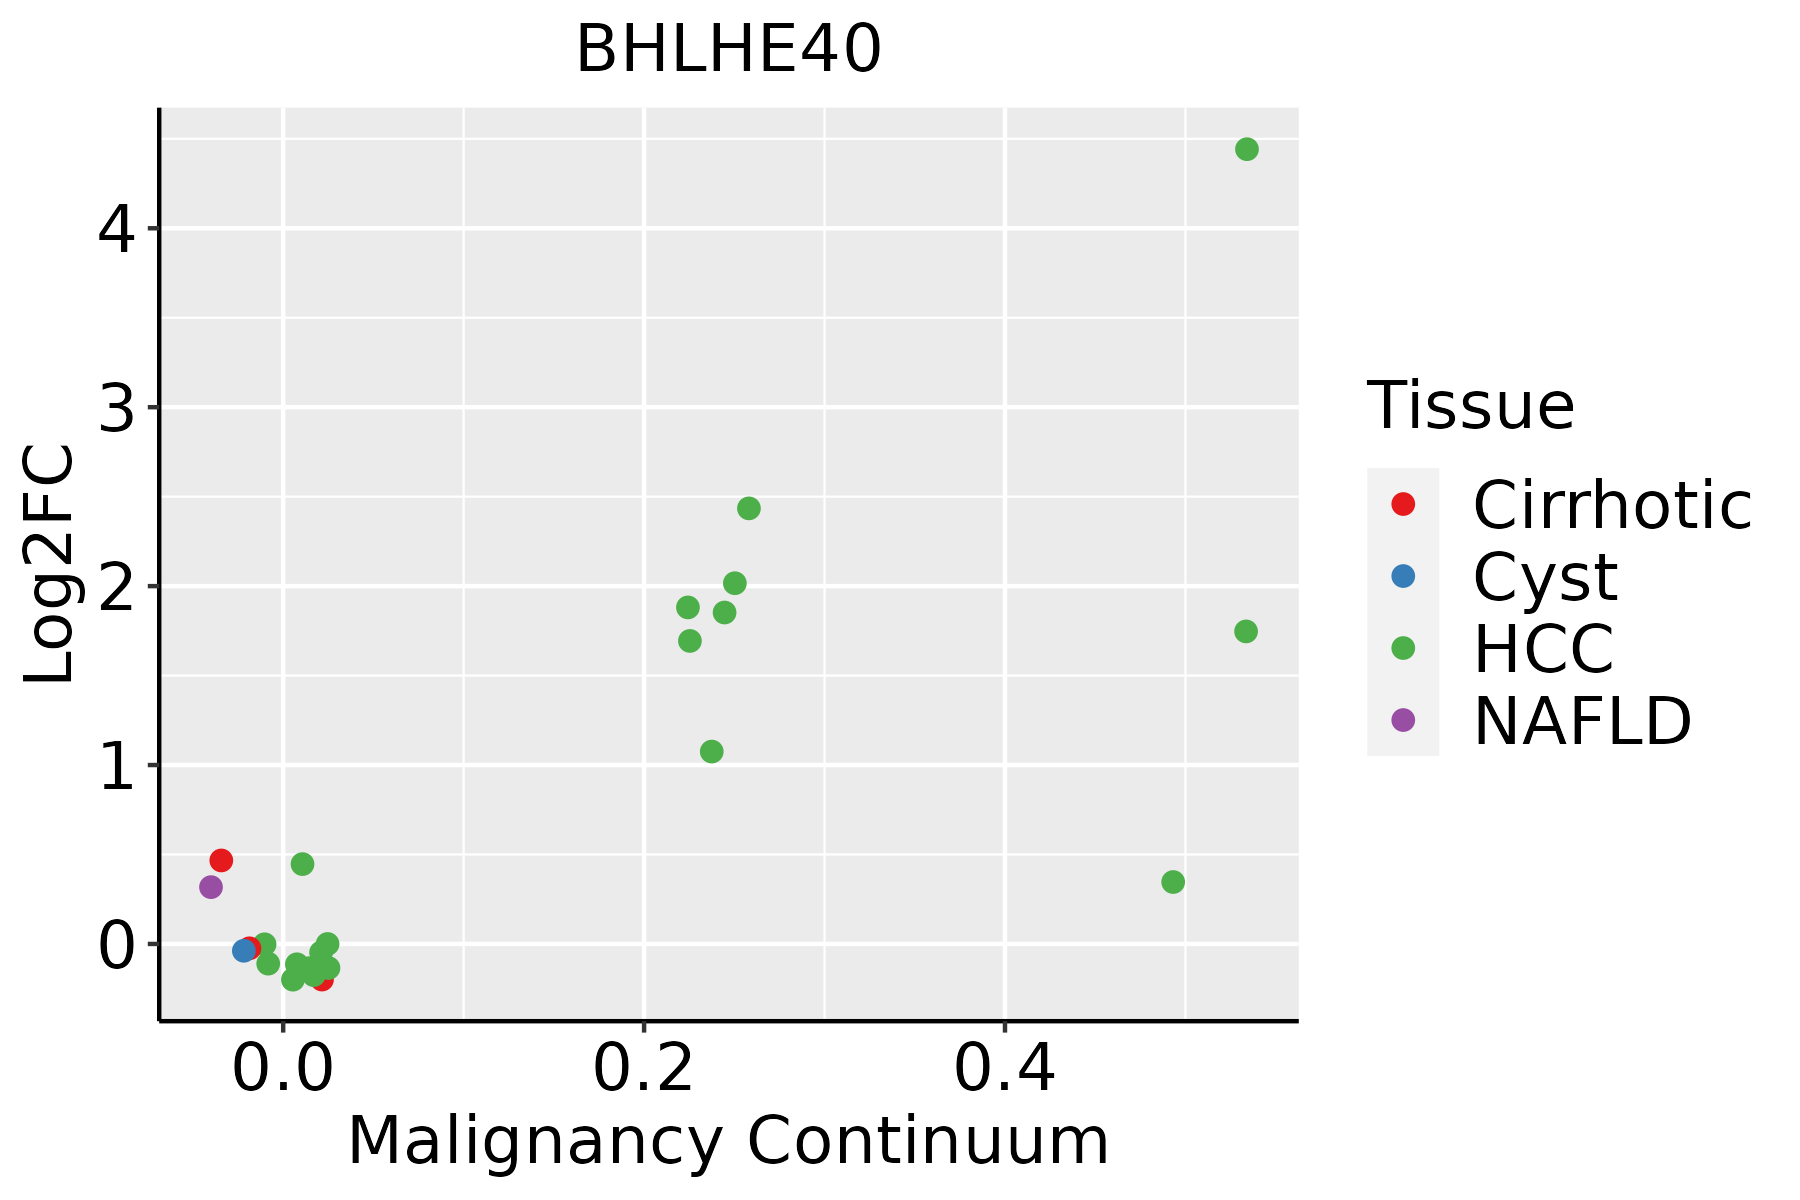 | HCC: Hepatocellular carcinoma |
| NAFLD: Non-alcoholic fatty liver disease | ||
| Lung |  | AAH: Atypical adenomatous hyperplasia |
| AIS: Adenocarcinoma in situ | ||
| IAC: Invasive lung adenocarcinoma | ||
| MIA: Minimally invasive adenocarcinoma | ||
| Oral Cavity | 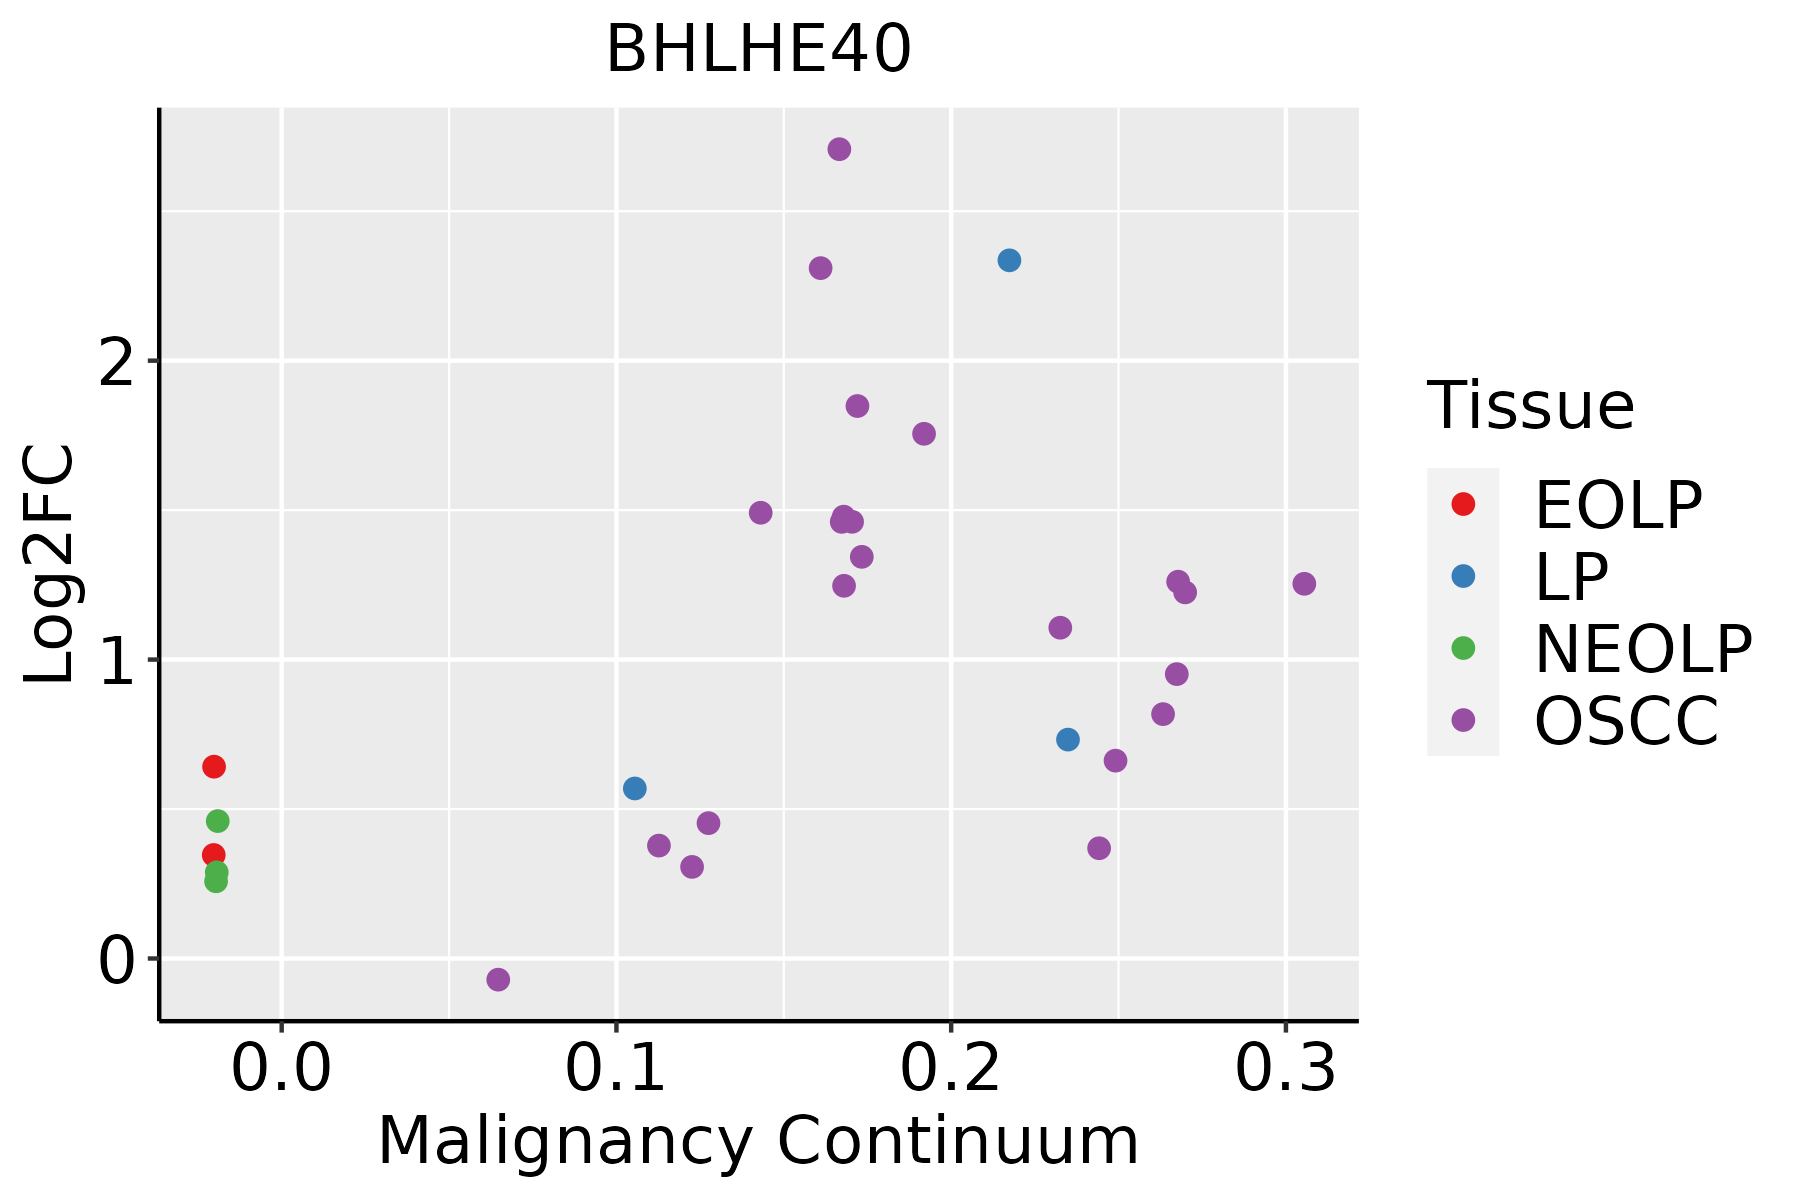 | EOLP: Erosive Oral lichen planus |
| LP: leukoplakia | ||
| NEOLP: Non-erosive oral lichen planus | ||
| OSCC: Oral squamous cell carcinoma | ||
| Prostate |  | BPH: Benign Prostatic Hyperplasia |
| Skin |  | AK: Actinic keratosis |
| cSCC: Cutaneous squamous cell carcinoma | ||
| SCCIS:squamous cell carcinoma in situ | ||
| Thyroid |  | ATC: Anaplastic thyroid cancer |
| HT: Hashimoto's thyroiditis | ||
| PTC: Papillary thyroid cancer |
| ∗log2FC in expression of this searched gene in stem-like cells from each diseased tissue sample relative to stem-like cells in normal samples in each tissue plotted against the malignancy continuum. Samples are colored based on if they are from different disease stage. |
Top |
Malignant transformation related pathway analysis |
| Find out the enriched GO biological processes and KEGG pathways involved in transition from healthy to precancer to cancer |
| Tissue | Disease Stage | Enriched GO biological Processes |
| Colorectum | AD |  |
| Colorectum | SER |  |
| Colorectum | MSS |  |
| Colorectum | MSI-H |  |
| Colorectum | FAP |  |
| ∗Top 15 enriched GO BP terms are showed in the bar plot of each disease state in each tissue. Each row represents a significant GO biological process which is colored according to the -log10(p.adjust). |
| Page: 1 2 3 4 5 6 7 8 9 |
| GO ID | Tissue | Disease Stage | Description | Gene Ratio | Bg Ratio | pvalue | p.adjust | Count |
| GO:00093148 | Breast | Precancer | response to radiation | 47/1080 | 456/18723 | 8.39e-05 | 1.62e-03 | 47 |
| GO:00329225 | Breast | Precancer | circadian regulation of gene expression | 10/1080 | 68/18723 | 5.39e-03 | 4.00e-02 | 10 |
| GO:000931412 | Breast | IDC | response to radiation | 62/1434 | 456/18723 | 6.91e-06 | 2.10e-04 | 62 |
| GO:00485117 | Breast | IDC | rhythmic process | 38/1434 | 298/18723 | 1.34e-03 | 1.39e-02 | 38 |
| GO:000931422 | Breast | DCIS | response to radiation | 62/1390 | 456/18723 | 2.56e-06 | 8.87e-05 | 62 |
| GO:004851113 | Breast | DCIS | rhythmic process | 37/1390 | 298/18723 | 1.44e-03 | 1.47e-02 | 37 |
| GO:00485119 | Endometrium | AEH | rhythmic process | 67/2100 | 298/18723 | 1.69e-08 | 1.04e-06 | 67 |
| GO:00076239 | Endometrium | AEH | circadian rhythm | 47/2100 | 210/18723 | 2.54e-06 | 7.28e-05 | 47 |
| GO:00329227 | Endometrium | AEH | circadian regulation of gene expression | 22/2100 | 68/18723 | 2.65e-06 | 7.57e-05 | 22 |
| GO:00427527 | Endometrium | AEH | regulation of circadian rhythm | 25/2100 | 121/18723 | 1.79e-03 | 1.43e-02 | 25 |
| GO:00510905 | Endometrium | AEH | regulation of DNA-binding transcription factor activity | 69/2100 | 440/18723 | 2.51e-03 | 1.87e-02 | 69 |
| GO:000931410 | Endometrium | AEH | response to radiation | 70/2100 | 456/18723 | 3.99e-03 | 2.68e-02 | 70 |
| GO:00507677 | Endometrium | AEH | regulation of neurogenesis | 56/2100 | 364/18723 | 8.87e-03 | 4.82e-02 | 56 |
| GO:004851114 | Endometrium | EEC | rhythmic process | 67/2168 | 298/18723 | 5.86e-08 | 3.11e-06 | 67 |
| GO:003292212 | Endometrium | EEC | circadian regulation of gene expression | 22/2168 | 68/18723 | 4.49e-06 | 1.14e-04 | 22 |
| GO:000762314 | Endometrium | EEC | circadian rhythm | 46/2168 | 210/18723 | 1.37e-05 | 2.73e-04 | 46 |
| GO:005109013 | Endometrium | EEC | regulation of DNA-binding transcription factor activity | 75/2168 | 440/18723 | 3.71e-04 | 3.97e-03 | 75 |
| GO:004275213 | Endometrium | EEC | regulation of circadian rhythm | 24/2168 | 121/18723 | 5.69e-03 | 3.42e-02 | 24 |
| GO:000931413 | Endometrium | EEC | response to radiation | 71/2168 | 456/18723 | 5.69e-03 | 3.42e-02 | 71 |
| GO:000931419 | Esophagus | ESCC | response to radiation | 277/8552 | 456/18723 | 4.42e-11 | 1.43e-09 | 277 |
| Page: 1 2 3 4 5 6 7 |
| Pathway ID | Tissue | Disease Stage | Description | Gene Ratio | Bg Ratio | pvalue | p.adjust | qvalue | Count |
| hsa047105 | Esophagus | ESCC | Circadian rhythm | 24/4205 | 34/8465 | 1.09e-02 | 2.51e-02 | 1.29e-02 | 24 |
| hsa0471012 | Esophagus | ESCC | Circadian rhythm | 24/4205 | 34/8465 | 1.09e-02 | 2.51e-02 | 1.29e-02 | 24 |
| hsa047104 | Prostate | BPH | Circadian rhythm | 15/1718 | 34/8465 | 1.40e-03 | 5.85e-03 | 3.62e-03 | 15 |
| hsa0471011 | Prostate | BPH | Circadian rhythm | 15/1718 | 34/8465 | 1.40e-03 | 5.85e-03 | 3.62e-03 | 15 |
| Page: 1 |
Top |
Cell-cell communication analysis |
| Identification of potential cell-cell interactions between two cell types and their ligand-receptor pairs for different disease states |
| Ligand | Receptor | LRpair | Pathway | Tissue | Disease Stage |
| Page: 1 |
Top |
Single-cell gene regulatory network inference analysis |
| Find out the significant the regulons (TFs) and the target genes of each regulon across cell types for different disease states |
| TF | Cell Type | Tissue | Disease Stage | Target Gene | RSS | Regulon Activity |
| BHLHE40 | CT | Colorectum | ADJ | DUOX2,DUOXA2,CKB, etc. | 6.23e-02 |  |
| BHLHE40 | DUCT1 | Pancreas | PDAC | SLC2A1,VMP1,VEGFA, etc. | 6.33e-01 |  |
| ∗The dot plots of a searched regulon are shown for all cell subpopulations in each disease state of each tissue based on the regulon specific score inferred using pySCENIC and by calculating the average expression. |
| Page: 1 |
Top |
Somatic mutation of malignant transformation related genes |
| Annotation of somatic variants for genes involved in malignant transformation |
| Hugo Symbol | Variant Class | Variant Classification | dbSNP RS | HGVSc | HGVSp | HGVSp Short | SWISSPROT | BIOTYPE | SIFT | PolyPhen | Tumor Sample Barcode | Tissue | Histology | Sex | Age | Stage | Therapy Types | Drugs | Outcome |
| BHLHE40 | deletion | In_Frame_Del | c.344_352delNNNNNNNNN | p.Gln115_Ile118delinsLeu | p.Q115_I118delinsL | O14503 | protein_coding | TCGA-A8-A09I-01 | Breast | breast invasive carcinoma | Female | >=65 | I/II | Hormone Therapy | anastrozole | SD | |||
| BHLHE40 | insertion | In_Frame_Ins | novel | c.456_457insCTTACCTTGAAGCAT | p.Glu152_Val153insLeuThrLeuLysHis | p.E152_V153insLTLKH | O14503 | protein_coding | TCGA-BH-A0B1-01 | Breast | breast invasive carcinoma | Female | >=65 | I/II | Chemotherapy | adriamycin | SD | ||
| BHLHE40 | insertion | In_Frame_Ins | novel | c.458_459insGAAAGCACTAACAAACCTAATTGATCAGCA | p.Val153_Leu154insLysAlaLeuThrAsnLeuIleAspGlnGln | p.V153_L154insKALTNLIDQQ | O14503 | protein_coding | TCGA-BH-A0B1-01 | Breast | breast invasive carcinoma | Female | >=65 | I/II | Chemotherapy | adriamycin | SD | ||
| BHLHE40 | insertion | Frame_Shift_Ins | novel | c.1185_1186insA | p.Leu396IlefsTer35 | p.L396Ifs*35 | O14503 | protein_coding | TCGA-BH-A0EE-01 | Breast | breast invasive carcinoma | Female | >=65 | I/II | Chemotherapy | docetaxel | SD | ||
| BHLHE40 | insertion | Frame_Shift_Ins | novel | c.1187_1188insTTCAGGATTCCCTA | p.Leu396PhefsTer10 | p.L396Ffs*10 | O14503 | protein_coding | TCGA-BH-A0EE-01 | Breast | breast invasive carcinoma | Female | >=65 | I/II | Chemotherapy | docetaxel | SD | ||
| BHLHE40 | SNV | Missense_Mutation | novel | c.91G>A | p.Ala31Thr | p.A31T | O14503 | protein_coding | tolerated(0.47) | benign(0.001) | TCGA-2W-A8YY-01 | Cervix | cervical & endocervical cancer | Female | <65 | I/II | Chemotherapy | cisplatin | CR |
| BHLHE40 | SNV | Missense_Mutation | novel | c.208N>C | p.Glu70Gln | p.E70Q | O14503 | protein_coding | deleterious(0) | probably_damaging(0.93) | TCGA-VS-A958-01 | Cervix | cervical & endocervical cancer | Female | <65 | I/II | Chemotherapy | cisplatin | CR |
| BHLHE40 | SNV | Missense_Mutation | rs775412121 | c.635N>T | p.Ser212Leu | p.S212L | O14503 | protein_coding | tolerated(0.26) | benign(0.048) | TCGA-AZ-4315-01 | Colorectum | colon adenocarcinoma | Male | <65 | I/II | Unknown | Unknown | SD |
| BHLHE40 | SNV | Missense_Mutation | c.353N>G | p.Ile118Ser | p.I118S | O14503 | protein_coding | deleterious(0) | possibly_damaging(0.745) | TCGA-CA-6718-01 | Colorectum | colon adenocarcinoma | Male | <65 | I/II | Unknown | Unknown | PD | |
| BHLHE40 | SNV | Missense_Mutation | c.1105N>T | p.Asp369Tyr | p.D369Y | O14503 | protein_coding | deleterious(0) | possibly_damaging(0.707) | TCGA-F4-6856-01 | Colorectum | colon adenocarcinoma | Male | <65 | I/II | Ancillary | leucovorin | CR |
| Page: 1 2 3 4 5 |
Top |
Related drugs of malignant transformation related genes |
| Identification of chemicals and drugs interact with genes involved in malignant transfromation |
| (DGIdb 4.0) |
| Entrez ID | Symbol | Category | Interaction Types | Drug Claim Name | Drug Name | PMIDs |
| 8553 | BHLHE40 | NA | TRICHOSTATIN A | 10737769 | ||
| 8553 | BHLHE40 | NA | RETINOIC ACID | 10737769 |
| Page: 1 |

Copyright 2023-Present -The University of Texas Health Science Center at Houston |