
|
|||||
|
 | |
| |
| |
| |
| |
| |
|
Gene: BGN |
Gene summary for BGN |
| Gene information | Species | Human | Gene symbol | BGN | Gene ID | 633 |
| Gene name | biglycan | |
| Gene Alias | DSPG1 | |
| Cytomap | Xq28 | |
| Gene Type | protein-coding | GO ID | GO:0001501 | UniProtAcc | B4DNL4 |
Top |
Malignant transformation analysis |
| Identification of the aberrant gene expression in precancerous and cancerous lesions by comparing the gene expression of stem-like cells in diseased tissues with normal stem cells |
| Entrez ID | Symbol | Replicates | Species | Organ | Tissue | Adj P-value | Log2FC | Malignancy |
| 633 | BGN | GSM4909281 | Human | Breast | IDC | 5.23e-31 | 6.04e-01 | 0.21 |
| 633 | BGN | GSM4909282 | Human | Breast | IDC | 1.31e-32 | 6.36e-01 | -0.0288 |
| 633 | BGN | GSM4909285 | Human | Breast | IDC | 7.70e-11 | 2.77e-01 | 0.21 |
| 633 | BGN | GSM4909287 | Human | Breast | IDC | 4.02e-38 | 8.36e-01 | 0.2057 |
| 633 | BGN | GSM4909291 | Human | Breast | IDC | 6.42e-04 | 1.57e-01 | 0.1753 |
| 633 | BGN | GSM4909295 | Human | Breast | IDC | 5.21e-11 | 3.40e-01 | 0.0898 |
| 633 | BGN | GSM4909302 | Human | Breast | IDC | 4.76e-08 | 2.34e-01 | 0.1545 |
| 633 | BGN | GSM4909317 | Human | Breast | IDC | 2.79e-03 | 1.23e-01 | 0.1355 |
| 633 | BGN | CA_HPV_3 | Human | Cervix | CC | 7.32e-19 | 3.92e-01 | 0.0414 |
| 633 | BGN | Tumor | Human | Cervix | CC | 1.21e-14 | 4.20e-01 | 0.1241 |
| 633 | BGN | sample3 | Human | Cervix | CC | 1.07e-22 | 5.48e-01 | 0.1387 |
| 633 | BGN | T3 | Human | Cervix | CC | 9.84e-28 | 5.29e-01 | 0.1389 |
| 633 | BGN | P1T-E | Human | Esophagus | ESCC | 1.30e-16 | 4.88e-01 | 0.0875 |
| 633 | BGN | P2T-E | Human | Esophagus | ESCC | 1.02e-68 | 1.87e+00 | 0.1177 |
| 633 | BGN | P4T-E | Human | Esophagus | ESCC | 4.47e-09 | 1.83e+00 | 0.1323 |
| 633 | BGN | P5T-E | Human | Esophagus | ESCC | 3.09e-03 | 1.84e+00 | 0.1327 |
| 633 | BGN | P9T-E | Human | Esophagus | ESCC | 1.11e-07 | 1.92e+00 | 0.1131 |
| 633 | BGN | P10T-E | Human | Esophagus | ESCC | 3.27e-125 | 3.58e+00 | 0.116 |
| 633 | BGN | P11T-E | Human | Esophagus | ESCC | 3.71e-15 | 1.63e+00 | 0.1426 |
| 633 | BGN | P16T-E | Human | Esophagus | ESCC | 3.50e-29 | 6.06e-01 | 0.1153 |
| Page: 1 2 3 4 |
| Tissue | Expression Dynamics | Abbreviation |
| Breast | 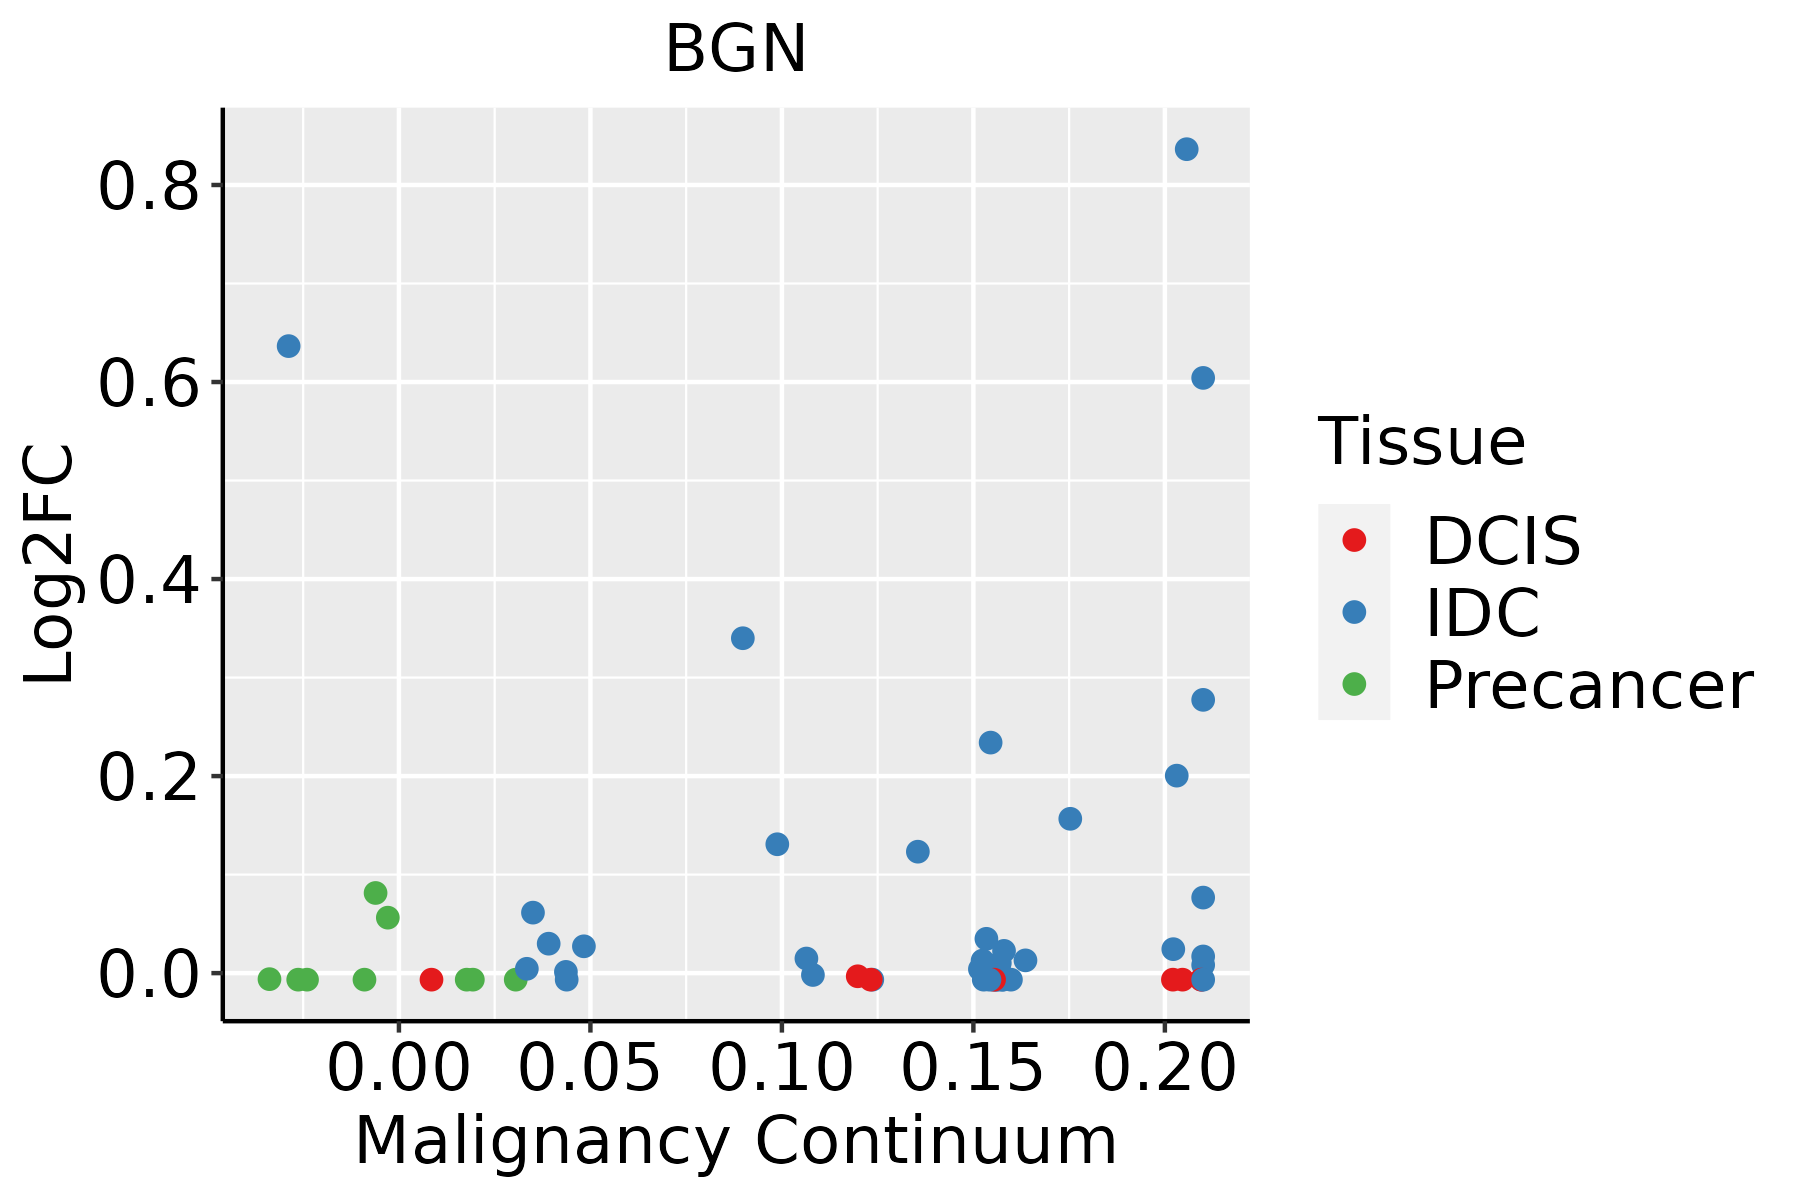 | IDC: Invasive ductal carcinoma |
| DCIS: Ductal carcinoma in situ | ||
| Precancer(BRCA1-mut): Precancerous lesion from BRCA1 mutation carriers | ||
| Cervix |  | CC: Cervix cancer |
| HSIL_HPV: HPV-infected high-grade squamous intraepithelial lesions | ||
| N_HPV: HPV-infected normal cervix | ||
| Esophagus | 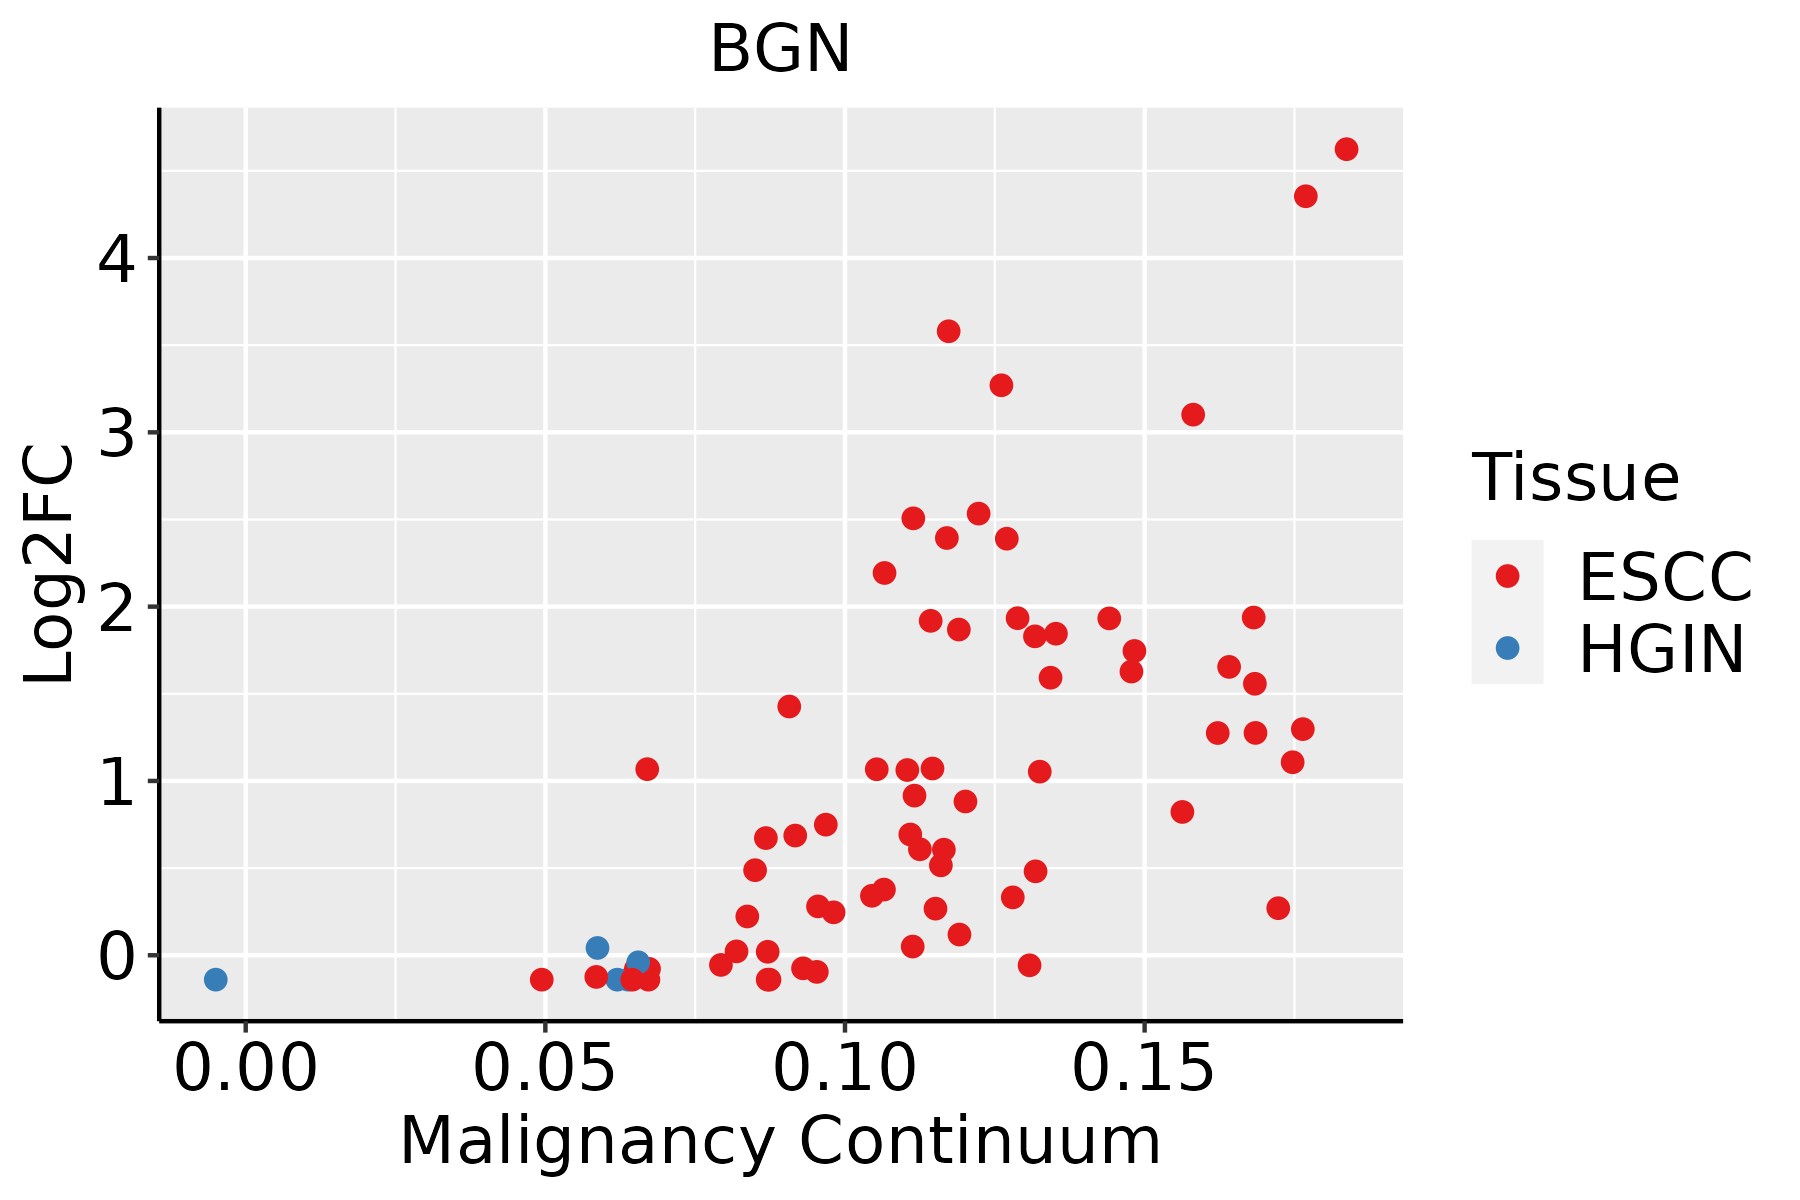 | ESCC: Esophageal squamous cell carcinoma |
| HGIN: High-grade intraepithelial neoplasias | ||
| LGIN: Low-grade intraepithelial neoplasias | ||
| Liver |  | HCC: Hepatocellular carcinoma |
| NAFLD: Non-alcoholic fatty liver disease | ||
| Oral Cavity | 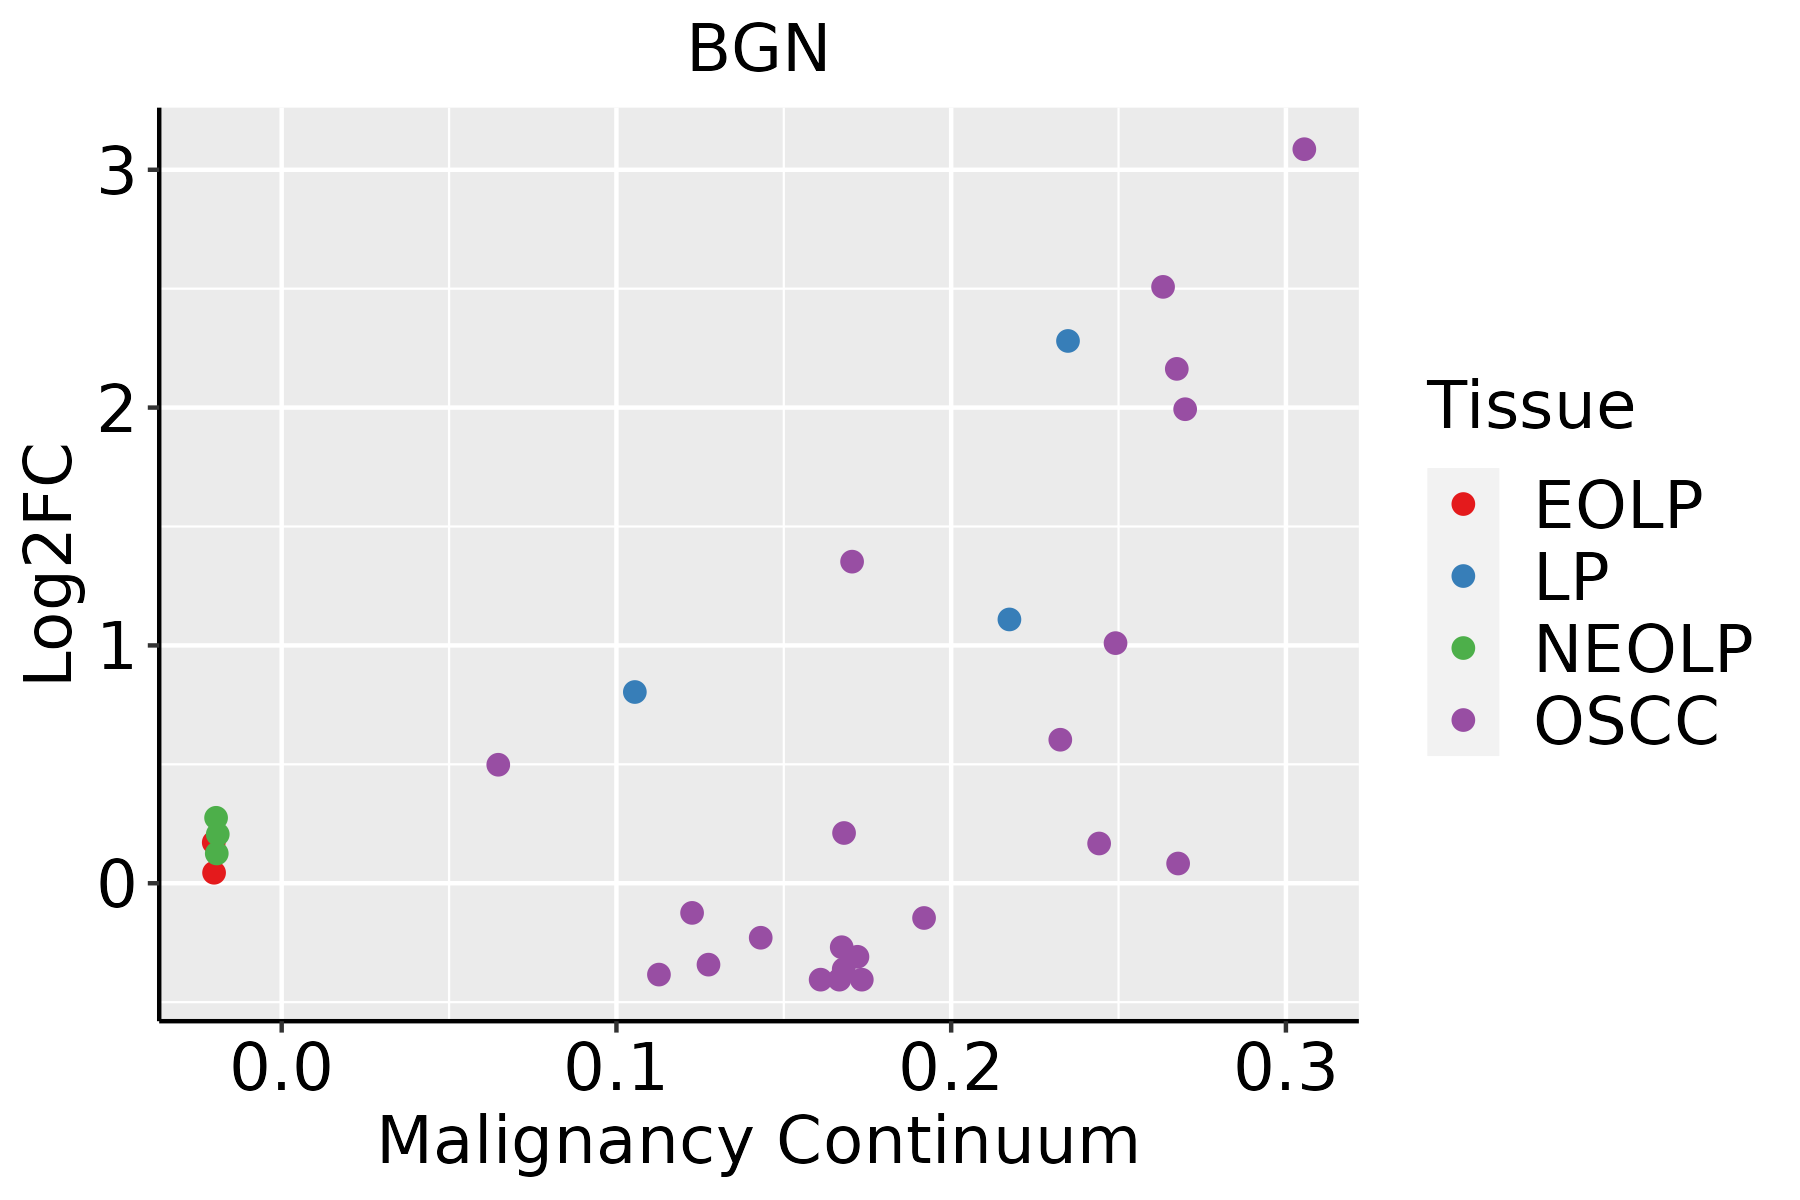 | EOLP: Erosive Oral lichen planus |
| LP: leukoplakia | ||
| NEOLP: Non-erosive oral lichen planus | ||
| OSCC: Oral squamous cell carcinoma | ||
| Skin | 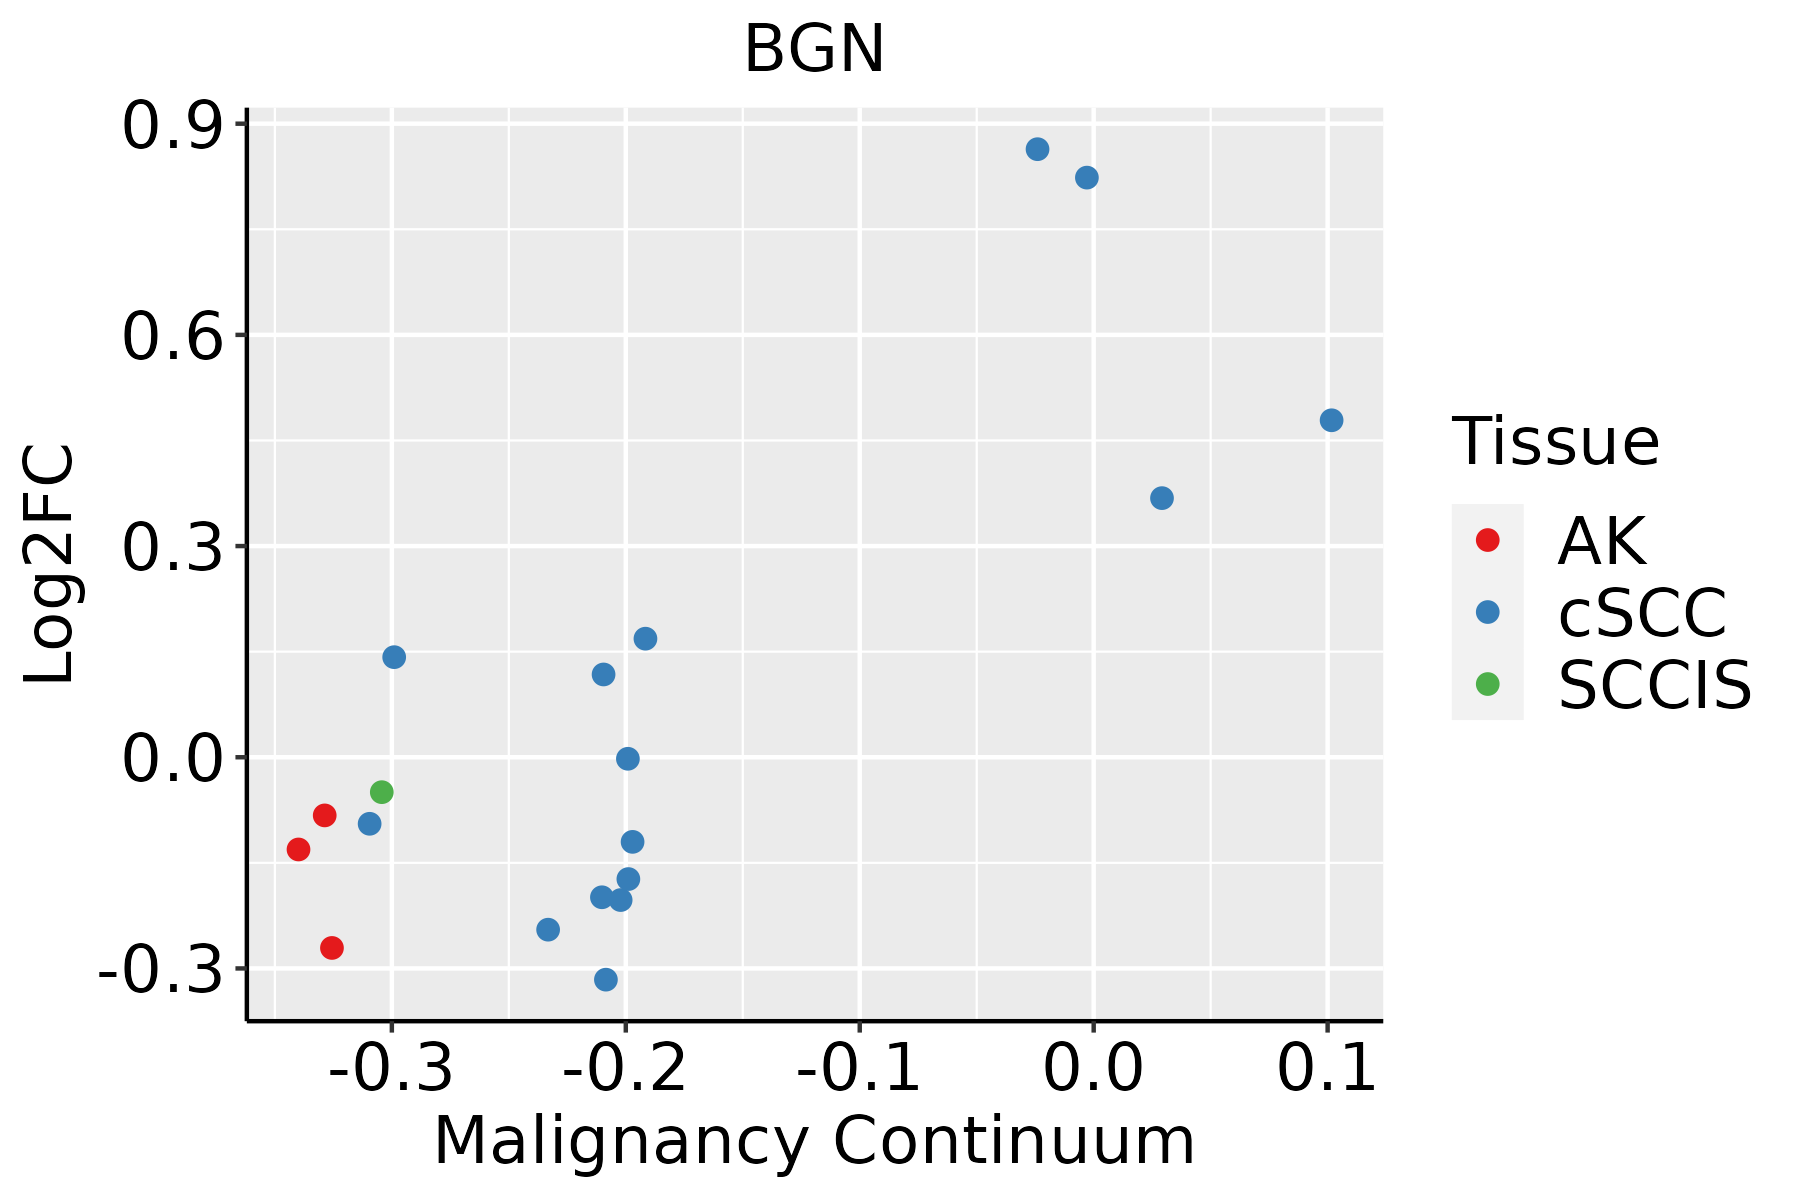 | AK: Actinic keratosis |
| cSCC: Cutaneous squamous cell carcinoma | ||
| SCCIS:squamous cell carcinoma in situ | ||
| Thyroid |  | ATC: Anaplastic thyroid cancer |
| HT: Hashimoto's thyroiditis | ||
| PTC: Papillary thyroid cancer |
| ∗log2FC in expression of this searched gene in stem-like cells from each diseased tissue sample relative to stem-like cells in normal samples in each tissue plotted against the malignancy continuum. Samples are colored based on if they are from different disease stage. |
Top |
Malignant transformation related pathway analysis |
| Find out the enriched GO biological processes and KEGG pathways involved in transition from healthy to precancer to cancer |
| Tissue | Disease Stage | Enriched GO biological Processes |
| Colorectum | AD |  |
| Colorectum | SER |  |
| Colorectum | MSS |  |
| Colorectum | MSI-H |  |
| Colorectum | FAP |  |
| ∗Top 15 enriched GO BP terms are showed in the bar plot of each disease state in each tissue. Each row represents a significant GO biological process which is colored according to the -log10(p.adjust). |
| Page: 1 2 3 4 5 6 7 8 9 |
| GO ID | Tissue | Disease Stage | Description | Gene Ratio | Bg Ratio | pvalue | p.adjust | Count |
| GO:0018149 | Breast | IDC | peptide cross-linking | 8/1434 | 35/18723 | 4.22e-03 | 3.31e-02 | 8 |
| GO:00182096 | Cervix | CC | peptidyl-serine modification | 66/2311 | 338/18723 | 9.58e-05 | 1.25e-03 | 66 |
| GO:00487712 | Cervix | CC | tissue remodeling | 34/2311 | 175/18723 | 4.68e-03 | 2.82e-02 | 34 |
| GO:00181493 | Cervix | CC | peptide cross-linking | 10/2311 | 35/18723 | 7.99e-03 | 4.18e-02 | 10 |
| GO:00091002 | Esophagus | ESCC | glycoprotein metabolic process | 226/8552 | 387/18723 | 2.64e-07 | 3.94e-06 | 226 |
| GO:00067906 | Esophagus | ESCC | sulfur compound metabolic process | 201/8552 | 339/18723 | 2.64e-07 | 3.94e-06 | 201 |
| GO:00182099 | Esophagus | ESCC | peptidyl-serine modification | 196/8552 | 338/18723 | 3.07e-06 | 3.47e-05 | 196 |
| GO:00603485 | Esophagus | ESCC | bone development | 115/8552 | 205/18723 | 1.67e-03 | 7.72e-03 | 115 |
| GO:0006029 | Esophagus | ESCC | proteoglycan metabolic process | 48/8552 | 79/18723 | 4.93e-03 | 1.89e-02 | 48 |
| GO:00512161 | Esophagus | ESCC | cartilage development | 103/8552 | 190/18723 | 1.08e-02 | 3.67e-02 | 103 |
| GO:000679011 | Liver | Cirrhotic | sulfur compound metabolic process | 129/4634 | 339/18723 | 3.06e-08 | 1.04e-06 | 129 |
| GO:00487711 | Liver | Cirrhotic | tissue remodeling | 60/4634 | 175/18723 | 2.86e-03 | 1.65e-02 | 60 |
| GO:000679021 | Liver | HCC | sulfur compound metabolic process | 212/7958 | 339/18723 | 5.60e-14 | 3.39e-12 | 212 |
| GO:001820911 | Liver | HCC | peptidyl-serine modification | 177/7958 | 338/18723 | 1.45e-04 | 1.17e-03 | 177 |
| GO:0009100 | Liver | HCC | glycoprotein metabolic process | 193/7958 | 387/18723 | 1.89e-03 | 9.62e-03 | 193 |
| GO:00182098 | Oral cavity | OSCC | peptidyl-serine modification | 175/7305 | 338/18723 | 1.09e-06 | 1.46e-05 | 175 |
| GO:00067905 | Oral cavity | OSCC | sulfur compound metabolic process | 168/7305 | 339/18723 | 4.50e-05 | 3.84e-04 | 168 |
| GO:00091001 | Oral cavity | OSCC | glycoprotein metabolic process | 185/7305 | 387/18723 | 2.37e-04 | 1.54e-03 | 185 |
| GO:00603484 | Oral cavity | OSCC | bone development | 99/7305 | 205/18723 | 4.13e-03 | 1.68e-02 | 99 |
| GO:0030204 | Oral cavity | OSCC | chondroitin sulfate metabolic process | 19/7305 | 30/18723 | 6.03e-03 | 2.28e-02 | 19 |
| Page: 1 2 |
| Pathway ID | Tissue | Disease Stage | Description | Gene Ratio | Bg Ratio | pvalue | p.adjust | qvalue | Count |
| Page: 1 |
Top |
Cell-cell communication analysis |
| Identification of potential cell-cell interactions between two cell types and their ligand-receptor pairs for different disease states |
| Ligand | Receptor | LRpair | Pathway | Tissue | Disease Stage |
| Page: 1 |
Top |
Single-cell gene regulatory network inference analysis |
| Find out the significant the regulons (TFs) and the target genes of each regulon across cell types for different disease states |
| TF | Cell Type | Tissue | Disease Stage | Target Gene | RSS | Regulon Activity |
| ∗The dot plots of a searched regulon are shown for all cell subpopulations in each disease state of each tissue based on the regulon specific score inferred using pySCENIC and by calculating the average expression. |
| Page: 1 |
Top |
Somatic mutation of malignant transformation related genes |
| Annotation of somatic variants for genes involved in malignant transformation |
| Hugo Symbol | Variant Class | Variant Classification | dbSNP RS | HGVSc | HGVSp | HGVSp Short | SWISSPROT | BIOTYPE | SIFT | PolyPhen | Tumor Sample Barcode | Tissue | Histology | Sex | Age | Stage | Therapy Types | Drugs | Outcome |
| BGN | SNV | Missense_Mutation | c.262A>T | p.Ile88Phe | p.I88F | P21810 | protein_coding | deleterious(0.04) | benign(0.097) | TCGA-AN-A04C-01 | Breast | breast invasive carcinoma | Female | <65 | I/II | Unknown | Unknown | SD | |
| BGN | SNV | Missense_Mutation | rs782454465 | c.509N>A | p.Arg170His | p.R170H | P21810 | protein_coding | tolerated(0.08) | benign(0.315) | TCGA-B6-A0WW-01 | Breast | breast invasive carcinoma | Female | <65 | I/II | Unknown | Unknown | PD |
| BGN | SNV | Missense_Mutation | c.926N>T | p.Ser309Phe | p.S309F | P21810 | protein_coding | deleterious(0.02) | benign(0.178) | TCGA-E2-A56Z-01 | Breast | breast invasive carcinoma | Female | >=65 | I/II | Hormone Therapy | arimidex | SD | |
| BGN | deletion | Frame_Shift_Del | c.49delC | p.Leu17CysfsTer19 | p.L17Cfs*19 | P21810 | protein_coding | TCGA-EW-A2FV-01 | Breast | breast invasive carcinoma | Female | <65 | III/IV | Chemotherapy | docetaxel | SD | |||
| BGN | SNV | Missense_Mutation | c.494N>A | p.Arg165His | p.R165H | P21810 | protein_coding | tolerated(0.06) | probably_damaging(1) | TCGA-C5-A1MI-01 | Cervix | cervical & endocervical cancer | Female | <65 | I/II | Chemotherapy | cisplatin | PD | |
| BGN | SNV | Missense_Mutation | c.955N>A | p.Asp319Asn | p.D319N | P21810 | protein_coding | deleterious(0) | probably_damaging(1) | TCGA-C5-A7X5-01 | Cervix | cervical & endocervical cancer | Female | >=65 | I/II | Chemotherapy | carboplatin | PD | |
| BGN | SNV | Missense_Mutation | novel | c.388N>T | p.His130Tyr | p.H130Y | P21810 | protein_coding | deleterious(0.02) | possibly_damaging(0.713) | TCGA-EA-A3HS-01 | Cervix | cervical & endocervical cancer | Female | <65 | I/II | Unknown | Unknown | SD |
| BGN | SNV | Missense_Mutation | novel | c.334G>T | p.Gly112Cys | p.G112C | P21810 | protein_coding | deleterious(0) | probably_damaging(0.999) | TCGA-EK-A3GK-01 | Cervix | cervical & endocervical cancer | Female | <65 | I/II | Unknown | Unknown | SD |
| BGN | SNV | Missense_Mutation | c.770N>T | p.Arg257Met | p.R257M | P21810 | protein_coding | deleterious(0) | probably_damaging(1) | TCGA-AA-3492-01 | Colorectum | colon adenocarcinoma | Female | >=65 | I/II | Unknown | Unknown | SD | |
| BGN | SNV | Missense_Mutation | c.305T>C | p.Ile102Thr | p.I102T | P21810 | protein_coding | deleterious(0) | probably_damaging(1) | TCGA-AD-A5EJ-01 | Colorectum | colon adenocarcinoma | Female | >=65 | I/II | Unknown | Unknown | SD |
| Page: 1 2 3 4 5 6 |
Top |
Related drugs of malignant transformation related genes |
| Identification of chemicals and drugs interact with genes involved in malignant transfromation |
| (DGIdb 4.0) |
| Entrez ID | Symbol | Category | Interaction Types | Drug Claim Name | Drug Name | PMIDs |
| Page: 1 |

Copyright 2023-Present -The University of Texas Health Science Center at Houston |