
|
|||||
|
 | |
| |
| |
| |
| |
| |
|
Gene: BFAR |
Gene summary for BFAR |
| Gene information | Species | Human | Gene symbol | BFAR | Gene ID | 51283 |
| Gene name | bifunctional apoptosis regulator | |
| Gene Alias | BAR | |
| Cytomap | 16p13.12 | |
| Gene Type | protein-coding | GO ID | GO:0000209 | UniProtAcc | H3BMP2 |
Top |
Malignant transformation analysis |
| Identification of the aberrant gene expression in precancerous and cancerous lesions by comparing the gene expression of stem-like cells in diseased tissues with normal stem cells |
| Entrez ID | Symbol | Replicates | Species | Organ | Tissue | Adj P-value | Log2FC | Malignancy |
| 51283 | BFAR | LZE4T | Human | Esophagus | ESCC | 2.07e-15 | 4.74e-01 | 0.0811 |
| 51283 | BFAR | LZE5T | Human | Esophagus | ESCC | 1.11e-02 | 1.47e-03 | 0.0514 |
| 51283 | BFAR | LZE8T | Human | Esophagus | ESCC | 2.51e-09 | 2.59e-01 | 0.067 |
| 51283 | BFAR | LZE20T | Human | Esophagus | ESCC | 5.38e-07 | 6.06e-02 | 0.0662 |
| 51283 | BFAR | LZE24T | Human | Esophagus | ESCC | 3.54e-11 | 3.29e-01 | 0.0596 |
| 51283 | BFAR | P1T-E | Human | Esophagus | ESCC | 2.06e-05 | 4.49e-01 | 0.0875 |
| 51283 | BFAR | P2T-E | Human | Esophagus | ESCC | 4.02e-50 | 1.16e+00 | 0.1177 |
| 51283 | BFAR | P4T-E | Human | Esophagus | ESCC | 6.80e-19 | 5.25e-01 | 0.1323 |
| 51283 | BFAR | P5T-E | Human | Esophagus | ESCC | 8.80e-21 | 3.46e-01 | 0.1327 |
| 51283 | BFAR | P8T-E | Human | Esophagus | ESCC | 1.84e-31 | 6.88e-01 | 0.0889 |
| 51283 | BFAR | P9T-E | Human | Esophagus | ESCC | 4.53e-18 | 2.95e-01 | 0.1131 |
| 51283 | BFAR | P10T-E | Human | Esophagus | ESCC | 1.50e-12 | 3.34e-01 | 0.116 |
| 51283 | BFAR | P11T-E | Human | Esophagus | ESCC | 3.81e-16 | 9.02e-01 | 0.1426 |
| 51283 | BFAR | P12T-E | Human | Esophagus | ESCC | 5.61e-39 | 9.61e-01 | 0.1122 |
| 51283 | BFAR | P15T-E | Human | Esophagus | ESCC | 4.38e-35 | 1.04e+00 | 0.1149 |
| 51283 | BFAR | P16T-E | Human | Esophagus | ESCC | 3.81e-46 | 1.04e+00 | 0.1153 |
| 51283 | BFAR | P17T-E | Human | Esophagus | ESCC | 3.68e-03 | 5.27e-01 | 0.1278 |
| 51283 | BFAR | P19T-E | Human | Esophagus | ESCC | 1.36e-07 | 7.59e-01 | 0.1662 |
| 51283 | BFAR | P20T-E | Human | Esophagus | ESCC | 1.07e-45 | 1.10e+00 | 0.1124 |
| 51283 | BFAR | P21T-E | Human | Esophagus | ESCC | 1.29e-31 | 7.53e-01 | 0.1617 |
| Page: 1 2 3 4 5 6 |
| Tissue | Expression Dynamics | Abbreviation |
| Esophagus | 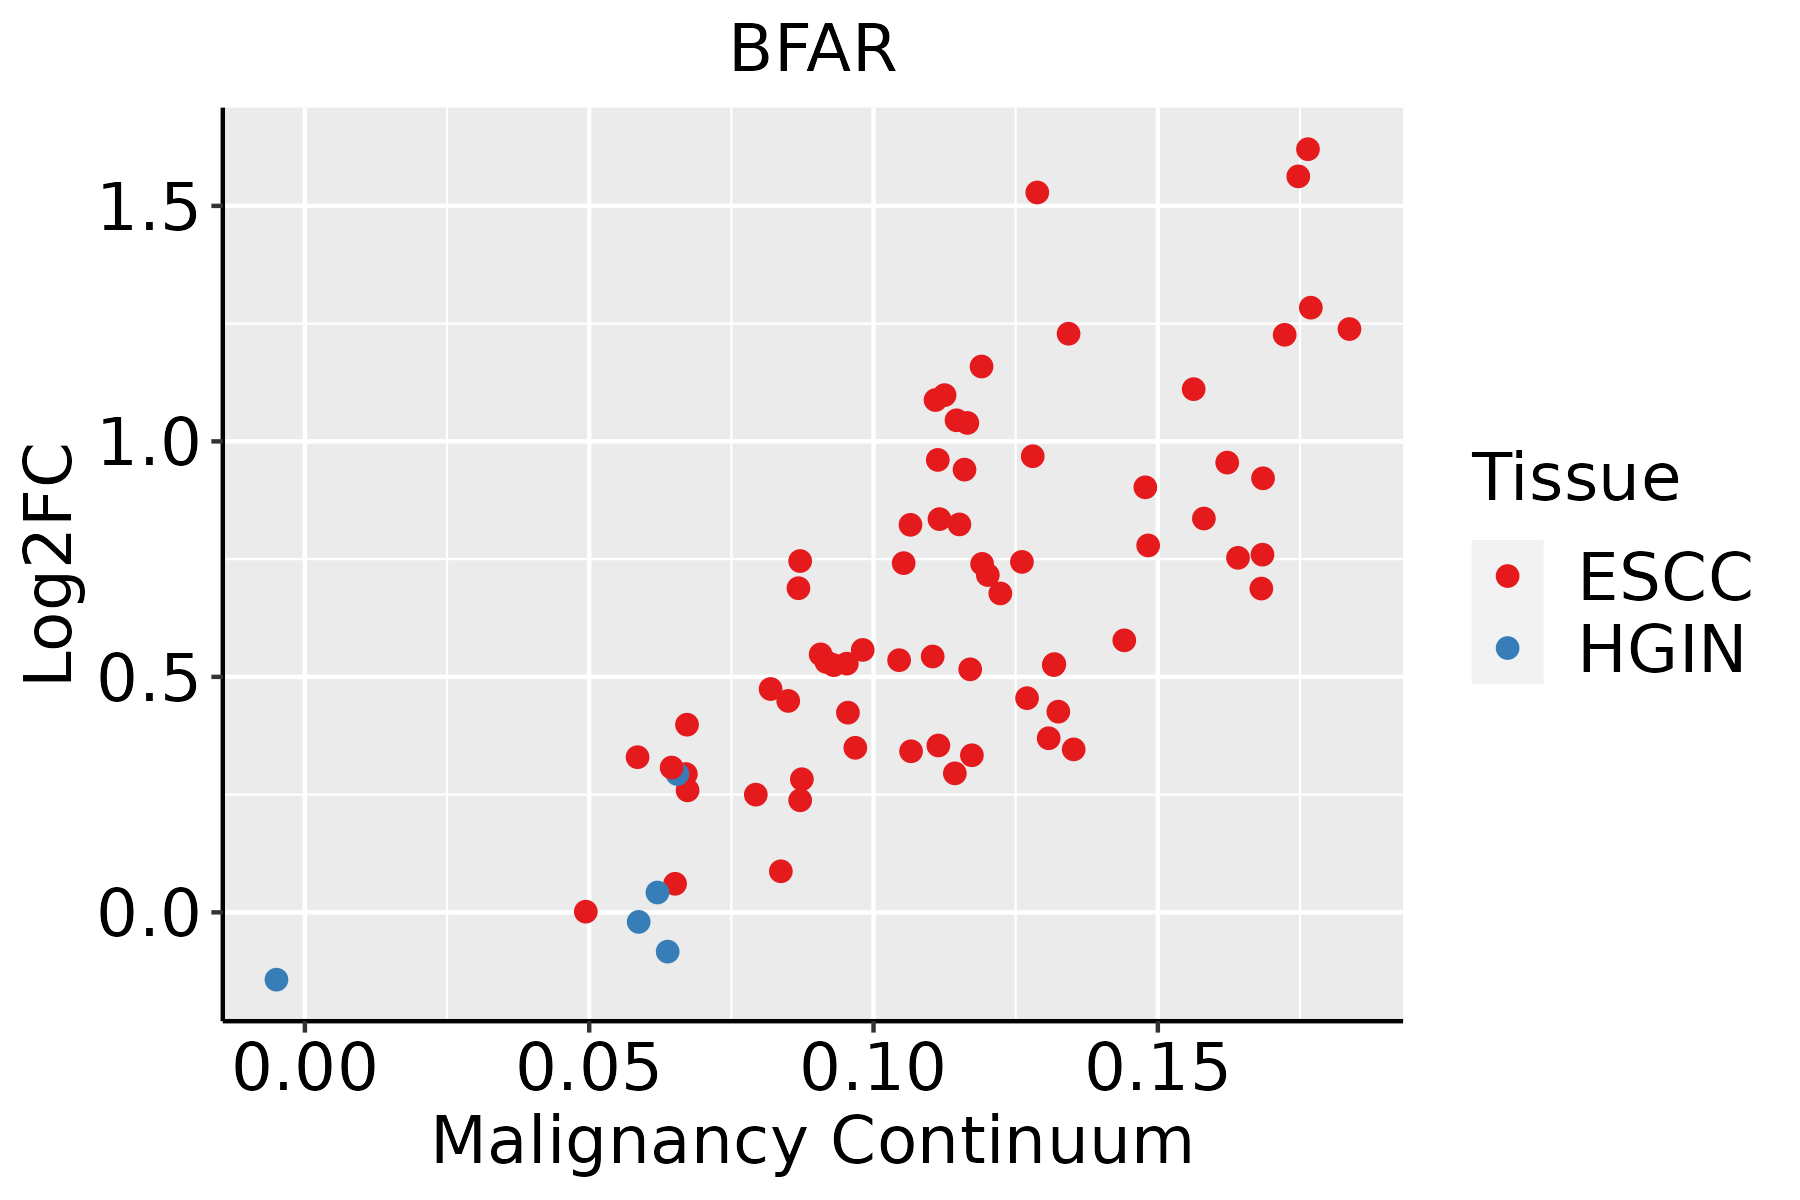 | ESCC: Esophageal squamous cell carcinoma |
| HGIN: High-grade intraepithelial neoplasias | ||
| LGIN: Low-grade intraepithelial neoplasias | ||
| Liver | 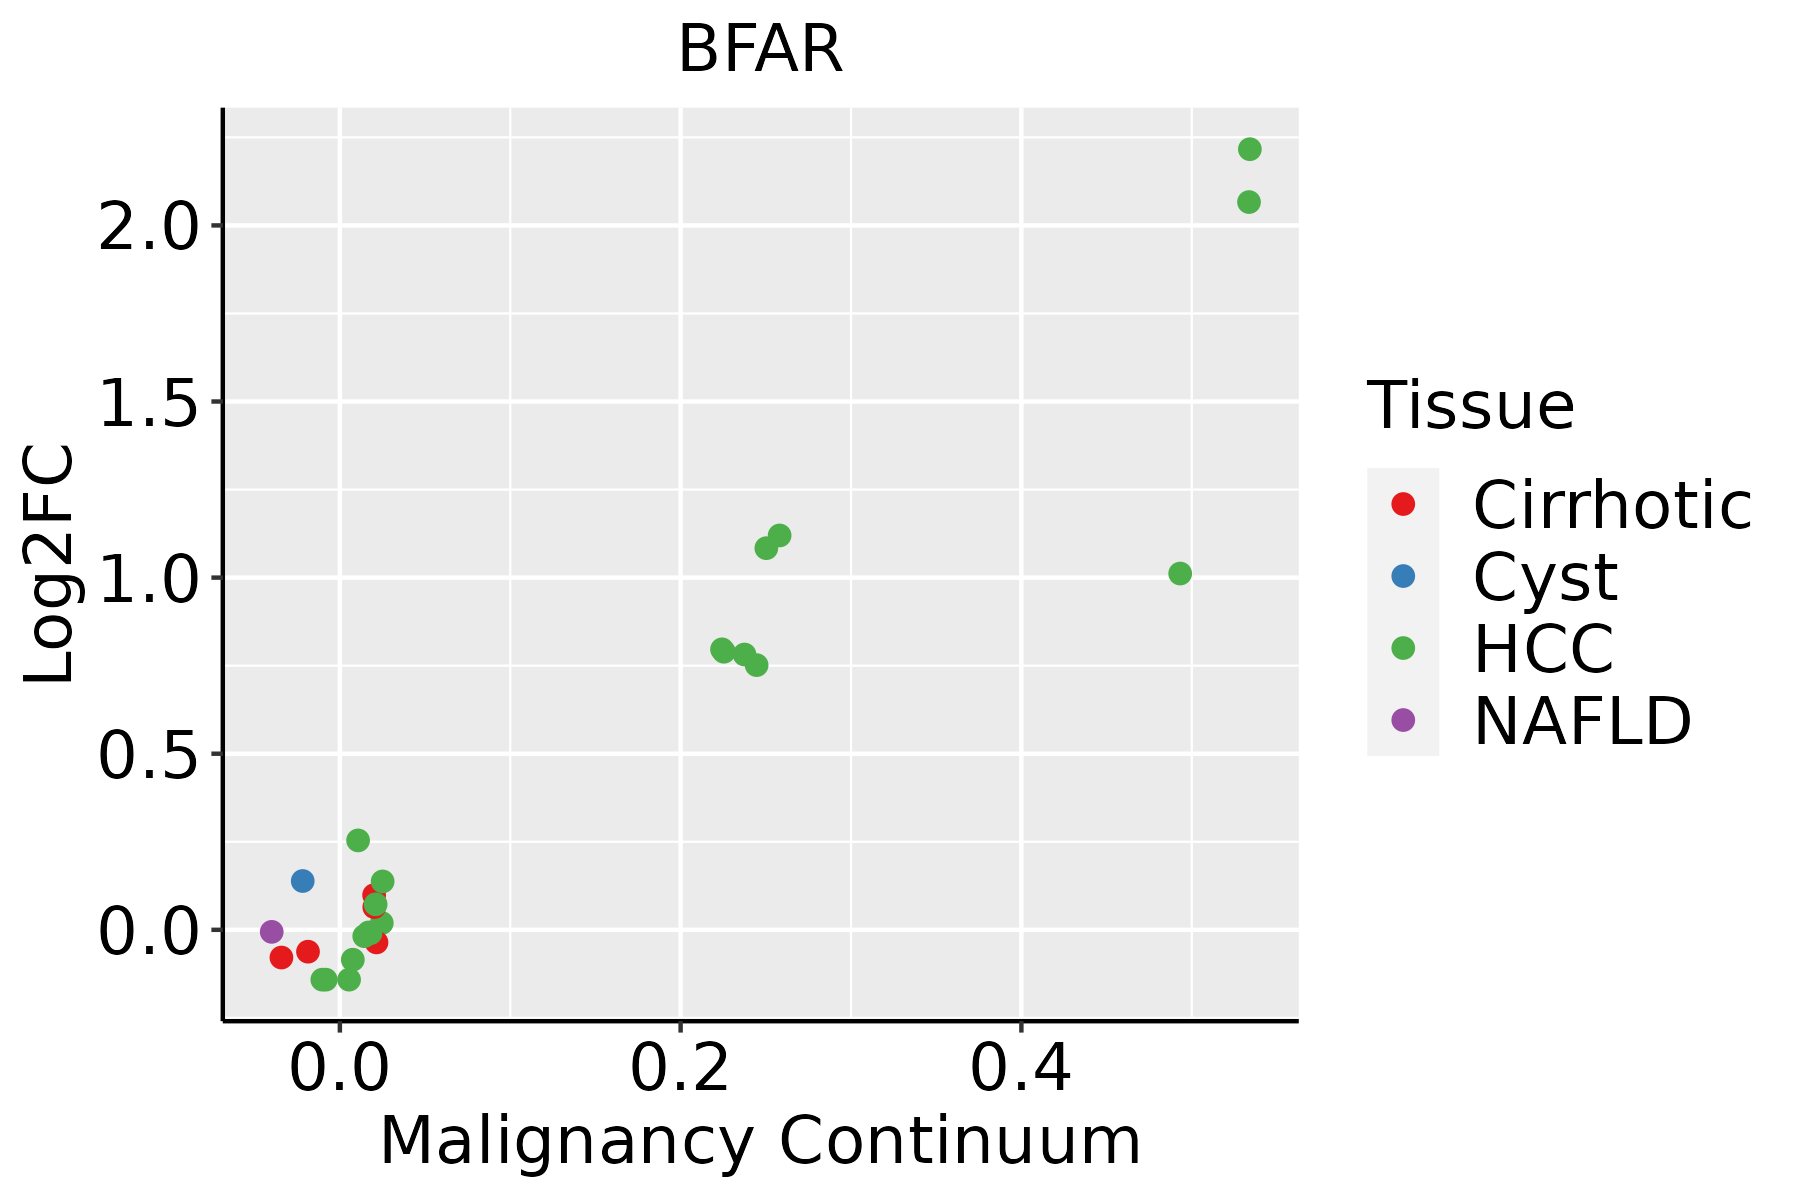 | HCC: Hepatocellular carcinoma |
| NAFLD: Non-alcoholic fatty liver disease | ||
| Oral Cavity | 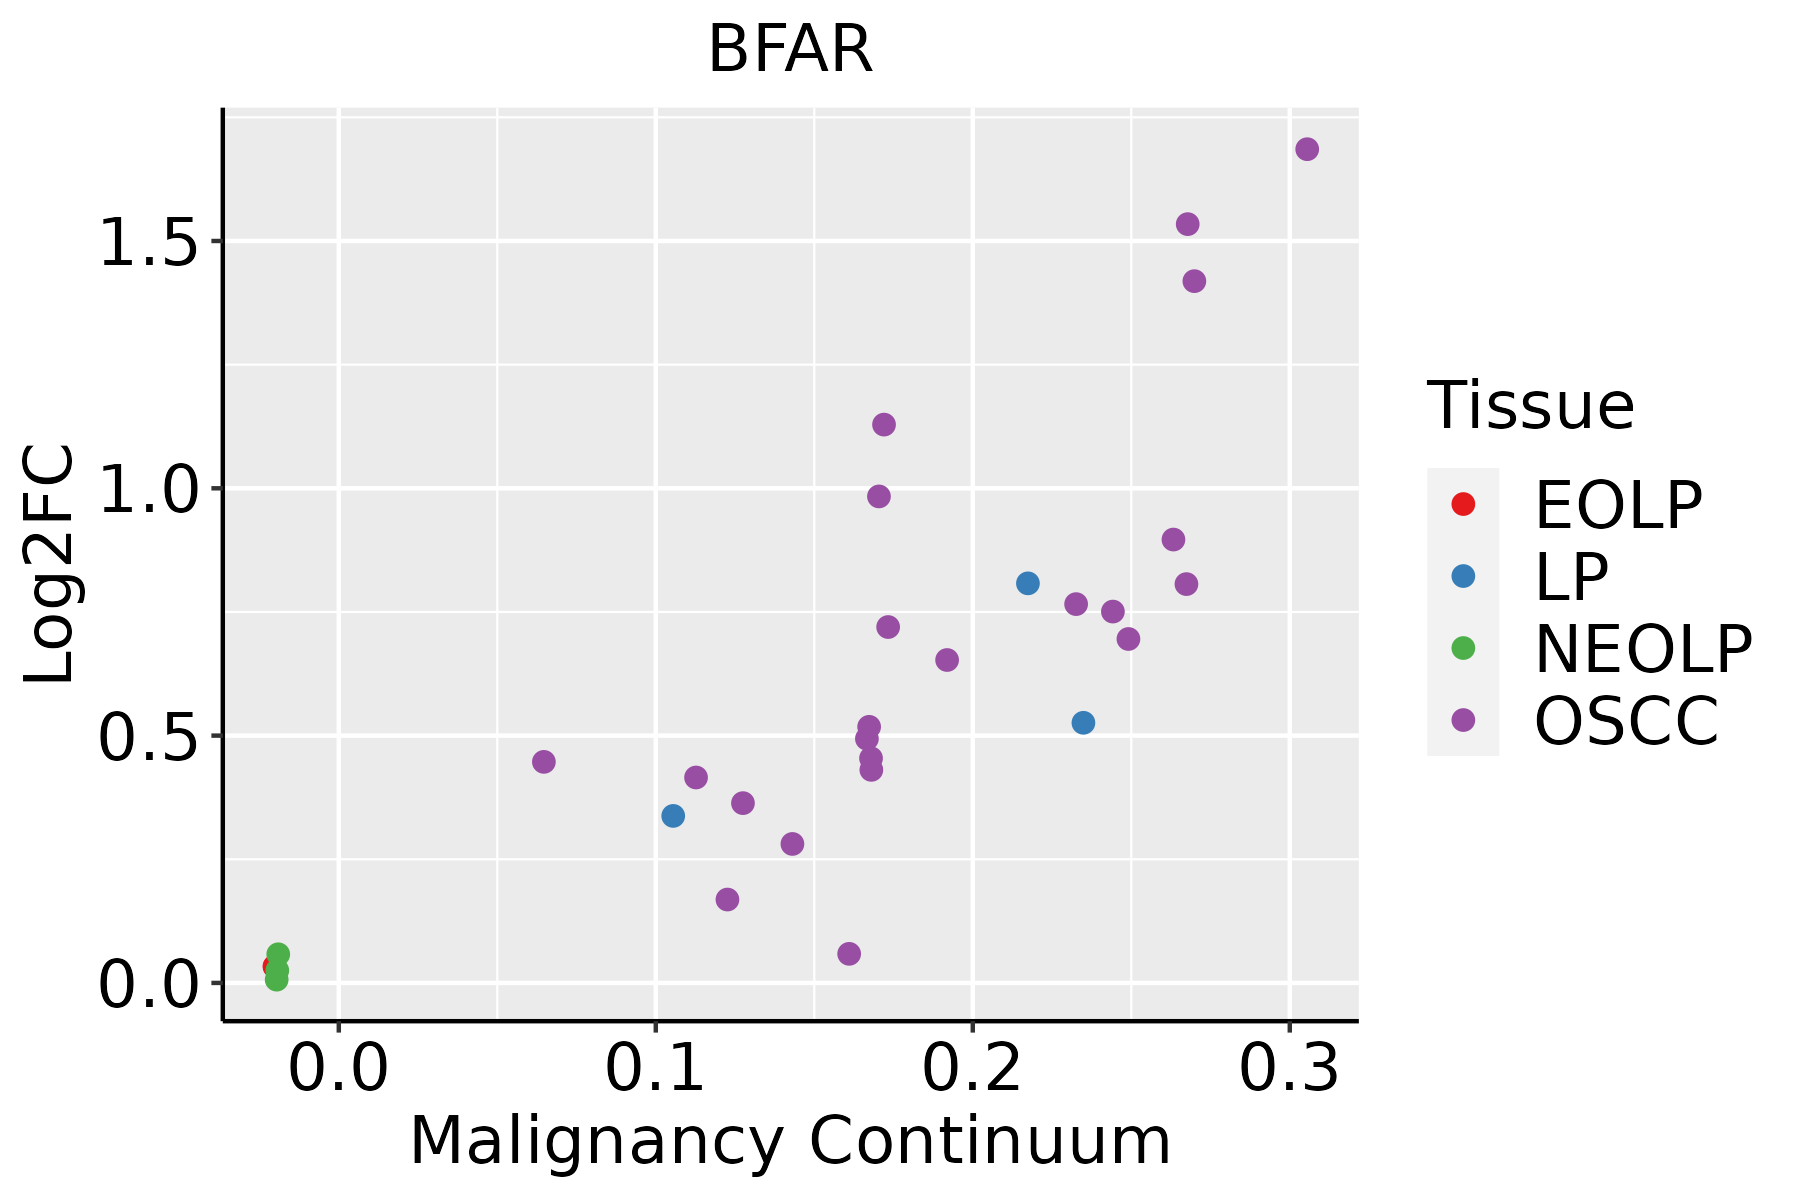 | EOLP: Erosive Oral lichen planus |
| LP: leukoplakia | ||
| NEOLP: Non-erosive oral lichen planus | ||
| OSCC: Oral squamous cell carcinoma | ||
| Skin | 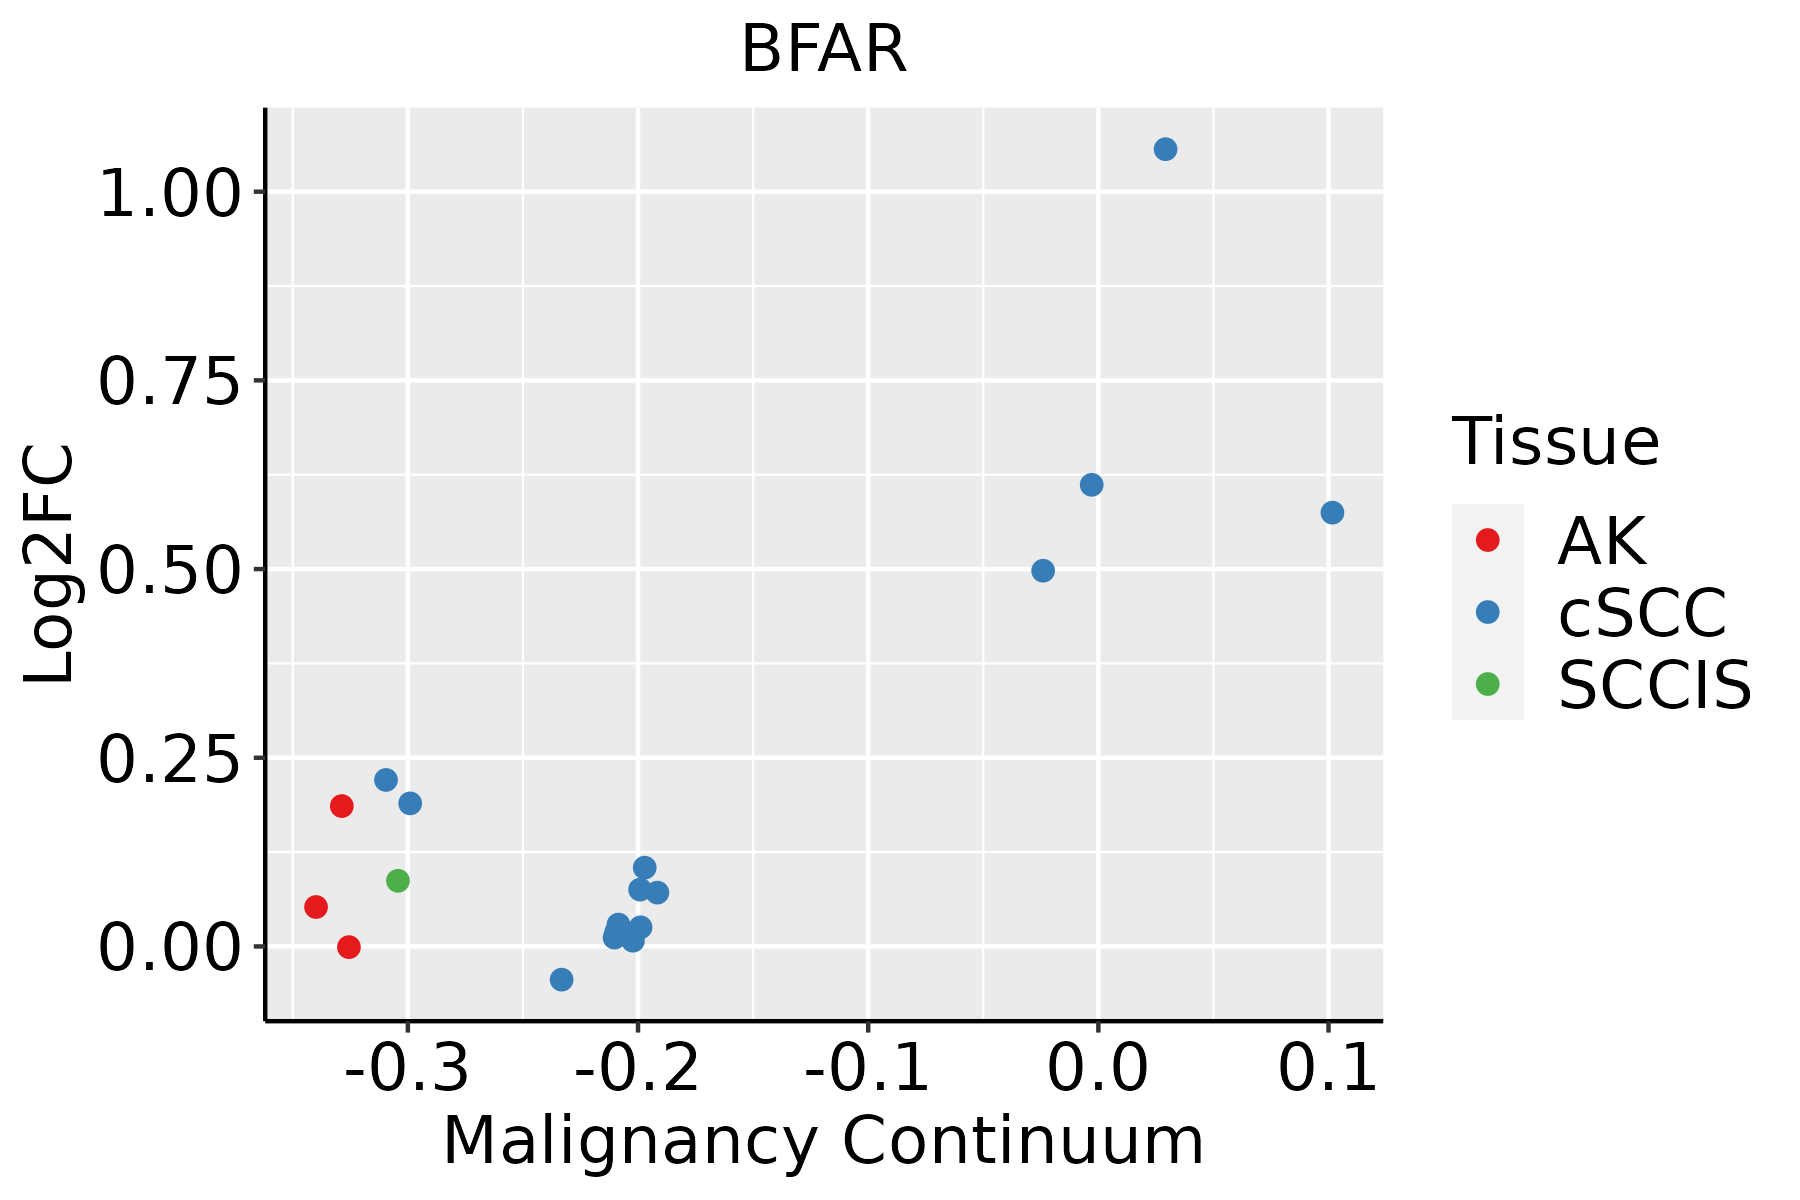 | AK: Actinic keratosis |
| cSCC: Cutaneous squamous cell carcinoma | ||
| SCCIS:squamous cell carcinoma in situ | ||
| Thyroid | 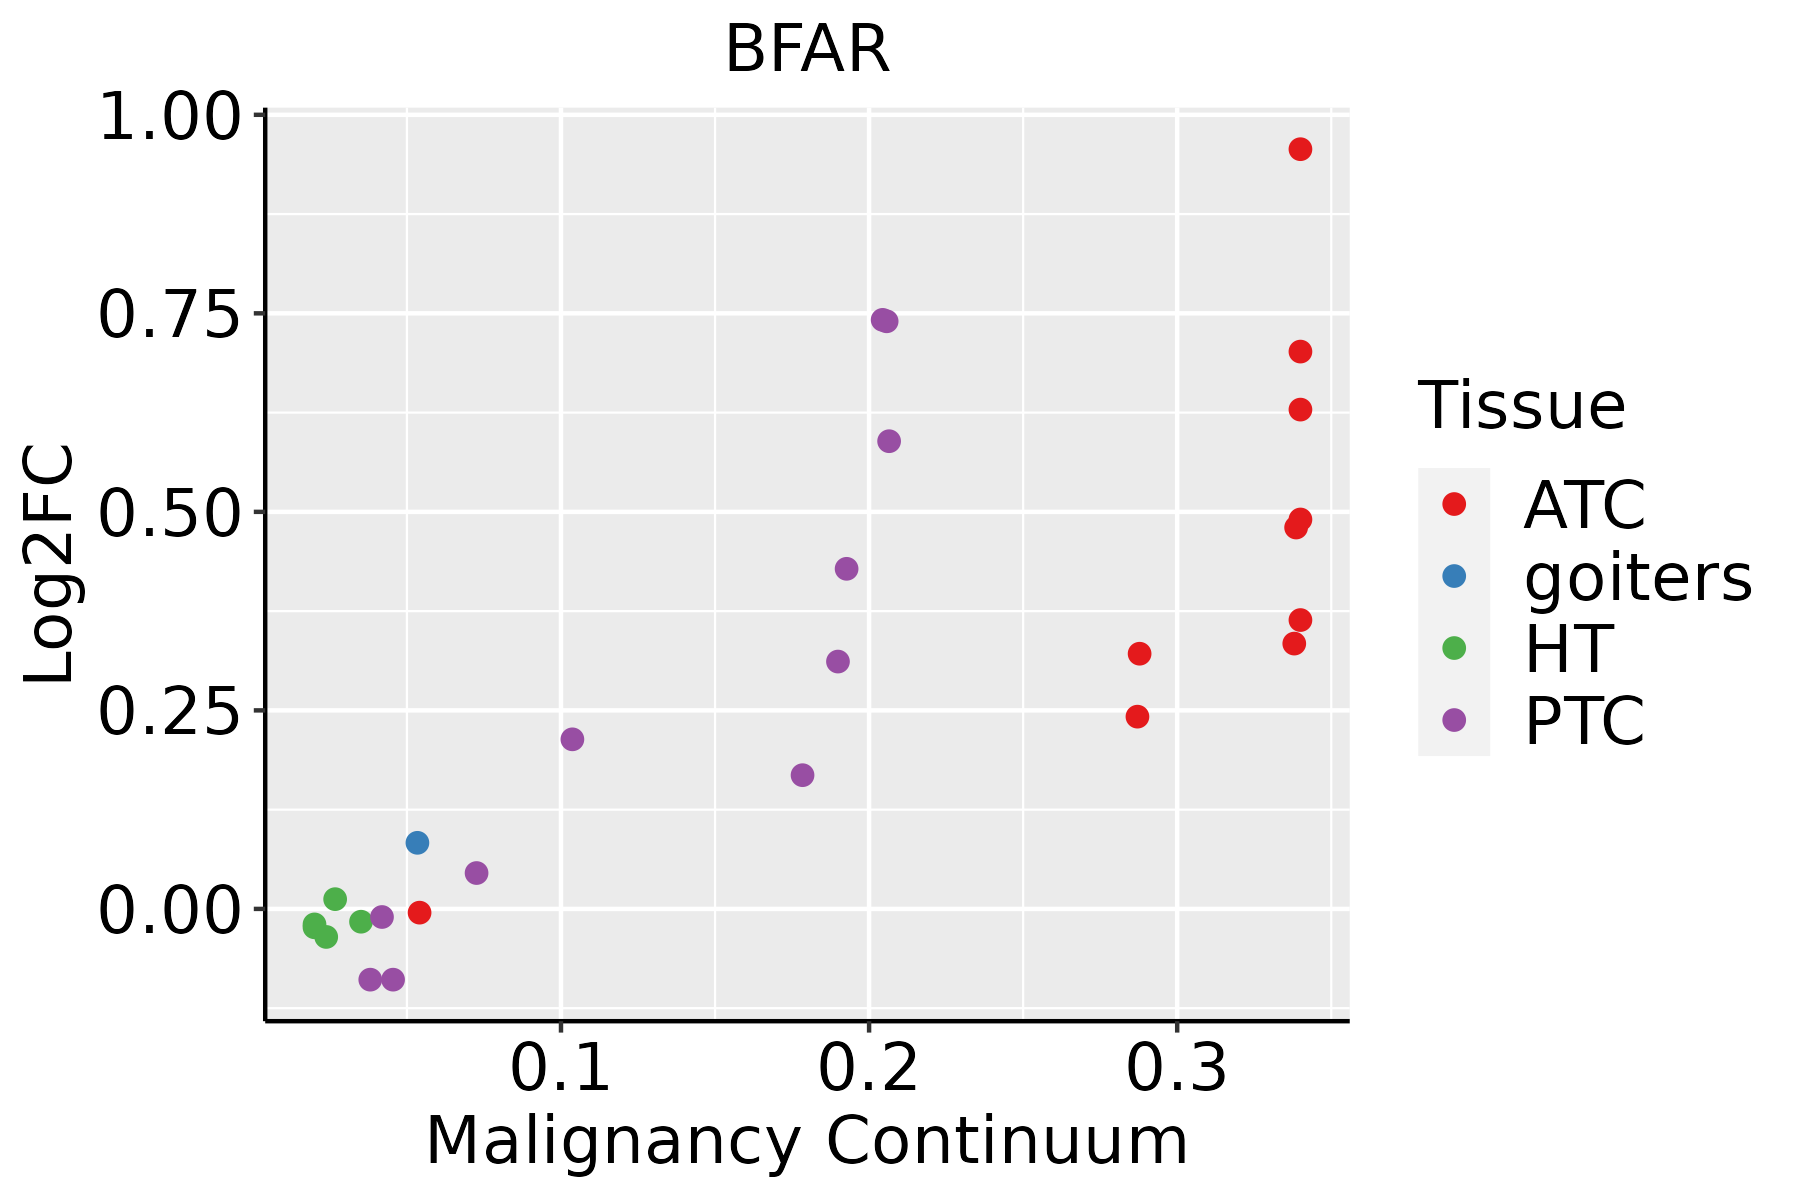 | ATC: Anaplastic thyroid cancer |
| HT: Hashimoto's thyroiditis | ||
| PTC: Papillary thyroid cancer |
| ∗log2FC in expression of this searched gene in stem-like cells from each diseased tissue sample relative to stem-like cells in normal samples in each tissue plotted against the malignancy continuum. Samples are colored based on if they are from different disease stage. |
Top |
Malignant transformation related pathway analysis |
| Find out the enriched GO biological processes and KEGG pathways involved in transition from healthy to precancer to cancer |
| Tissue | Disease Stage | Enriched GO biological Processes |
| Colorectum | AD |  |
| Colorectum | SER |  |
| Colorectum | MSS |  |
| Colorectum | MSI-H |  |
| Colorectum | FAP |  |
| ∗Top 15 enriched GO BP terms are showed in the bar plot of each disease state in each tissue. Each row represents a significant GO biological process which is colored according to the -log10(p.adjust). |
| Page: 1 2 3 4 5 6 7 8 9 |
| GO ID | Tissue | Disease Stage | Description | Gene Ratio | Bg Ratio | pvalue | p.adjust | Count |
| GO:0010498111 | Esophagus | ESCC | proteasomal protein catabolic process | 369/8552 | 490/18723 | 1.13e-41 | 1.80e-38 | 369 |
| GO:0043161111 | Esophagus | ESCC | proteasome-mediated ubiquitin-dependent protein catabolic process | 312/8552 | 412/18723 | 3.53e-36 | 4.48e-33 | 312 |
| GO:0034976111 | Esophagus | ESCC | response to endoplasmic reticulum stress | 192/8552 | 256/18723 | 7.15e-22 | 1.30e-19 | 192 |
| GO:0035966111 | Esophagus | ESCC | response to topologically incorrect protein | 125/8552 | 159/18723 | 1.44e-17 | 1.27e-15 | 125 |
| GO:000020917 | Esophagus | ESCC | protein polyubiquitination | 170/8552 | 236/18723 | 1.40e-16 | 1.09e-14 | 170 |
| GO:0006986111 | Esophagus | ESCC | response to unfolded protein | 107/8552 | 137/18723 | 7.01e-15 | 3.87e-13 | 107 |
| GO:0035967111 | Esophagus | ESCC | cellular response to topologically incorrect protein | 90/8552 | 116/18723 | 1.94e-12 | 8.11e-11 | 90 |
| GO:007093617 | Esophagus | ESCC | protein K48-linked ubiquitination | 55/8552 | 65/18723 | 8.42e-11 | 2.58e-09 | 55 |
| GO:0034620111 | Esophagus | ESCC | cellular response to unfolded protein | 74/8552 | 96/18723 | 3.10e-10 | 8.66e-09 | 74 |
| GO:003096818 | Esophagus | ESCC | endoplasmic reticulum unfolded protein response | 59/8552 | 74/18723 | 1.90e-09 | 4.36e-08 | 59 |
| GO:1905897111 | Esophagus | ESCC | regulation of response to endoplasmic reticulum stress | 63/8552 | 82/18723 | 8.16e-09 | 1.66e-07 | 63 |
| GO:007053413 | Esophagus | ESCC | protein K63-linked ubiquitination | 44/8552 | 56/18723 | 4.84e-07 | 6.50e-06 | 44 |
| GO:1903573111 | Esophagus | ESCC | negative regulation of response to endoplasmic reticulum stress | 34/8552 | 44/18723 | 1.90e-05 | 1.67e-04 | 34 |
| GO:190010110 | Esophagus | ESCC | regulation of endoplasmic reticulum unfolded protein response | 24/8552 | 30/18723 | 1.27e-04 | 8.67e-04 | 24 |
| GO:00364986 | Esophagus | ESCC | IRE1-mediated unfolded protein response | 16/8552 | 19/18723 | 6.45e-04 | 3.43e-03 | 16 |
| GO:00518658 | Esophagus | ESCC | protein autoubiquitination | 47/8552 | 73/18723 | 9.72e-04 | 4.93e-03 | 47 |
| GO:19038943 | Esophagus | ESCC | regulation of IRE1-mediated unfolded protein response | 12/8552 | 14/18723 | 2.51e-03 | 1.08e-02 | 12 |
| GO:001049812 | Liver | Cirrhotic | proteasomal protein catabolic process | 216/4634 | 490/18723 | 2.52e-21 | 9.29e-19 | 216 |
| GO:00349767 | Liver | Cirrhotic | response to endoplasmic reticulum stress | 130/4634 | 256/18723 | 1.72e-19 | 3.86e-17 | 130 |
| GO:004316112 | Liver | Cirrhotic | proteasome-mediated ubiquitin-dependent protein catabolic process | 184/4634 | 412/18723 | 4.52e-19 | 8.85e-17 | 184 |
| Page: 1 2 3 4 5 6 7 |
| Pathway ID | Tissue | Disease Stage | Description | Gene Ratio | Bg Ratio | pvalue | p.adjust | qvalue | Count |
| Page: 1 |
Top |
Cell-cell communication analysis |
| Identification of potential cell-cell interactions between two cell types and their ligand-receptor pairs for different disease states |
| Ligand | Receptor | LRpair | Pathway | Tissue | Disease Stage |
| Page: 1 |
Top |
Single-cell gene regulatory network inference analysis |
| Find out the significant the regulons (TFs) and the target genes of each regulon across cell types for different disease states |
| TF | Cell Type | Tissue | Disease Stage | Target Gene | RSS | Regulon Activity |
| ∗The dot plots of a searched regulon are shown for all cell subpopulations in each disease state of each tissue based on the regulon specific score inferred using pySCENIC and by calculating the average expression. |
| Page: 1 |
Top |
Somatic mutation of malignant transformation related genes |
| Annotation of somatic variants for genes involved in malignant transformation |
| Hugo Symbol | Variant Class | Variant Classification | dbSNP RS | HGVSc | HGVSp | HGVSp Short | SWISSPROT | BIOTYPE | SIFT | PolyPhen | Tumor Sample Barcode | Tissue | Histology | Sex | Age | Stage | Therapy Types | Drugs | Outcome |
| BFAR | SNV | Missense_Mutation | c.643N>G | p.Leu215Val | p.L215V | Q9NZS9 | protein_coding | deleterious(0) | probably_damaging(0.998) | TCGA-D8-A1JP-01 | Breast | breast invasive carcinoma | Female | >=65 | I/II | Hormone Therapy | tamoxiphen | SD | |
| BFAR | insertion | In_Frame_Ins | novel | c.1254_1255insACAAGGACA | p.Val418_Cys419insThrArgThr | p.V418_C419insTRT | Q9NZS9 | protein_coding | TCGA-A2-A0D1-01 | Breast | breast invasive carcinoma | Female | >=65 | I/II | Chemotherapy | taxotere | SD | ||
| BFAR | insertion | In_Frame_Ins | novel | c.1255_1256insTCAGCACGG | p.Cys419delinsPheSerThrGly | p.C419delinsFSTG | Q9NZS9 | protein_coding | TCGA-A2-A0D1-01 | Breast | breast invasive carcinoma | Female | >=65 | I/II | Chemotherapy | taxotere | SD | ||
| BFAR | insertion | Frame_Shift_Ins | rs781267226 | c.763dupC | p.Gln255ProfsTer7 | p.Q255Pfs*7 | Q9NZS9 | protein_coding | TCGA-B6-A0IA-01 | Breast | breast invasive carcinoma | Female | <65 | I/II | Unknown | Unknown | SD | ||
| BFAR | SNV | Missense_Mutation | novel | c.407C>T | p.Ala136Val | p.A136V | Q9NZS9 | protein_coding | tolerated(0.29) | benign(0) | TCGA-2W-A8YY-01 | Cervix | cervical & endocervical cancer | Female | <65 | I/II | Chemotherapy | cisplatin | CR |
| BFAR | SNV | Missense_Mutation | rs746810685 | c.1182N>C | p.Trp394Cys | p.W394C | Q9NZS9 | protein_coding | deleterious(0.01) | probably_damaging(0.997) | TCGA-JW-A5VL-01 | Cervix | cervical & endocervical cancer | Female | <65 | I/II | Unknown | Unknown | SD |
| BFAR | SNV | Missense_Mutation | c.1040N>A | p.Phe347Tyr | p.F347Y | Q9NZS9 | protein_coding | tolerated(0.14) | probably_damaging(0.989) | TCGA-AA-3672-01 | Colorectum | colon adenocarcinoma | Female | >=65 | III/IV | Unknown | Unknown | SD | |
| BFAR | SNV | Missense_Mutation | c.547N>G | p.Thr183Ala | p.T183A | Q9NZS9 | protein_coding | tolerated(0.09) | benign(0.018) | TCGA-AU-6004-01 | Colorectum | colon adenocarcinoma | Female | >=65 | I/II | Unknown | Unknown | SD | |
| BFAR | SNV | Missense_Mutation | c.656N>A | p.Thr219Lys | p.T219K | Q9NZS9 | protein_coding | tolerated(0.25) | possibly_damaging(0.602) | TCGA-CA-6715-01 | Colorectum | colon adenocarcinoma | Male | <65 | III/IV | Chemotherapy | oxaliplatin | CR | |
| BFAR | SNV | Missense_Mutation | rs777625063 | c.1327C>T | p.Arg443Trp | p.R443W | Q9NZS9 | protein_coding | deleterious(0.01) | possibly_damaging(0.828) | TCGA-CA-6717-01 | Colorectum | colon adenocarcinoma | Male | <65 | I/II | Chemotherapy | oxaliplatin | CR |
| Page: 1 2 3 4 5 |
Top |
Related drugs of malignant transformation related genes |
| Identification of chemicals and drugs interact with genes involved in malignant transfromation |
| (DGIdb 4.0) |
| Entrez ID | Symbol | Category | Interaction Types | Drug Claim Name | Drug Name | PMIDs |
| Page: 1 |

Copyright 2023-Present -The University of Texas Health Science Center at Houston |