
|
|||||
|
 | |
| |
| |
| |
| |
| |
|
Gene: BEX5 |
Gene summary for BEX5 |
| Gene information | Species | Human | Gene symbol | BEX5 | Gene ID | 340542 |
| Gene name | brain expressed X-linked 5 | |
| Gene Alias | NGFRAP1L1 | |
| Cytomap | Xq22.1 | |
| Gene Type | protein-coding | GO ID | GO:0007154 | UniProtAcc | Q5H9J7 |
Top |
Malignant transformation analysis |
| Identification of the aberrant gene expression in precancerous and cancerous lesions by comparing the gene expression of stem-like cells in diseased tissues with normal stem cells |
| Entrez ID | Symbol | Replicates | Species | Organ | Tissue | Adj P-value | Log2FC | Malignancy |
| 340542 | BEX5 | EEC-subject1 | Human | Endometrium | EEC | 2.11e-30 | 8.19e-01 | -0.2682 |
| 340542 | BEX5 | EEC-subject5 | Human | Endometrium | EEC | 7.65e-03 | 2.68e-01 | -0.249 |
| 340542 | BEX5 | GSM5276935 | Human | Endometrium | EEC | 4.01e-12 | 3.13e-01 | -0.123 |
| 340542 | BEX5 | GSM6177620_NYU_UCEC1_lib1_lib1 | Human | Endometrium | EEC | 2.98e-04 | 2.39e-01 | -0.1869 |
| 340542 | BEX5 | GSM6177620_NYU_UCEC1_lib3_lib3 | Human | Endometrium | EEC | 5.83e-03 | 1.20e-01 | -0.1883 |
| 340542 | BEX5 | GSM6177621_NYU_UCEC2_lib1_lib1 | Human | Endometrium | EEC | 2.70e-10 | 5.36e-01 | -0.1934 |
| 340542 | BEX5 | C04 | Human | Oral cavity | OSCC | 8.69e-11 | 5.60e-01 | 0.2633 |
| 340542 | BEX5 | C57 | Human | Oral cavity | OSCC | 3.73e-04 | 2.15e-01 | 0.1679 |
| 340542 | BEX5 | C06 | Human | Oral cavity | OSCC | 9.47e-05 | 6.38e-01 | 0.2699 |
| 340542 | BEX5 | C08 | Human | Oral cavity | OSCC | 1.18e-04 | 2.57e-01 | 0.1919 |
| 340542 | BEX5 | C09 | Human | Oral cavity | OSCC | 2.39e-02 | 1.87e-01 | 0.1431 |
| Page: 1 |
| Tissue | Expression Dynamics | Abbreviation |
| Endometrium | 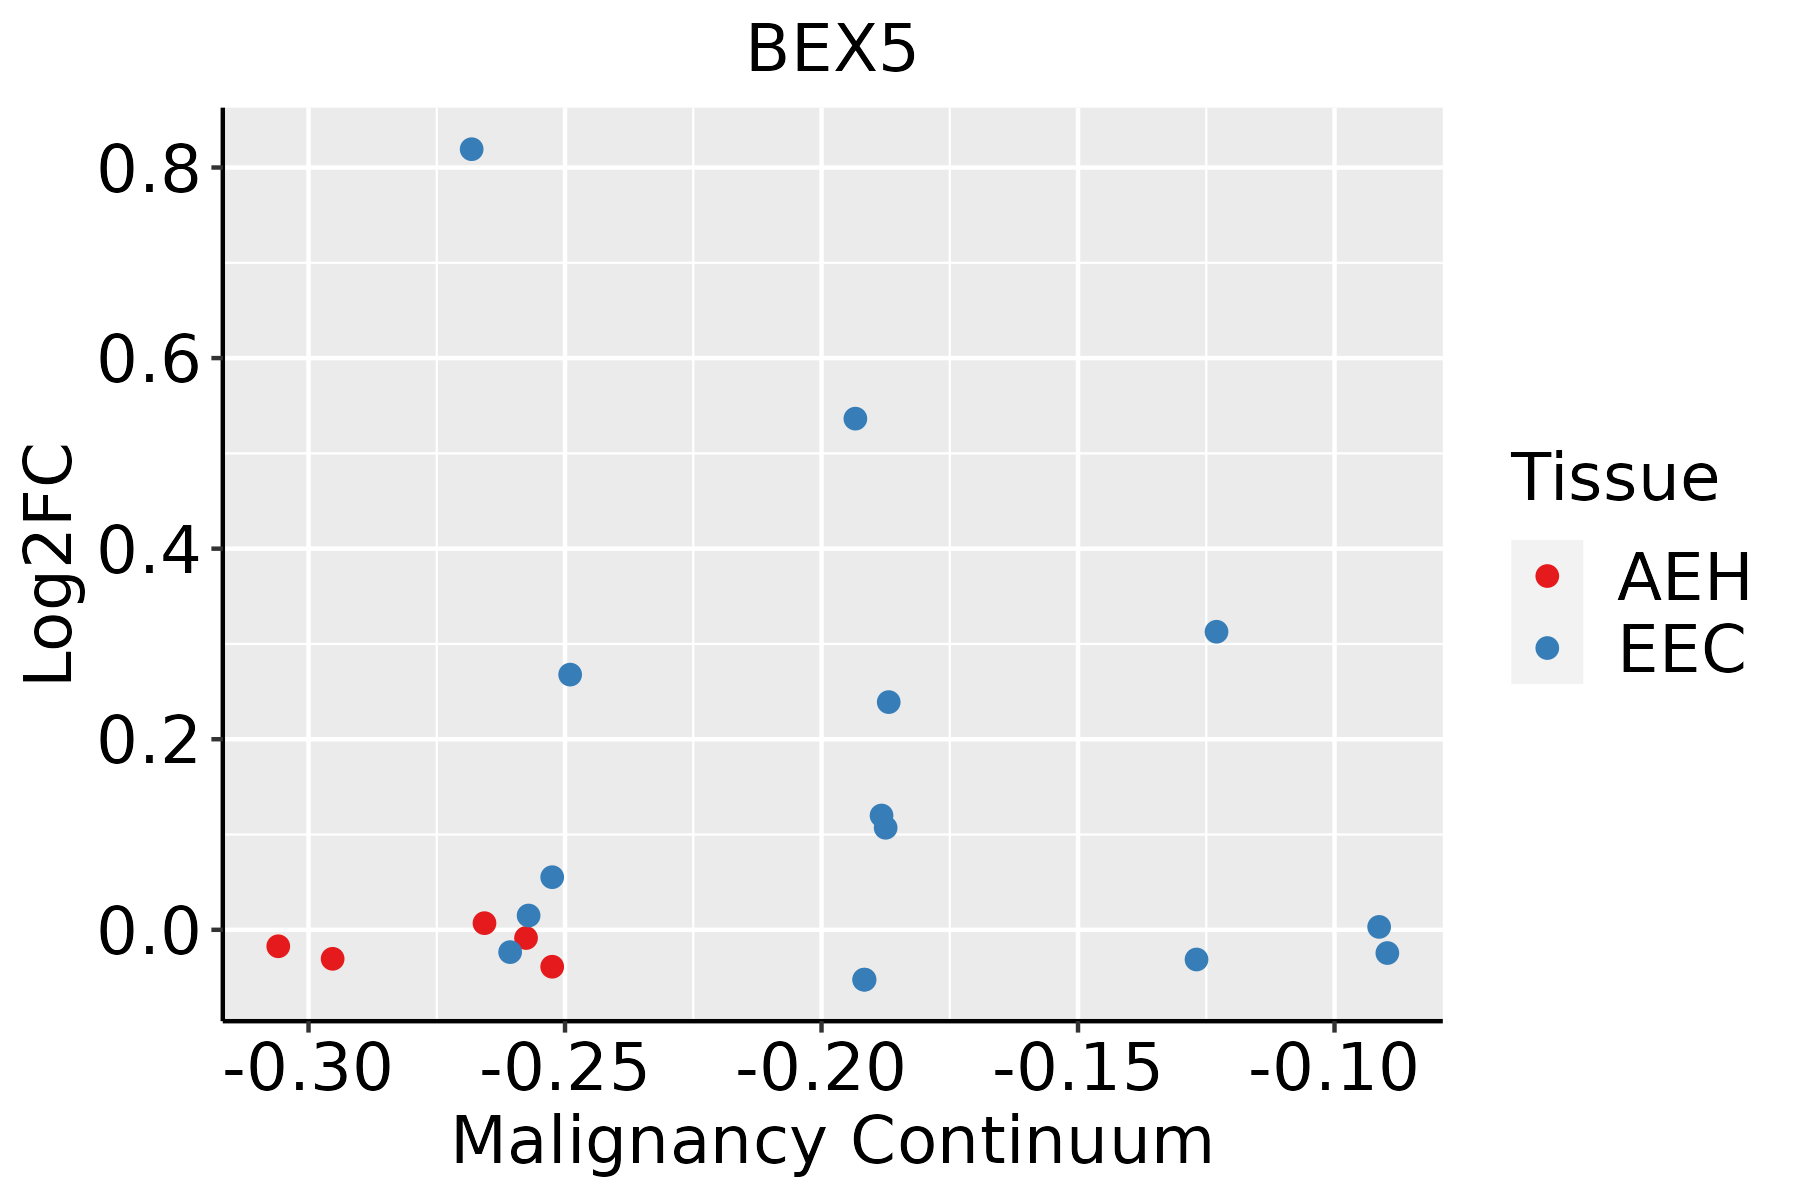 | AEH: Atypical endometrial hyperplasia |
| EEC: Endometrioid Cancer | ||
| Oral Cavity | 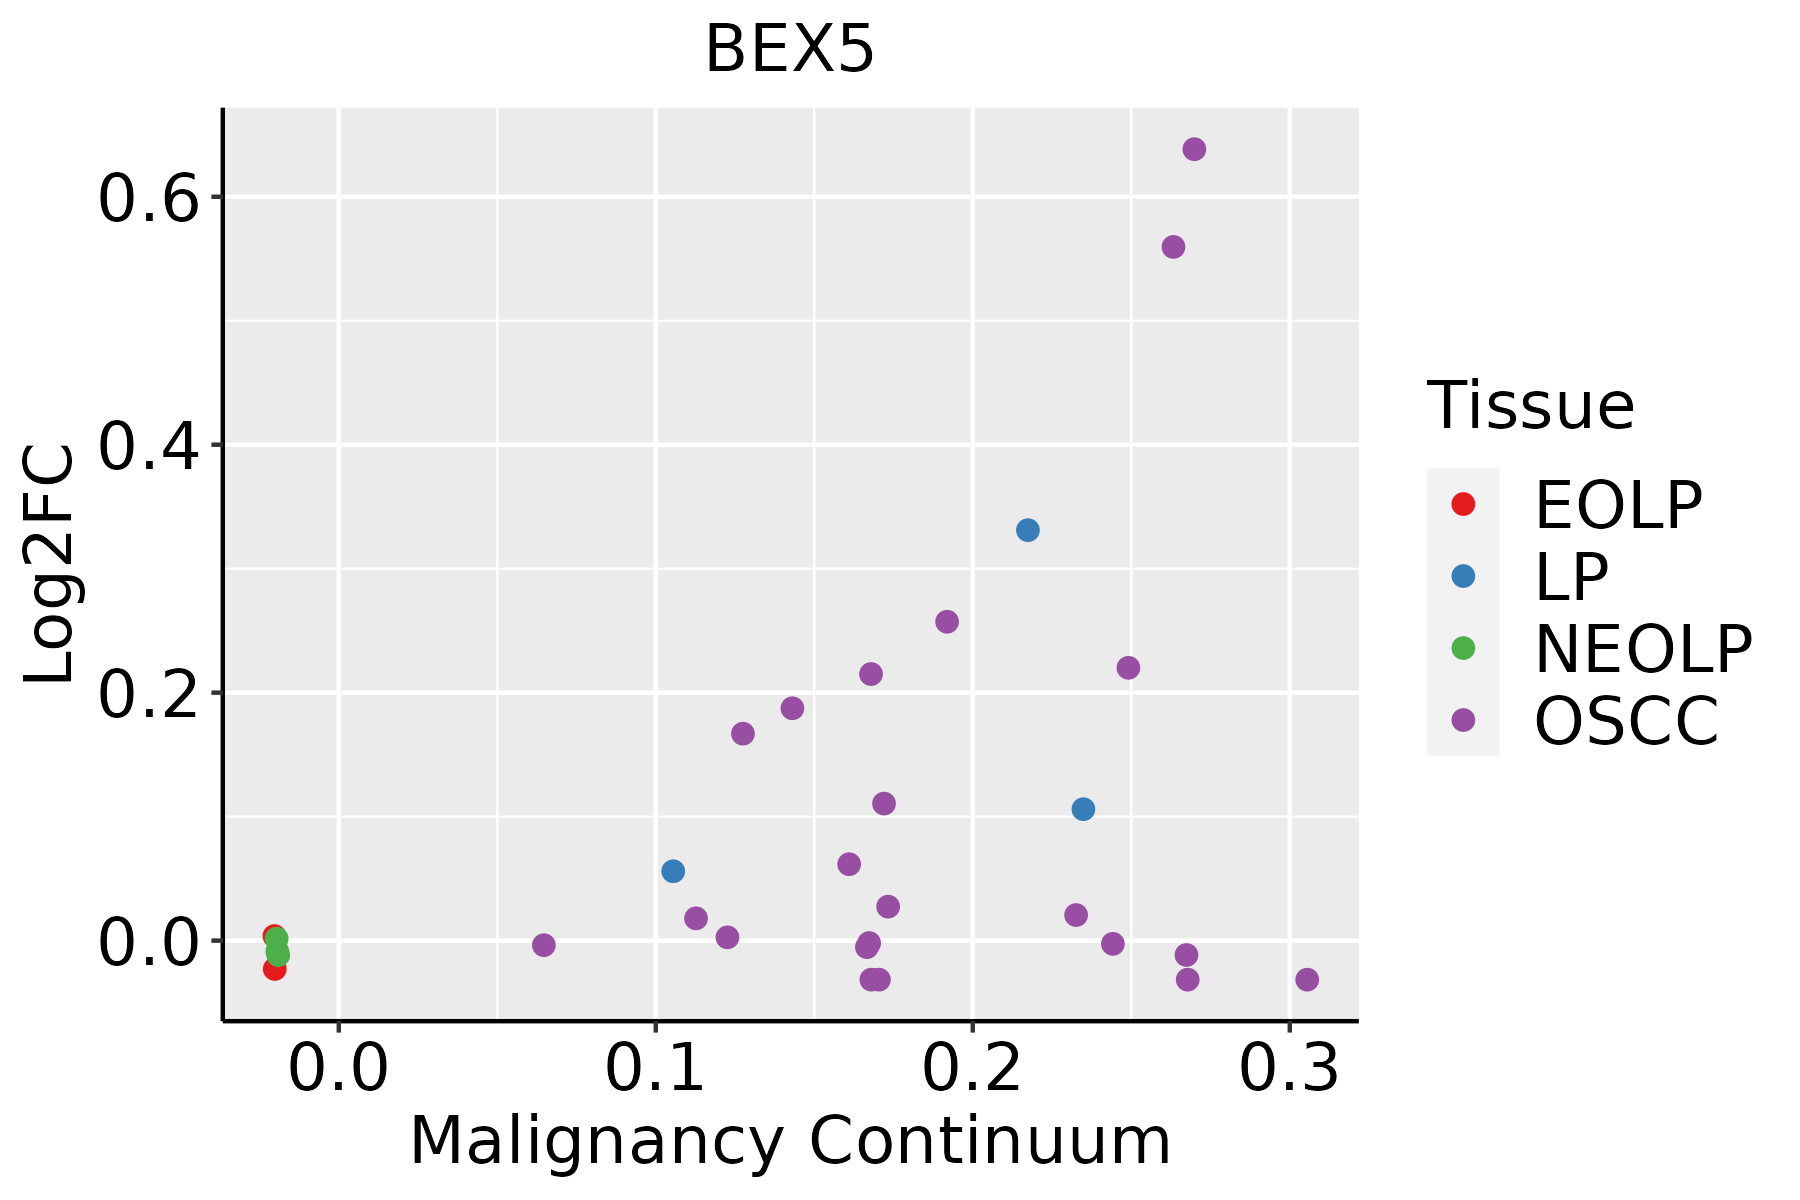 | EOLP: Erosive Oral lichen planus |
| LP: leukoplakia | ||
| NEOLP: Non-erosive oral lichen planus | ||
| OSCC: Oral squamous cell carcinoma |
| ∗log2FC in expression of this searched gene in stem-like cells from each diseased tissue sample relative to stem-like cells in normal samples in each tissue plotted against the malignancy continuum. Samples are colored based on if they are from different disease stage. |
Top |
Malignant transformation related pathway analysis |
| Find out the enriched GO biological processes and KEGG pathways involved in transition from healthy to precancer to cancer |
| Tissue | Disease Stage | Enriched GO biological Processes |
| Colorectum | AD |  |
| Colorectum | SER |  |
| Colorectum | MSS |  |
| Colorectum | MSI-H |  |
| Colorectum | FAP |  |
| ∗Top 15 enriched GO BP terms are showed in the bar plot of each disease state in each tissue. Each row represents a significant GO biological process which is colored according to the -log10(p.adjust). |
| Page: 1 2 3 4 5 6 7 8 9 |
| GO ID | Tissue | Disease Stage | Description | Gene Ratio | Bg Ratio | pvalue | p.adjust | Count |
| Page: 1 |
| Pathway ID | Tissue | Disease Stage | Description | Gene Ratio | Bg Ratio | pvalue | p.adjust | qvalue | Count |
| Page: 1 |
Top |
Cell-cell communication analysis |
| Identification of potential cell-cell interactions between two cell types and their ligand-receptor pairs for different disease states |
| Ligand | Receptor | LRpair | Pathway | Tissue | Disease Stage |
| Page: 1 |
Top |
Single-cell gene regulatory network inference analysis |
| Find out the significant the regulons (TFs) and the target genes of each regulon across cell types for different disease states |
| TF | Cell Type | Tissue | Disease Stage | Target Gene | RSS | Regulon Activity |
| ∗The dot plots of a searched regulon are shown for all cell subpopulations in each disease state of each tissue based on the regulon specific score inferred using pySCENIC and by calculating the average expression. |
| Page: 1 |
Top |
Somatic mutation of malignant transformation related genes |
| Annotation of somatic variants for genes involved in malignant transformation |
| Hugo Symbol | Variant Class | Variant Classification | dbSNP RS | HGVSc | HGVSp | HGVSp Short | SWISSPROT | BIOTYPE | SIFT | PolyPhen | Tumor Sample Barcode | Tissue | Histology | Sex | Age | Stage | Therapy Types | Drugs | Outcome |
| BEX5 | SNV | Missense_Mutation | c.295N>G | p.Pro99Ala | p.P99A | Q5H9J7 | protein_coding | deleterious(0.04) | possibly_damaging(0.826) | TCGA-JX-A3Q0-01 | Cervix | cervical & endocervical cancer | Female | <65 | III/IV | Unknown | Unknown | SD | |
| BEX5 | SNV | Missense_Mutation | novel | c.204G>A | p.Met68Ile | p.M68I | Q5H9J7 | protein_coding | tolerated(0.05) | benign(0.163) | TCGA-VS-A958-01 | Cervix | cervical & endocervical cancer | Female | <65 | I/II | Chemotherapy | cisplatin | CR |
| BEX5 | SNV | Missense_Mutation | c.298N>T | p.His100Tyr | p.H100Y | Q5H9J7 | protein_coding | deleterious(0.02) | benign(0.361) | TCGA-AA-3854-01 | Colorectum | colon adenocarcinoma | Female | >=65 | I/II | Unknown | Unknown | SD | |
| BEX5 | SNV | Missense_Mutation | c.166N>A | p.Asp56Asn | p.D56N | Q5H9J7 | protein_coding | tolerated(0.72) | benign(0.003) | TCGA-A5-A0G2-01 | Endometrium | uterine corpus endometrioid carcinoma | Female | <65 | III/IV | Unknown | Unknown | SD | |
| BEX5 | SNV | Missense_Mutation | rs781843692 | c.275N>A | p.Arg92His | p.R92H | Q5H9J7 | protein_coding | tolerated(0.05) | possibly_damaging(0.643) | TCGA-AP-A059-01 | Endometrium | uterine corpus endometrioid carcinoma | Female | >=65 | I/II | Unknown | Unknown | SD |
| BEX5 | SNV | Missense_Mutation | novel | c.151N>T | p.Pro51Ser | p.P51S | Q5H9J7 | protein_coding | tolerated(0.14) | benign(0.207) | TCGA-AP-A0LM-01 | Endometrium | uterine corpus endometrioid carcinoma | Female | <65 | III/IV | Chemotherapy | cisplatin | SD |
| BEX5 | SNV | Missense_Mutation | novel | c.160C>T | p.Leu54Phe | p.L54F | Q5H9J7 | protein_coding | tolerated(0.7) | benign(0.031) | TCGA-AP-A0LS-01 | Endometrium | uterine corpus endometrioid carcinoma | Female | <65 | I/II | Unknown | Unknown | SD |
| BEX5 | SNV | Missense_Mutation | novel | c.175N>T | p.Asp59Tyr | p.D59Y | Q5H9J7 | protein_coding | deleterious(0) | possibly_damaging(0.77) | TCGA-AP-A1E0-01 | Endometrium | uterine corpus endometrioid carcinoma | Female | <65 | III/IV | Chemotherapy | paclitaxel | SD |
| BEX5 | SNV | Missense_Mutation | novel | c.236N>A | p.Arg79Lys | p.R79K | Q5H9J7 | protein_coding | tolerated(0.41) | benign(0.166) | TCGA-AX-A06F-01 | Endometrium | uterine corpus endometrioid carcinoma | Female | <65 | III/IV | Chemotherapy | carboplatin | SD |
| BEX5 | SNV | Missense_Mutation | c.166N>A | p.Asp56Asn | p.D56N | Q5H9J7 | protein_coding | tolerated(0.72) | benign(0.003) | TCGA-AX-A0J0-01 | Endometrium | uterine corpus endometrioid carcinoma | Female | <65 | I/II | Unknown | Unknown | SD |
| Page: 1 2 |
Top |
Related drugs of malignant transformation related genes |
| Identification of chemicals and drugs interact with genes involved in malignant transfromation |
| (DGIdb 4.0) |
| Entrez ID | Symbol | Category | Interaction Types | Drug Claim Name | Drug Name | PMIDs |
| Page: 1 |

Copyright 2023-Present -The University of Texas Health Science Center at Houston |