
|
|||||
|
 | |
| |
| |
| |
| |
| |
|
Gene: BEX4 |
Gene summary for BEX4 |
| Gene information | Species | Human | Gene symbol | BEX4 | Gene ID | 56271 |
| Gene name | brain expressed X-linked 4 | |
| Gene Alias | BEXL1 | |
| Cytomap | Xq22.1 | |
| Gene Type | protein-coding | GO ID | GO:0006464 | UniProtAcc | Q9NWD9 |
Top |
Malignant transformation analysis |
| Identification of the aberrant gene expression in precancerous and cancerous lesions by comparing the gene expression of stem-like cells in diseased tissues with normal stem cells |
| Entrez ID | Symbol | Replicates | Species | Organ | Tissue | Adj P-value | Log2FC | Malignancy |
| 56271 | BEX4 | LZE4T | Human | Esophagus | ESCC | 1.04e-03 | -1.01e-01 | 0.0811 |
| 56271 | BEX4 | LZE7T | Human | Esophagus | ESCC | 7.05e-04 | 9.45e-01 | 0.0667 |
| 56271 | BEX4 | LZE8T | Human | Esophagus | ESCC | 8.18e-08 | 2.49e-01 | 0.067 |
| 56271 | BEX4 | LZE20T | Human | Esophagus | ESCC | 4.92e-03 | -1.03e-01 | 0.0662 |
| 56271 | BEX4 | LZE22D1 | Human | Esophagus | HGIN | 7.78e-03 | -2.14e-02 | 0.0595 |
| 56271 | BEX4 | LZE6T | Human | Esophagus | ESCC | 3.15e-02 | 4.17e-01 | 0.0845 |
| 56271 | BEX4 | P1T-E | Human | Esophagus | ESCC | 2.54e-08 | 7.67e-01 | 0.0875 |
| 56271 | BEX4 | P2T-E | Human | Esophagus | ESCC | 2.16e-77 | 1.41e+00 | 0.1177 |
| 56271 | BEX4 | P4T-E | Human | Esophagus | ESCC | 1.02e-36 | 1.06e+00 | 0.1323 |
| 56271 | BEX4 | P5T-E | Human | Esophagus | ESCC | 1.51e-27 | 6.49e-01 | 0.1327 |
| 56271 | BEX4 | P8T-E | Human | Esophagus | ESCC | 1.13e-02 | -1.41e-01 | 0.0889 |
| 56271 | BEX4 | P10T-E | Human | Esophagus | ESCC | 1.30e-65 | 1.43e+00 | 0.116 |
| 56271 | BEX4 | P12T-E | Human | Esophagus | ESCC | 1.83e-03 | -1.14e-01 | 0.1122 |
| 56271 | BEX4 | P15T-E | Human | Esophagus | ESCC | 4.67e-27 | 7.12e-01 | 0.1149 |
| 56271 | BEX4 | P16T-E | Human | Esophagus | ESCC | 2.16e-42 | 8.07e-01 | 0.1153 |
| 56271 | BEX4 | P20T-E | Human | Esophagus | ESCC | 2.00e-03 | -2.01e-01 | 0.1124 |
| 56271 | BEX4 | P22T-E | Human | Esophagus | ESCC | 2.45e-19 | 2.86e-01 | 0.1236 |
| 56271 | BEX4 | P23T-E | Human | Esophagus | ESCC | 1.04e-04 | 1.66e-01 | 0.108 |
| 56271 | BEX4 | P24T-E | Human | Esophagus | ESCC | 6.89e-04 | 2.00e-02 | 0.1287 |
| 56271 | BEX4 | P26T-E | Human | Esophagus | ESCC | 3.42e-28 | 7.44e-01 | 0.1276 |
| Page: 1 2 3 4 |
| Tissue | Expression Dynamics | Abbreviation |
| Esophagus | 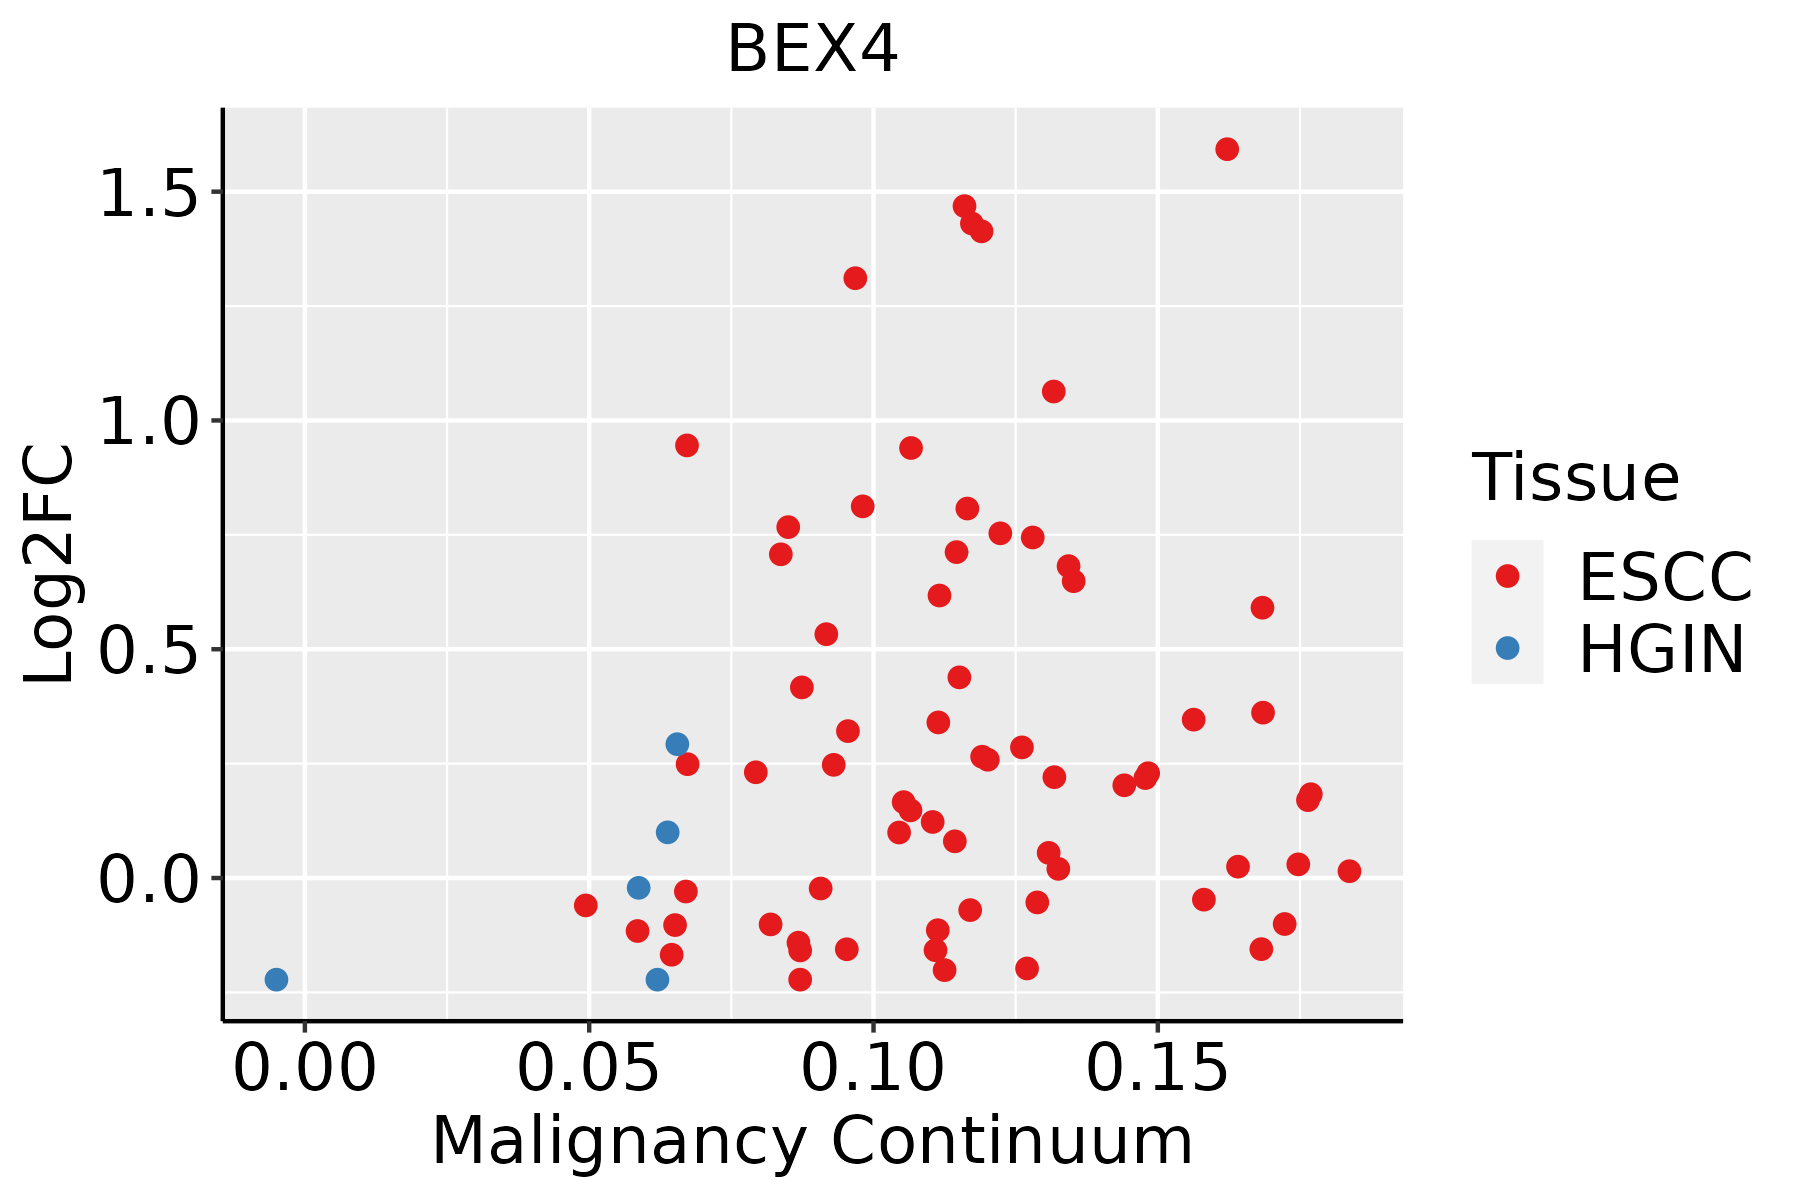 | ESCC: Esophageal squamous cell carcinoma |
| HGIN: High-grade intraepithelial neoplasias | ||
| LGIN: Low-grade intraepithelial neoplasias | ||
| Oral Cavity | 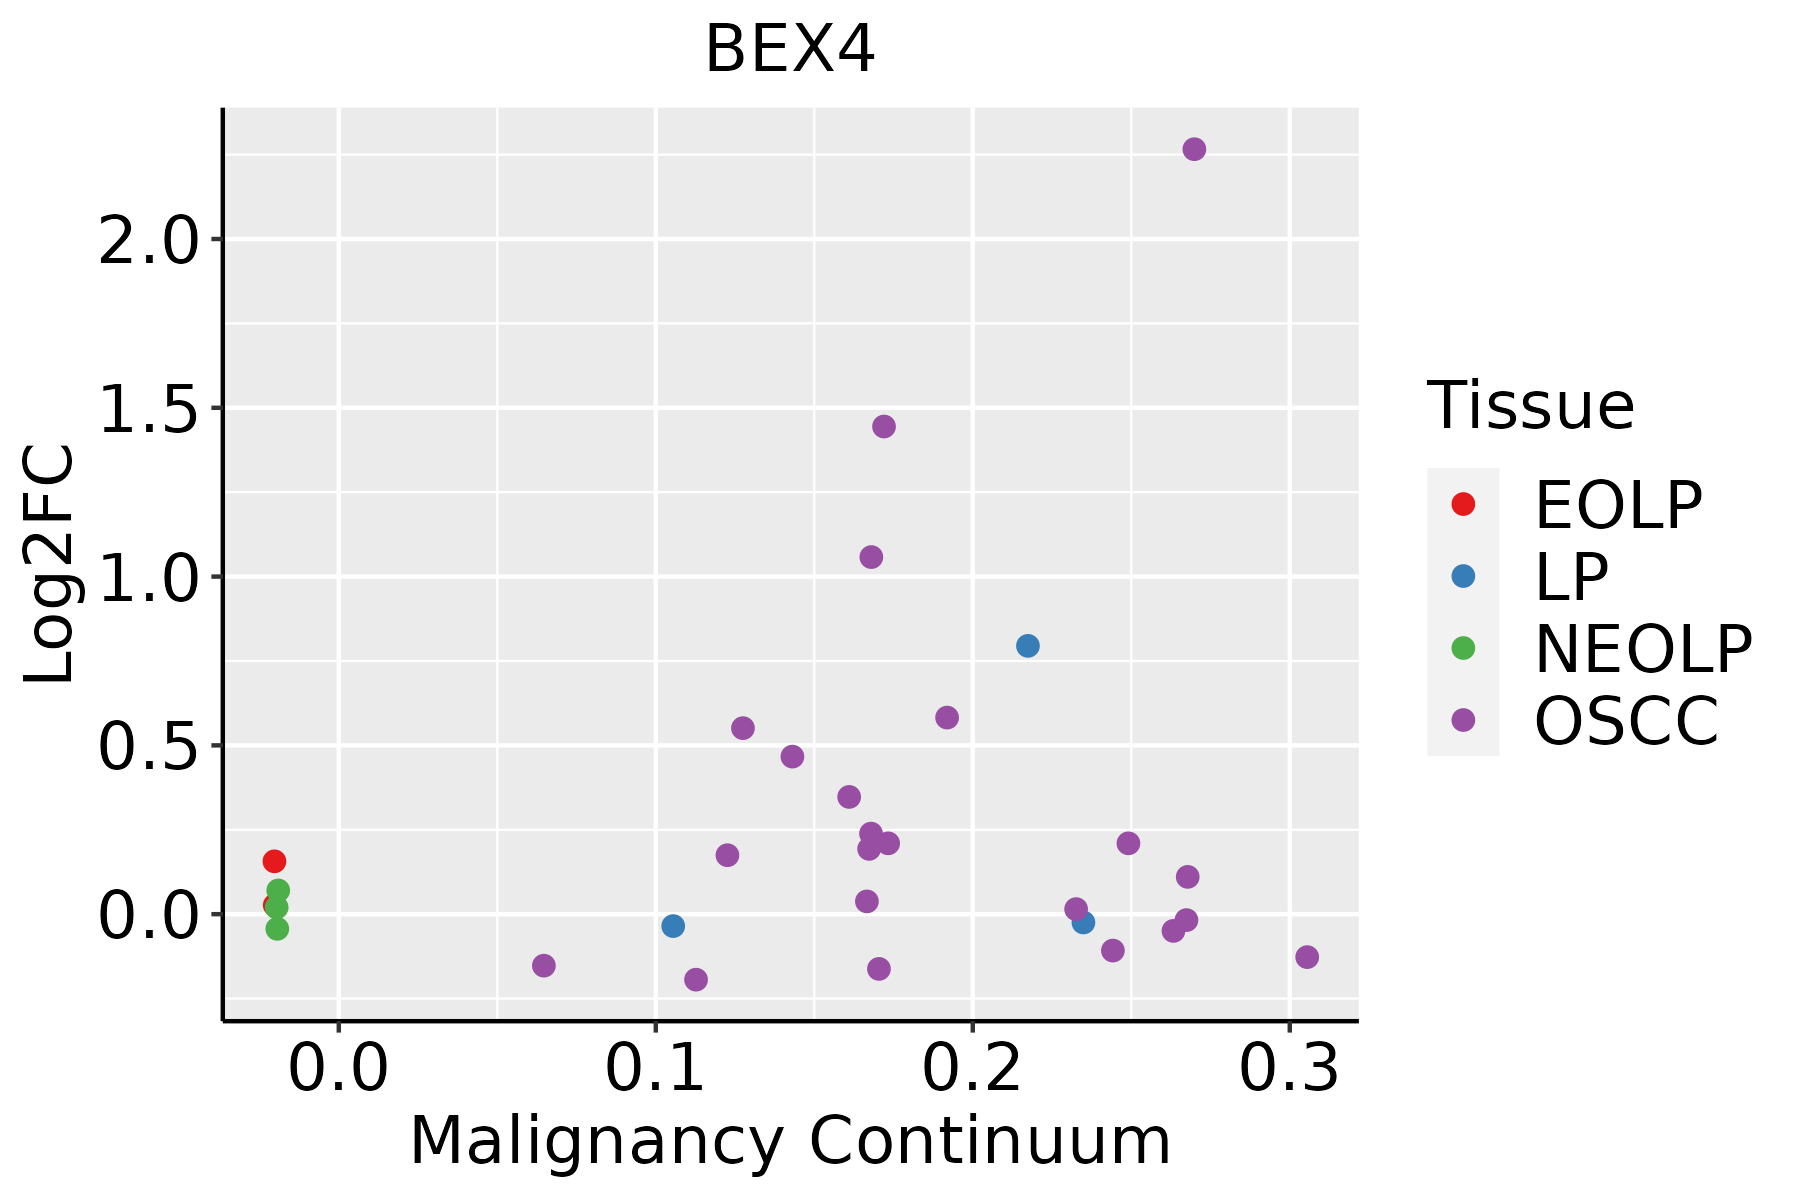 | EOLP: Erosive Oral lichen planus |
| LP: leukoplakia | ||
| NEOLP: Non-erosive oral lichen planus | ||
| OSCC: Oral squamous cell carcinoma | ||
| Thyroid | 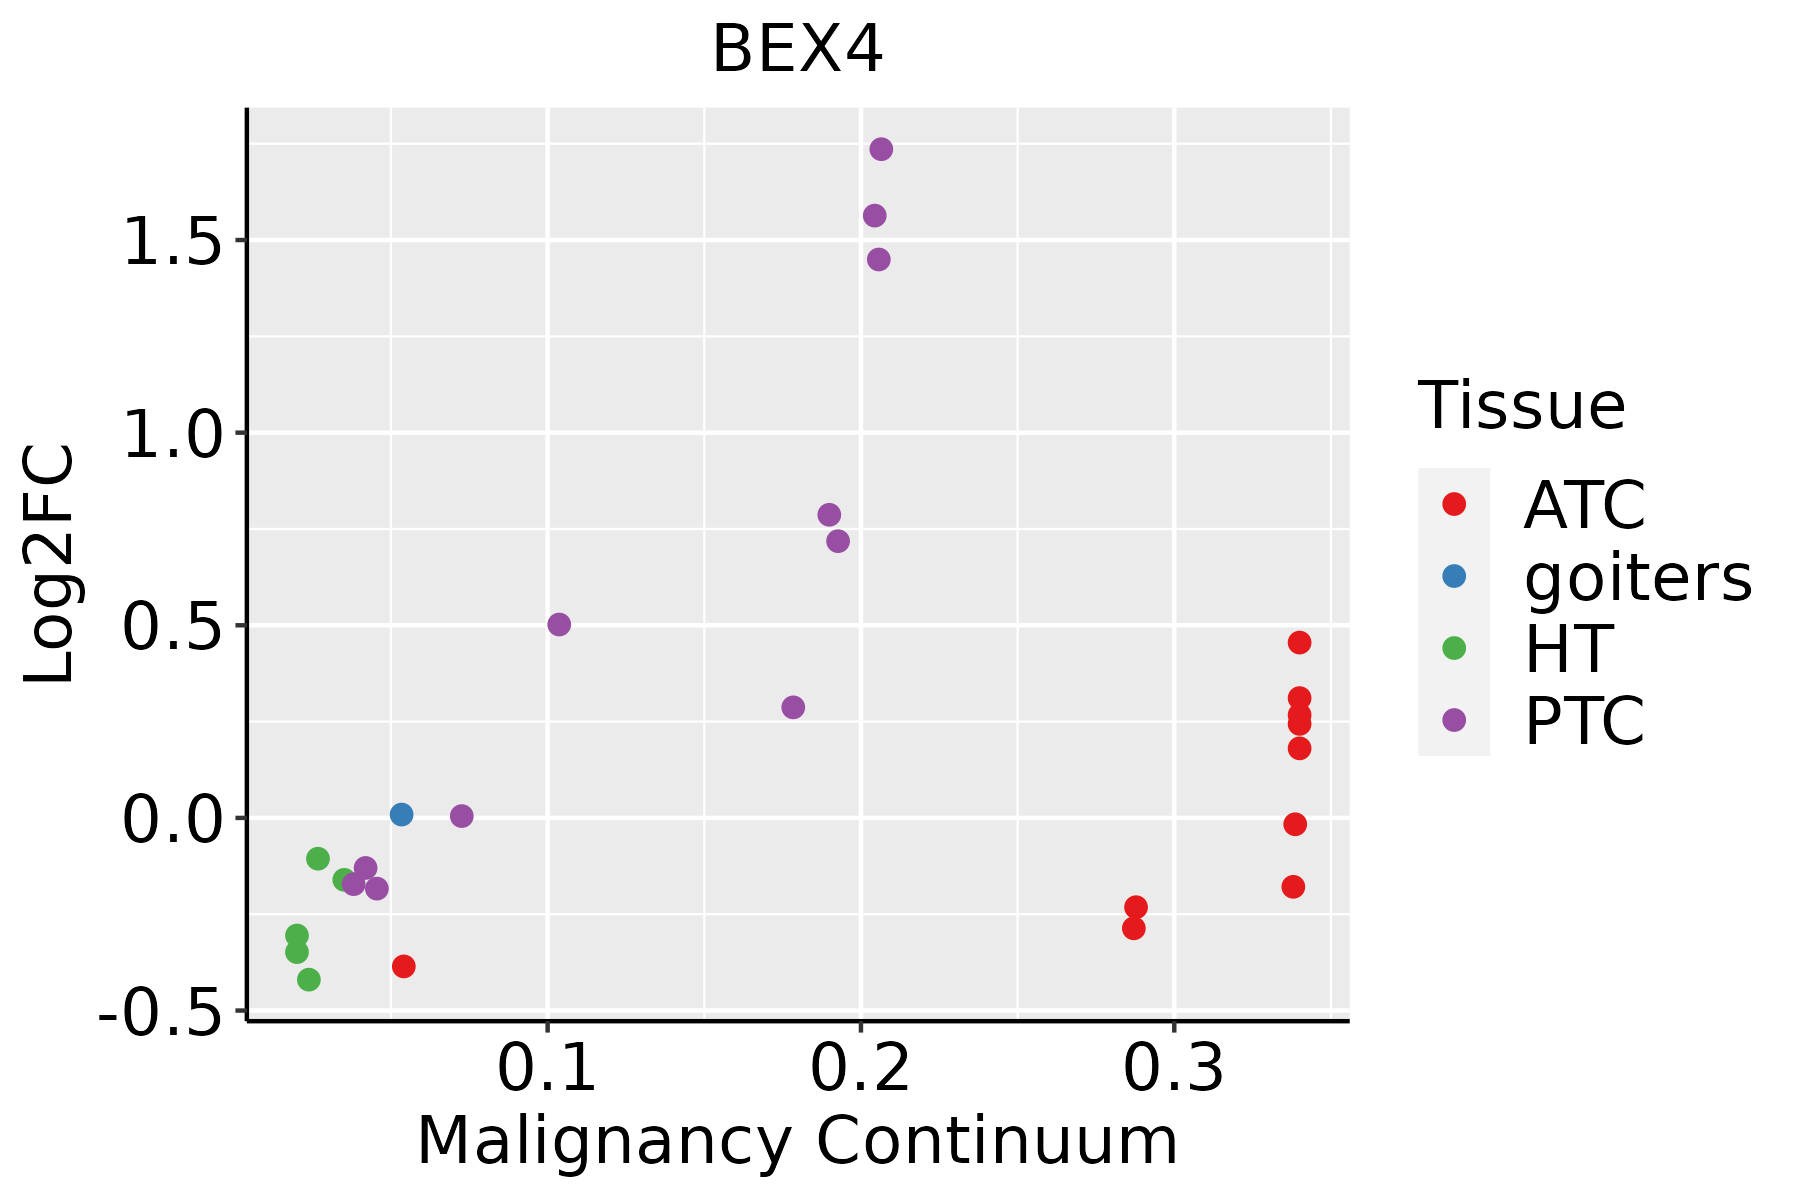 | ATC: Anaplastic thyroid cancer |
| HT: Hashimoto's thyroiditis | ||
| PTC: Papillary thyroid cancer |
| ∗log2FC in expression of this searched gene in stem-like cells from each diseased tissue sample relative to stem-like cells in normal samples in each tissue plotted against the malignancy continuum. Samples are colored based on if they are from different disease stage. |
Top |
Malignant transformation related pathway analysis |
| Find out the enriched GO biological processes and KEGG pathways involved in transition from healthy to precancer to cancer |
| Tissue | Disease Stage | Enriched GO biological Processes |
| Colorectum | AD |  |
| Colorectum | SER |  |
| Colorectum | MSS |  |
| Colorectum | MSI-H |  |
| Colorectum | FAP |  |
| ∗Top 15 enriched GO BP terms are showed in the bar plot of each disease state in each tissue. Each row represents a significant GO biological process which is colored according to the -log10(p.adjust). |
| Page: 1 2 3 4 5 6 7 8 9 |
| GO ID | Tissue | Disease Stage | Description | Gene Ratio | Bg Ratio | pvalue | p.adjust | Count |
| GO:00070593 | Esophagus | HGIN | chromosome segregation | 71/2587 | 346/18723 | 3.47e-04 | 5.62e-03 | 71 |
| GO:000705911 | Esophagus | ESCC | chromosome segregation | 238/8552 | 346/18723 | 1.72e-18 | 1.82e-16 | 238 |
| GO:00356015 | Esophagus | ESCC | protein deacylation | 79/8552 | 112/18723 | 8.30e-08 | 1.42e-06 | 79 |
| GO:00987325 | Esophagus | ESCC | macromolecule deacylation | 80/8552 | 116/18723 | 3.19e-07 | 4.50e-06 | 80 |
| GO:00064765 | Esophagus | ESCC | protein deacetylation | 70/8552 | 101/18723 | 1.29e-06 | 1.58e-05 | 70 |
| GO:00903114 | Esophagus | ESCC | regulation of protein deacetylation | 30/8552 | 48/18723 | 1.40e-02 | 4.57e-02 | 30 |
| GO:00070592 | Oral cavity | OSCC | chromosome segregation | 206/7305 | 346/18723 | 5.82e-15 | 3.76e-13 | 206 |
| GO:00356014 | Oral cavity | OSCC | protein deacylation | 74/7305 | 112/18723 | 5.88e-09 | 1.26e-07 | 74 |
| GO:00987324 | Oral cavity | OSCC | macromolecule deacylation | 74/7305 | 116/18723 | 5.52e-08 | 1.01e-06 | 74 |
| GO:00064764 | Oral cavity | OSCC | protein deacetylation | 66/7305 | 101/18723 | 7.36e-08 | 1.30e-06 | 66 |
| GO:00903113 | Oral cavity | OSCC | regulation of protein deacetylation | 30/7305 | 48/18723 | 8.31e-04 | 4.41e-03 | 30 |
| GO:00356017 | Thyroid | PTC | protein deacylation | 58/5968 | 112/18723 | 9.29e-06 | 1.05e-04 | 58 |
| GO:00064767 | Thyroid | PTC | protein deacetylation | 53/5968 | 101/18723 | 1.36e-05 | 1.47e-04 | 53 |
| GO:00070595 | Thyroid | PTC | chromosome segregation | 146/5968 | 346/18723 | 2.99e-05 | 2.87e-04 | 146 |
| GO:00987327 | Thyroid | PTC | macromolecule deacylation | 58/5968 | 116/18723 | 3.59e-05 | 3.36e-04 | 58 |
| GO:000705913 | Thyroid | ATC | chromosome segregation | 183/6293 | 346/18723 | 8.03e-14 | 4.23e-12 | 183 |
| GO:003560114 | Thyroid | ATC | protein deacylation | 61/6293 | 112/18723 | 4.37e-06 | 4.79e-05 | 61 |
| GO:000647614 | Thyroid | ATC | protein deacetylation | 56/6293 | 101/18723 | 5.15e-06 | 5.57e-05 | 56 |
| GO:009873213 | Thyroid | ATC | macromolecule deacylation | 61/6293 | 116/18723 | 1.89e-05 | 1.72e-04 | 61 |
| GO:00903116 | Thyroid | ATC | regulation of protein deacetylation | 25/6293 | 48/18723 | 6.27e-03 | 2.50e-02 | 25 |
| Page: 1 |
| Pathway ID | Tissue | Disease Stage | Description | Gene Ratio | Bg Ratio | pvalue | p.adjust | qvalue | Count |
| Page: 1 |
Top |
Cell-cell communication analysis |
| Identification of potential cell-cell interactions between two cell types and their ligand-receptor pairs for different disease states |
| Ligand | Receptor | LRpair | Pathway | Tissue | Disease Stage |
| Page: 1 |
Top |
Single-cell gene regulatory network inference analysis |
| Find out the significant the regulons (TFs) and the target genes of each regulon across cell types for different disease states |
| TF | Cell Type | Tissue | Disease Stage | Target Gene | RSS | Regulon Activity |
| ∗The dot plots of a searched regulon are shown for all cell subpopulations in each disease state of each tissue based on the regulon specific score inferred using pySCENIC and by calculating the average expression. |
| Page: 1 |
Top |
Somatic mutation of malignant transformation related genes |
| Annotation of somatic variants for genes involved in malignant transformation |
| Hugo Symbol | Variant Class | Variant Classification | dbSNP RS | HGVSc | HGVSp | HGVSp Short | SWISSPROT | BIOTYPE | SIFT | PolyPhen | Tumor Sample Barcode | Tissue | Histology | Sex | Age | Stage | Therapy Types | Drugs | Outcome |
| BEX4 | SNV | Missense_Mutation | rs750282321 | c.157G>A | p.Gly53Arg | p.G53R | Q9NWD9 | protein_coding | tolerated(0.05) | benign(0.03) | TCGA-A2-A1G4-01 | Breast | breast invasive carcinoma | Female | >=65 | III/IV | Chemotherapy | adriamycin | SD |
| BEX4 | SNV | Missense_Mutation | c.317A>G | p.Gln106Arg | p.Q106R | Q9NWD9 | protein_coding | tolerated(0.85) | benign(0.031) | TCGA-BH-A8G0-01 | Breast | breast invasive carcinoma | Female | <65 | I/II | Chemotherapy | taxotere | CR | |
| BEX4 | SNV | Missense_Mutation | c.71G>T | p.Gly24Val | p.G24V | Q9NWD9 | protein_coding | tolerated(0.28) | benign(0.031) | TCGA-AP-A051-01 | Endometrium | uterine corpus endometrioid carcinoma | Female | >=65 | I/II | Unknown | Unknown | SD | |
| BEX4 | SNV | Missense_Mutation | c.125N>G | p.Glu42Gly | p.E42G | Q9NWD9 | protein_coding | deleterious(0.03) | possibly_damaging(0.822) | TCGA-AX-A0J1-01 | Endometrium | uterine corpus endometrioid carcinoma | Female | >=65 | I/II | Unknown | Unknown | SD | |
| BEX4 | SNV | Missense_Mutation | rs749945390 | c.311N>A | p.Arg104His | p.R104H | Q9NWD9 | protein_coding | tolerated(0.06) | possibly_damaging(0.839) | TCGA-AX-A0J1-01 | Endometrium | uterine corpus endometrioid carcinoma | Female | >=65 | I/II | Unknown | Unknown | SD |
| BEX4 | SNV | Missense_Mutation | novel | c.310N>T | p.Arg104Cys | p.R104C | Q9NWD9 | protein_coding | tolerated(0.11) | benign(0.033) | TCGA-AX-A1CE-01 | Endometrium | uterine corpus endometrioid carcinoma | Female | <65 | I/II | Unspecific | Paclitaxel | SD |
| BEX4 | SNV | Missense_Mutation | rs749945390 | c.311N>A | p.Arg104His | p.R104H | Q9NWD9 | protein_coding | tolerated(0.06) | possibly_damaging(0.839) | TCGA-AX-A1CE-01 | Endometrium | uterine corpus endometrioid carcinoma | Female | <65 | I/II | Unspecific | Paclitaxel | SD |
| BEX4 | SNV | Missense_Mutation | novel | c.273N>T | p.Lys91Asn | p.K91N | Q9NWD9 | protein_coding | deleterious(0) | benign(0.386) | TCGA-AX-A2HC-01 | Endometrium | uterine corpus endometrioid carcinoma | Female | <65 | III/IV | Chemotherapy | paclitaxel | PD |
| BEX4 | SNV | Missense_Mutation | rs761698011 | c.49N>A | p.Ala17Thr | p.A17T | Q9NWD9 | protein_coding | tolerated(0.3) | benign(0.003) | TCGA-B5-A5OC-01 | Endometrium | uterine corpus endometrioid carcinoma | Female | >=65 | III/IV | Chemotherapy | cisplatin | SD |
| BEX4 | SNV | Missense_Mutation | novel | c.193G>A | p.Ala65Thr | p.A65T | Q9NWD9 | protein_coding | tolerated(0.13) | possibly_damaging(0.822) | TCGA-EO-A22R-01 | Endometrium | uterine corpus endometrioid carcinoma | Female | <65 | I/II | Unknown | Unknown | SD |
| Page: 1 2 |
Top |
Related drugs of malignant transformation related genes |
| Identification of chemicals and drugs interact with genes involved in malignant transfromation |
| (DGIdb 4.0) |
| Entrez ID | Symbol | Category | Interaction Types | Drug Claim Name | Drug Name | PMIDs |
| Page: 1 |

Copyright 2023-Present -The University of Texas Health Science Center at Houston |