
|
|||||
|
 | |
| |
| |
| |
| |
| |
|
Gene: BEX1 |
Gene summary for BEX1 |
| Gene information | Species | Human | Gene symbol | BEX1 | Gene ID | 55859 |
| Gene name | brain expressed X-linked 1 | |
| Gene Alias | BEX2 | |
| Cytomap | Xq22.1 | |
| Gene Type | protein-coding | GO ID | GO:0006139 | UniProtAcc | Q9HBH7 |
Top |
Malignant transformation analysis |
| Identification of the aberrant gene expression in precancerous and cancerous lesions by comparing the gene expression of stem-like cells in diseased tissues with normal stem cells |
| Entrez ID | Symbol | Replicates | Species | Organ | Tissue | Adj P-value | Log2FC | Malignancy |
| 55859 | BEX1 | S41 | Human | Liver | Cirrhotic | 9.42e-04 | -7.32e-01 | -0.0343 |
| 55859 | BEX1 | S43 | Human | Liver | Cirrhotic | 3.56e-28 | -7.32e-01 | -0.0187 |
| 55859 | BEX1 | HCC1_Meng | Human | Liver | HCC | 2.13e-27 | -7.32e-01 | 0.0246 |
| 55859 | BEX1 | HCC2_Meng | Human | Liver | HCC | 2.97e-25 | -7.23e-01 | 0.0107 |
| 55859 | BEX1 | cirrhotic1 | Human | Liver | Cirrhotic | 7.09e-13 | -7.99e-02 | 0.0202 |
| 55859 | BEX1 | cirrhotic2 | Human | Liver | Cirrhotic | 1.50e-05 | -3.58e-01 | 0.0201 |
| 55859 | BEX1 | cirrhotic3 | Human | Liver | Cirrhotic | 8.73e-06 | -4.74e-01 | 0.0215 |
| 55859 | BEX1 | HCC2 | Human | Liver | HCC | 4.06e-07 | 9.02e-01 | 0.5341 |
| 55859 | BEX1 | HCC5 | Human | Liver | HCC | 6.91e-12 | -7.32e-01 | 0.4932 |
| 55859 | BEX1 | Pt13.a | Human | Liver | HCC | 9.62e-30 | -7.32e-01 | 0.021 |
| 55859 | BEX1 | Pt13.b | Human | Liver | HCC | 5.92e-21 | -7.32e-01 | 0.0251 |
| 55859 | BEX1 | Pt13.c | Human | Liver | HCC | 5.77e-14 | -7.32e-01 | 0.0076 |
| 55859 | BEX1 | Pt14.a | Human | Liver | HCC | 1.97e-02 | -7.32e-01 | 0.0169 |
| 55859 | BEX1 | Pt14.b | Human | Liver | HCC | 7.18e-04 | -7.32e-01 | 0.018 |
| 55859 | BEX1 | Pt14.c | Human | Liver | HCC | 6.56e-05 | -7.32e-01 | 0.0054 |
| 55859 | BEX1 | Pt14.d | Human | Liver | HCC | 1.79e-25 | -7.23e-01 | 0.0143 |
| 55859 | BEX1 | S027 | Human | Liver | HCC | 9.42e-04 | -7.32e-01 | 0.2446 |
| 55859 | BEX1 | S028 | Human | Liver | HCC | 1.96e-13 | -7.32e-01 | 0.2503 |
| 55859 | BEX1 | S029 | Human | Liver | HCC | 1.32e-11 | -7.32e-01 | 0.2581 |
| 55859 | BEX1 | HTA12-15-2 | Human | Pancreas | PDAC | 2.58e-05 | 8.98e-01 | 0.2315 |
| Page: 1 2 |
| Tissue | Expression Dynamics | Abbreviation |
| Liver | 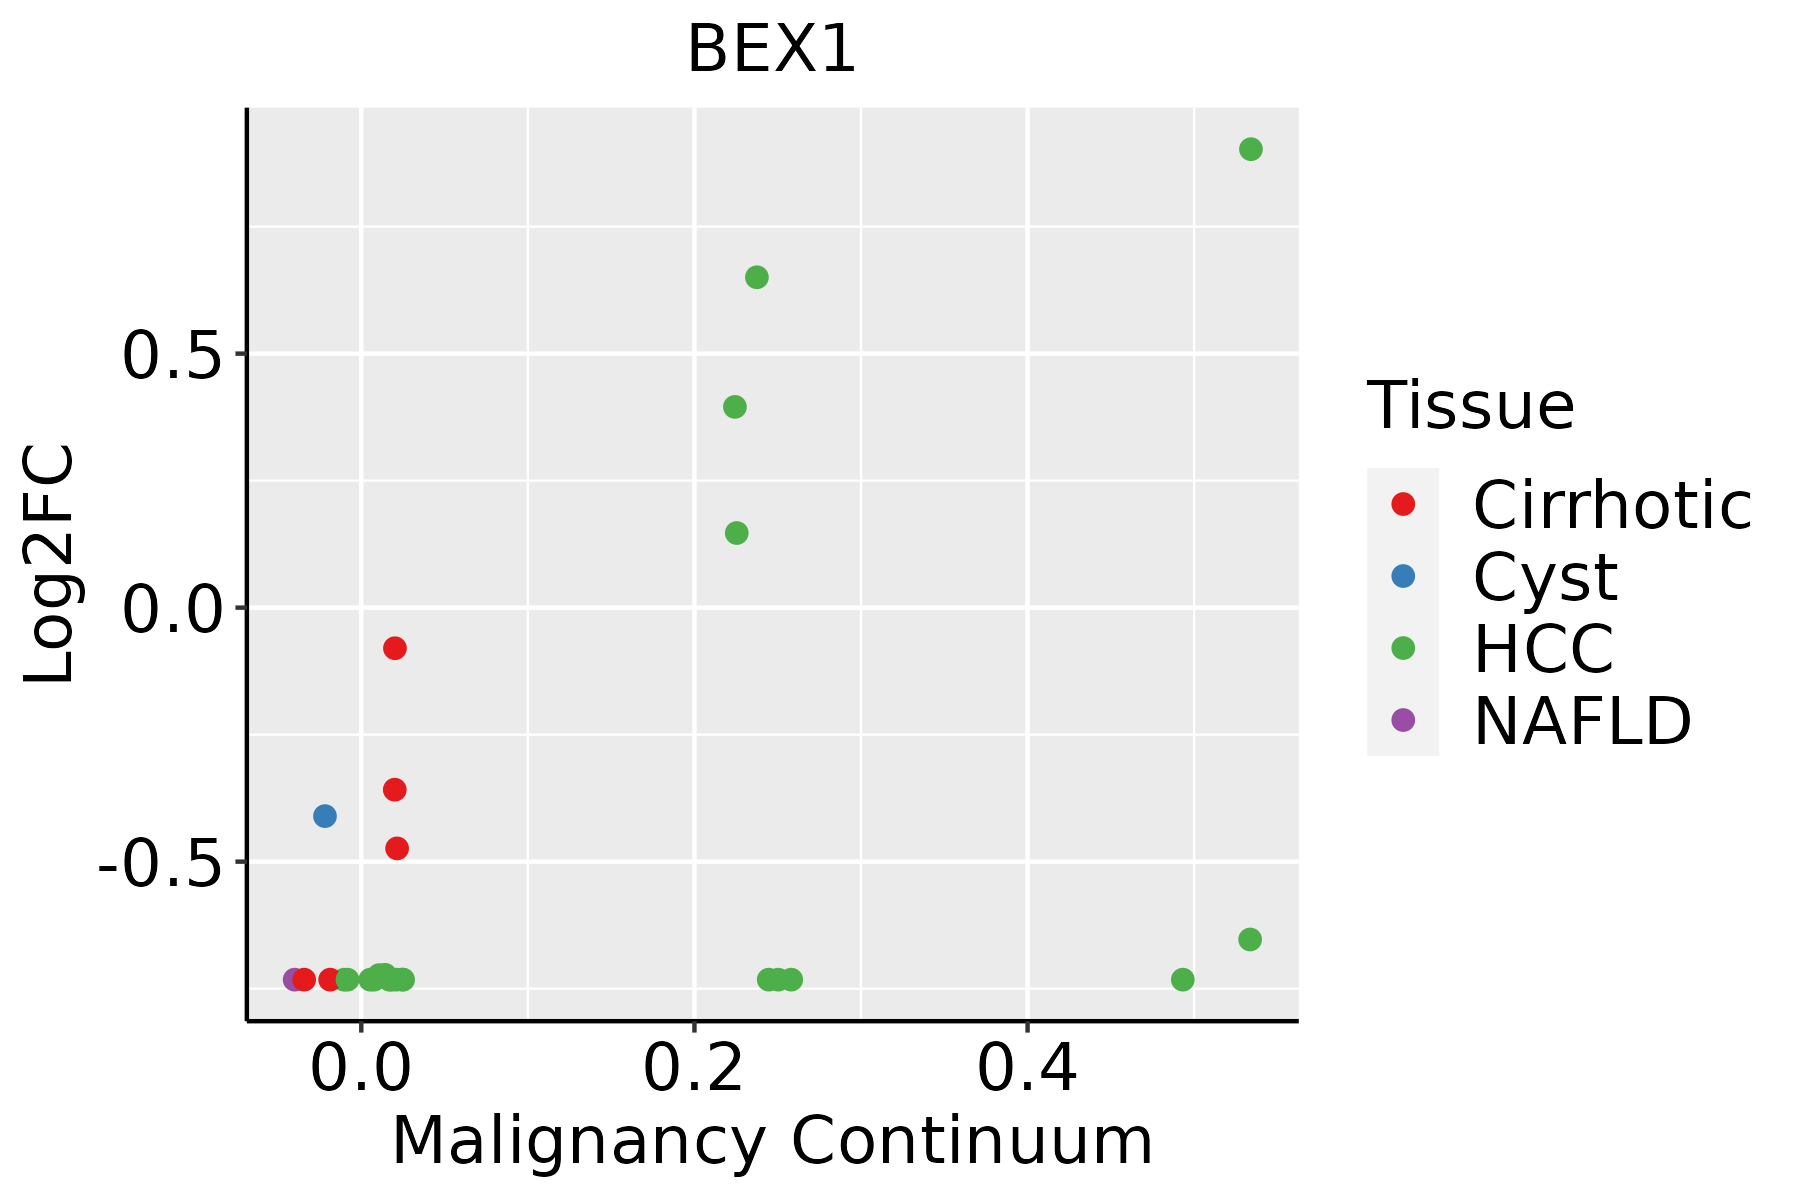 | HCC: Hepatocellular carcinoma |
| NAFLD: Non-alcoholic fatty liver disease | ||
| Thyroid | 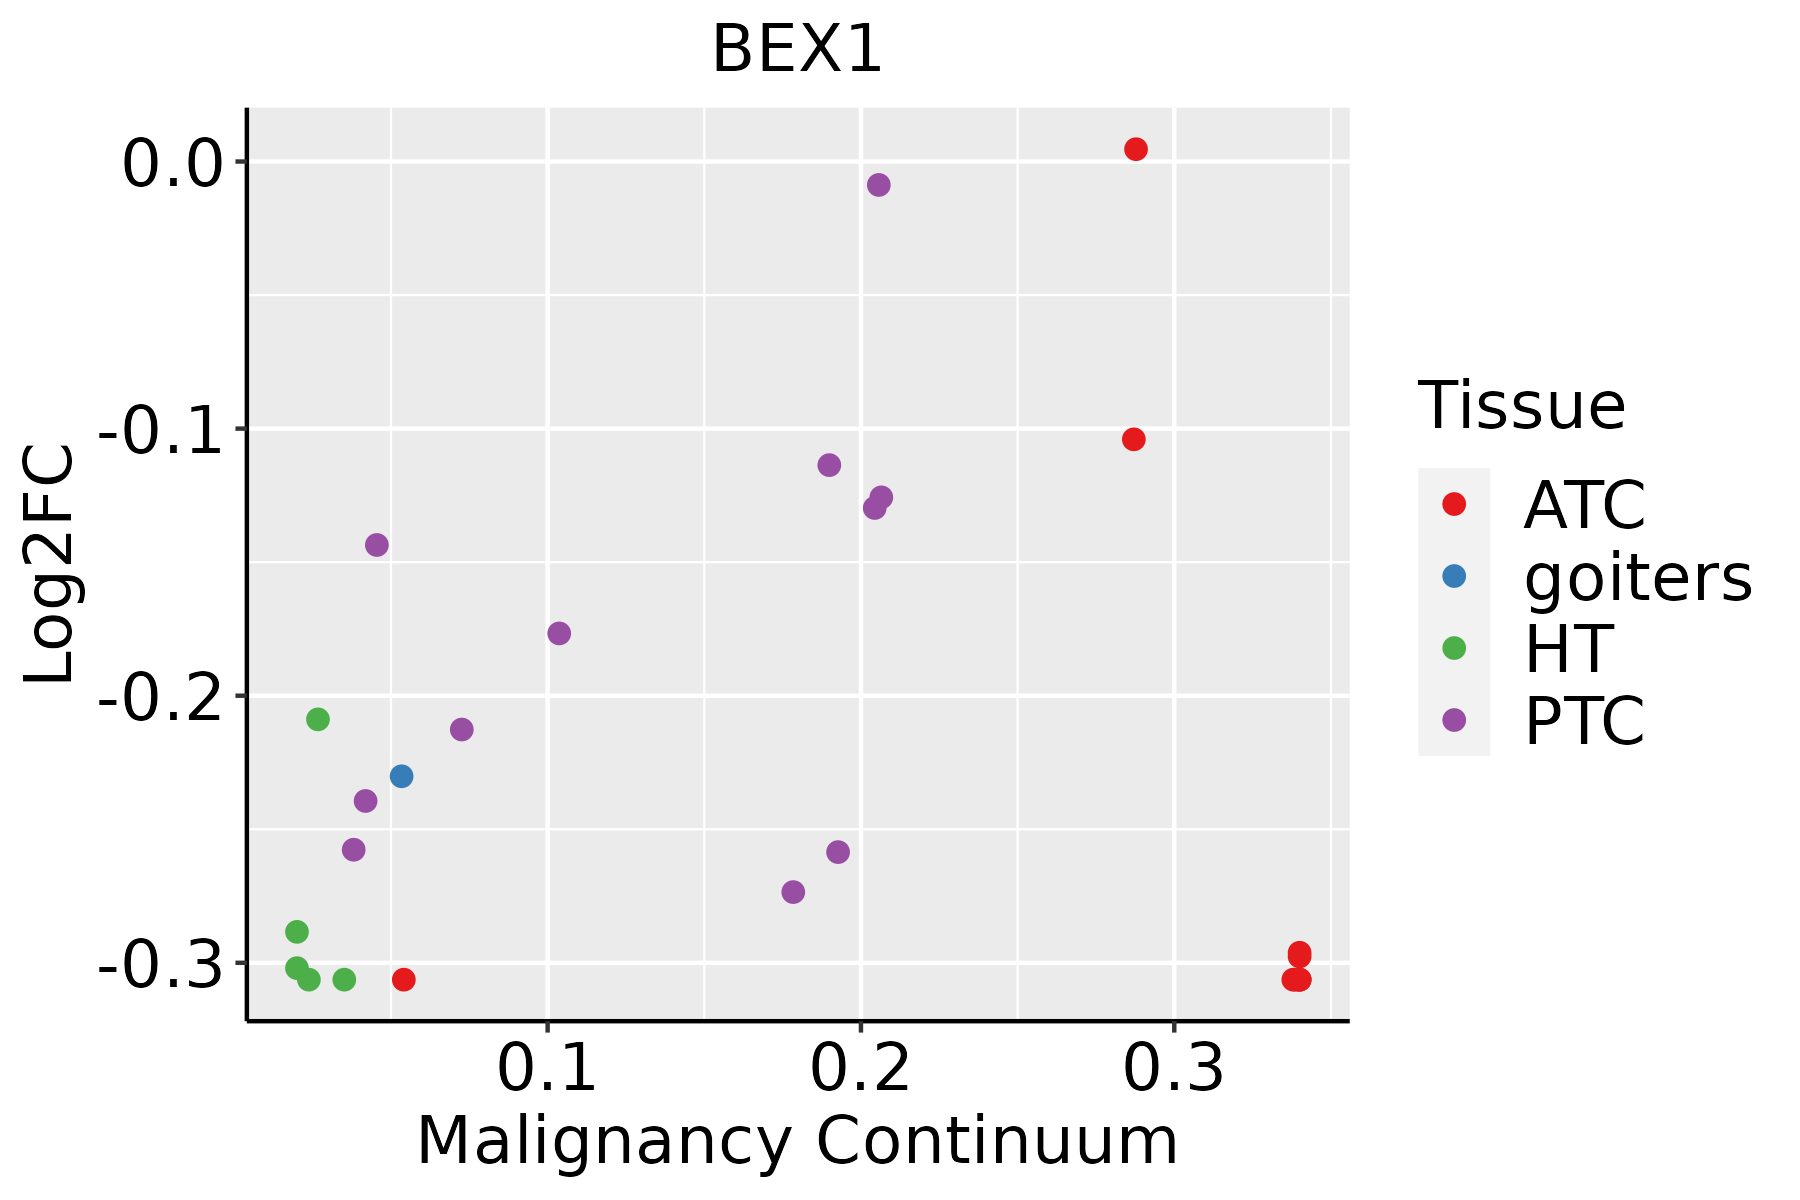 | ATC: Anaplastic thyroid cancer |
| HT: Hashimoto's thyroiditis | ||
| PTC: Papillary thyroid cancer |
| ∗log2FC in expression of this searched gene in stem-like cells from each diseased tissue sample relative to stem-like cells in normal samples in each tissue plotted against the malignancy continuum. Samples are colored based on if they are from different disease stage. |
Top |
Malignant transformation related pathway analysis |
| Find out the enriched GO biological processes and KEGG pathways involved in transition from healthy to precancer to cancer |
| Tissue | Disease Stage | Enriched GO biological Processes |
| Colorectum | AD |  |
| Colorectum | SER |  |
| Colorectum | MSS |  |
| Colorectum | MSI-H |  |
| Colorectum | FAP |  |
| ∗Top 15 enriched GO BP terms are showed in the bar plot of each disease state in each tissue. Each row represents a significant GO biological process which is colored according to the -log10(p.adjust). |
| Page: 1 2 3 4 5 6 7 8 9 |
| GO ID | Tissue | Disease Stage | Description | Gene Ratio | Bg Ratio | pvalue | p.adjust | Count |
| GO:00510902 | Liver | HCC | regulation of DNA-binding transcription factor activity | 220/7958 | 440/18723 | 8.04e-04 | 4.82e-03 | 220 |
| GO:00510913 | Liver | HCC | positive regulation of DNA-binding transcription factor activity | 131/7958 | 260/18723 | 5.98e-03 | 2.45e-02 | 131 |
| GO:005109010 | Thyroid | HT | regulation of DNA-binding transcription factor activity | 46/1272 | 440/18723 | 2.39e-03 | 2.03e-02 | 46 |
| GO:005109110 | Thyroid | HT | positive regulation of DNA-binding transcription factor activity | 30/1272 | 260/18723 | 3.15e-03 | 2.52e-02 | 30 |
| GO:005109016 | Thyroid | PTC | regulation of DNA-binding transcription factor activity | 178/5968 | 440/18723 | 7.63e-05 | 6.54e-04 | 178 |
| GO:005109115 | Thyroid | PTC | positive regulation of DNA-binding transcription factor activity | 107/5968 | 260/18723 | 9.44e-04 | 5.70e-03 | 107 |
| GO:005109022 | Thyroid | ATC | regulation of DNA-binding transcription factor activity | 190/6293 | 440/18723 | 1.49e-05 | 1.39e-04 | 190 |
| GO:005109122 | Thyroid | ATC | positive regulation of DNA-binding transcription factor activity | 111/6293 | 260/18723 | 1.32e-03 | 6.88e-03 | 111 |
| Page: 1 |
| Pathway ID | Tissue | Disease Stage | Description | Gene Ratio | Bg Ratio | pvalue | p.adjust | qvalue | Count |
| Page: 1 |
Top |
Cell-cell communication analysis |
| Identification of potential cell-cell interactions between two cell types and their ligand-receptor pairs for different disease states |
| Ligand | Receptor | LRpair | Pathway | Tissue | Disease Stage |
| Page: 1 |
Top |
Single-cell gene regulatory network inference analysis |
| Find out the significant the regulons (TFs) and the target genes of each regulon across cell types for different disease states |
| TF | Cell Type | Tissue | Disease Stage | Target Gene | RSS | Regulon Activity |
| ∗The dot plots of a searched regulon are shown for all cell subpopulations in each disease state of each tissue based on the regulon specific score inferred using pySCENIC and by calculating the average expression. |
| Page: 1 |
Top |
Somatic mutation of malignant transformation related genes |
| Annotation of somatic variants for genes involved in malignant transformation |
| Hugo Symbol | Variant Class | Variant Classification | dbSNP RS | HGVSc | HGVSp | HGVSp Short | SWISSPROT | BIOTYPE | SIFT | PolyPhen | Tumor Sample Barcode | Tissue | Histology | Sex | Age | Stage | Therapy Types | Drugs | Outcome |
| BEX1 | insertion | Nonsense_Mutation | novel | c.127_128insG | p.Tyr43Ter | p.Y43* | Q9HBH7 | protein_coding | TCGA-A2-A0CT-01 | Breast | breast invasive carcinoma | Female | >=65 | I/II | Chemotherapy | cytoxan | SD | ||
| BEX1 | insertion | In_Frame_Ins | novel | c.126_127insACCTTTACCTGTCACTTGTTTACG | p.Glu42_Tyr43insThrPheThrCysHisLeuPheThr | p.E42_Y43insTFTCHLFT | Q9HBH7 | protein_coding | TCGA-A2-A0CT-01 | Breast | breast invasive carcinoma | Female | >=65 | I/II | Chemotherapy | cytoxan | SD | ||
| BEX1 | SNV | Missense_Mutation | novel | c.164N>C | p.Val55Ala | p.V55A | Q9HBH7 | protein_coding | tolerated(0.21) | benign(0.015) | TCGA-AA-3984-01 | Colorectum | colon adenocarcinoma | Female | <65 | I/II | Unknown | Unknown | SD |
| BEX1 | SNV | Missense_Mutation | rs1045065 | c.50C>T | p.Ala17Val | p.A17V | Q9HBH7 | protein_coding | tolerated(0.37) | benign(0.001) | TCGA-G4-6302-01 | Colorectum | colon adenocarcinoma | Female | >=65 | I/II | Unknown | Unknown | SD |
| BEX1 | SNV | Missense_Mutation | c.154N>T | p.Arg52Trp | p.R52W | Q9HBH7 | protein_coding | tolerated(0.08) | probably_damaging(0.91) | TCGA-G4-6304-01 | Colorectum | colon adenocarcinoma | Female | >=65 | I/II | Chemotherapy | fluorouracil | PD | |
| BEX1 | SNV | Missense_Mutation | c.302N>C | p.Leu101Ser | p.L101S | Q9HBH7 | protein_coding | tolerated(0.07) | possibly_damaging(0.502) | TCGA-QG-A5Z2-01 | Colorectum | colon adenocarcinoma | Male | <65 | I/II | Unknown | Unknown | SD | |
| BEX1 | SNV | Missense_Mutation | c.148N>T | p.Arg50Cys | p.R50C | Q9HBH7 | protein_coding | tolerated(0.18) | benign(0.165) | TCGA-A5-A0G2-01 | Endometrium | uterine corpus endometrioid carcinoma | Female | <65 | III/IV | Unknown | Unknown | SD | |
| BEX1 | SNV | Missense_Mutation | c.148N>T | p.Arg50Cys | p.R50C | Q9HBH7 | protein_coding | tolerated(0.18) | benign(0.165) | TCGA-AP-A1DV-01 | Endometrium | uterine corpus endometrioid carcinoma | Female | <65 | I/II | Unknown | Unknown | SD | |
| BEX1 | SNV | Missense_Mutation | novel | c.79N>T | p.Val27Phe | p.V27F | Q9HBH7 | protein_coding | tolerated(0.05) | benign(0.057) | TCGA-AX-A06F-01 | Endometrium | uterine corpus endometrioid carcinoma | Female | <65 | III/IV | Chemotherapy | carboplatin | SD |
| BEX1 | SNV | Missense_Mutation | c.97N>T | p.Pro33Ser | p.P33S | Q9HBH7 | protein_coding | tolerated(0.14) | benign(0.048) | TCGA-B5-A0JY-01 | Endometrium | uterine corpus endometrioid carcinoma | Female | <65 | III/IV | Chemotherapy | doxorubicin | SD |
| Page: 1 2 3 |
Top |
Related drugs of malignant transformation related genes |
| Identification of chemicals and drugs interact with genes involved in malignant transfromation |
| (DGIdb 4.0) |
| Entrez ID | Symbol | Category | Interaction Types | Drug Claim Name | Drug Name | PMIDs |
| Page: 1 |

Copyright 2023-Present -The University of Texas Health Science Center at Houston |