
|
|||||
|
 | |
| |
| |
| |
| |
| |
|
Gene: BET1L |
Gene summary for BET1L |
| Gene information | Species | Human | Gene symbol | BET1L | Gene ID | 51272 |
| Gene name | Bet1 golgi vesicular membrane trafficking protein like | |
| Gene Alias | BET1L1 | |
| Cytomap | 11p15.5 | |
| Gene Type | protein-coding | GO ID | GO:0006810 | UniProtAcc | Q9NYM9 |
Top |
Malignant transformation analysis |
| Identification of the aberrant gene expression in precancerous and cancerous lesions by comparing the gene expression of stem-like cells in diseased tissues with normal stem cells |
| Entrez ID | Symbol | Replicates | Species | Organ | Tissue | Adj P-value | Log2FC | Malignancy |
| 51272 | BET1L | HTA11_2487_2000001011 | Human | Colorectum | SER | 5.04e-04 | 2.58e-01 | -0.1808 |
| 51272 | BET1L | HTA11_1938_2000001011 | Human | Colorectum | AD | 8.25e-03 | 2.10e-01 | -0.0811 |
| 51272 | BET1L | HTA11_78_2000001011 | Human | Colorectum | AD | 1.34e-09 | 3.64e-01 | -0.1088 |
| 51272 | BET1L | HTA11_347_2000001011 | Human | Colorectum | AD | 1.63e-15 | 3.57e-01 | -0.1954 |
| 51272 | BET1L | HTA11_411_2000001011 | Human | Colorectum | SER | 7.42e-03 | 4.71e-01 | -0.2602 |
| 51272 | BET1L | HTA11_83_2000001011 | Human | Colorectum | SER | 2.47e-03 | 2.18e-01 | -0.1526 |
| 51272 | BET1L | HTA11_696_2000001011 | Human | Colorectum | AD | 4.79e-10 | 3.49e-01 | -0.1464 |
| 51272 | BET1L | HTA11_1391_2000001011 | Human | Colorectum | AD | 1.69e-16 | 4.92e-01 | -0.059 |
| 51272 | BET1L | HTA11_7862_2000001011 | Human | Colorectum | AD | 9.71e-03 | 2.73e-01 | -0.0179 |
| 51272 | BET1L | HTA11_866_3004761011 | Human | Colorectum | AD | 6.89e-09 | 2.79e-01 | 0.096 |
| 51272 | BET1L | HTA11_4255_2000001011 | Human | Colorectum | SER | 2.89e-02 | 3.49e-01 | 0.0446 |
| 51272 | BET1L | HTA11_8622_2000001021 | Human | Colorectum | SER | 1.67e-03 | 2.80e-01 | 0.0528 |
| 51272 | BET1L | HTA11_7663_2000001011 | Human | Colorectum | SER | 1.45e-02 | 2.68e-01 | 0.0131 |
| 51272 | BET1L | HTA11_10711_2000001011 | Human | Colorectum | AD | 1.96e-02 | 2.27e-01 | 0.0338 |
| 51272 | BET1L | HTA11_7696_3000711011 | Human | Colorectum | AD | 4.33e-09 | 2.85e-01 | 0.0674 |
| 51272 | BET1L | HTA11_99999970781_79442 | Human | Colorectum | MSS | 1.07e-07 | 2.82e-01 | 0.294 |
| 51272 | BET1L | HTA11_99999965104_69814 | Human | Colorectum | MSS | 4.22e-08 | 3.62e-01 | 0.281 |
| 51272 | BET1L | HTA11_99999971662_82457 | Human | Colorectum | MSS | 1.12e-22 | 5.99e-01 | 0.3859 |
| 51272 | BET1L | HTA11_99999973899_84307 | Human | Colorectum | MSS | 2.45e-06 | 3.81e-01 | 0.2585 |
| 51272 | BET1L | HTA11_99999974143_84620 | Human | Colorectum | MSS | 1.15e-08 | 3.05e-01 | 0.3005 |
| Page: 1 2 3 4 5 6 |
| Tissue | Expression Dynamics | Abbreviation |
| Colorectum (GSE201348) |  | FAP: Familial adenomatous polyposis |
| CRC: Colorectal cancer | ||
| Colorectum (HTA11) |  | AD: Adenomas |
| SER: Sessile serrated lesions | ||
| MSI-H: Microsatellite-high colorectal cancer | ||
| MSS: Microsatellite stable colorectal cancer | ||
| Esophagus |  | ESCC: Esophageal squamous cell carcinoma |
| HGIN: High-grade intraepithelial neoplasias | ||
| LGIN: Low-grade intraepithelial neoplasias | ||
| Liver | 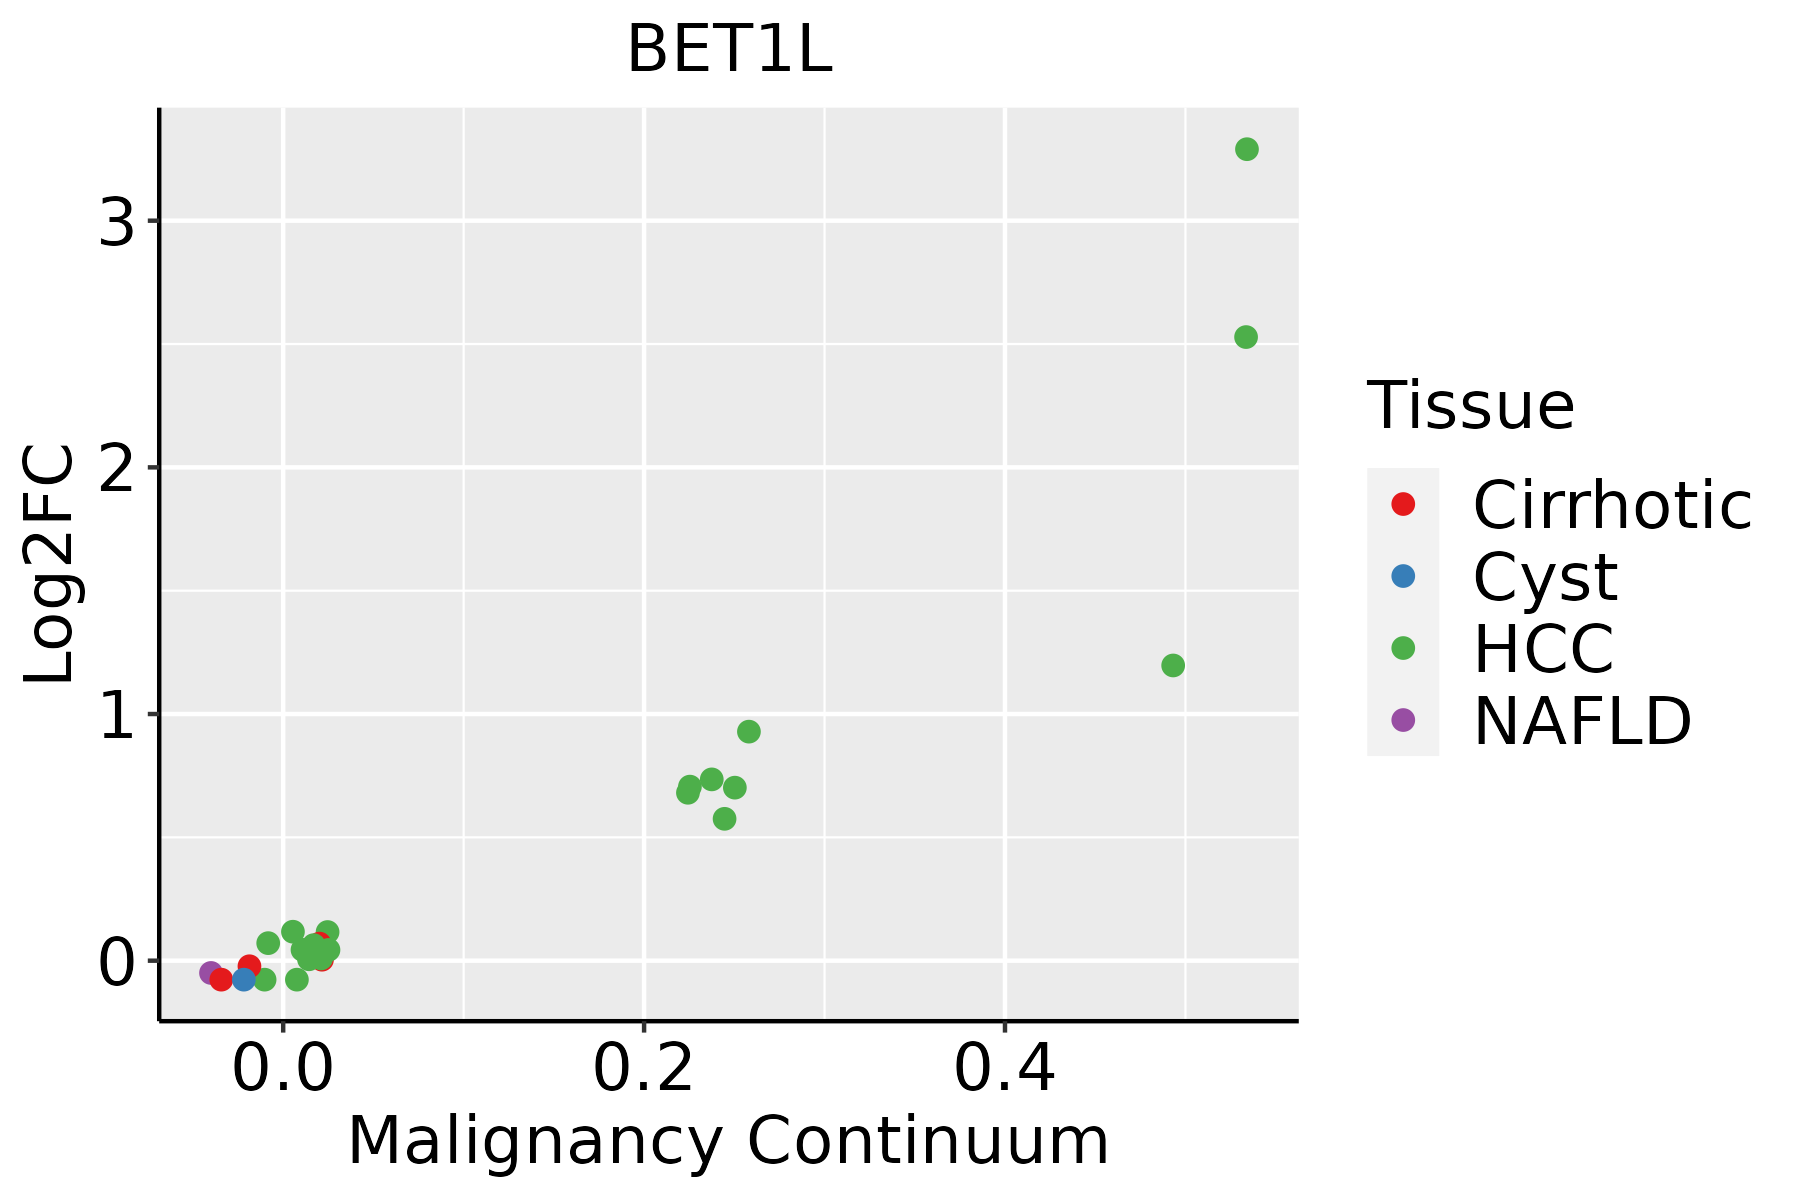 | HCC: Hepatocellular carcinoma |
| NAFLD: Non-alcoholic fatty liver disease | ||
| Oral Cavity | 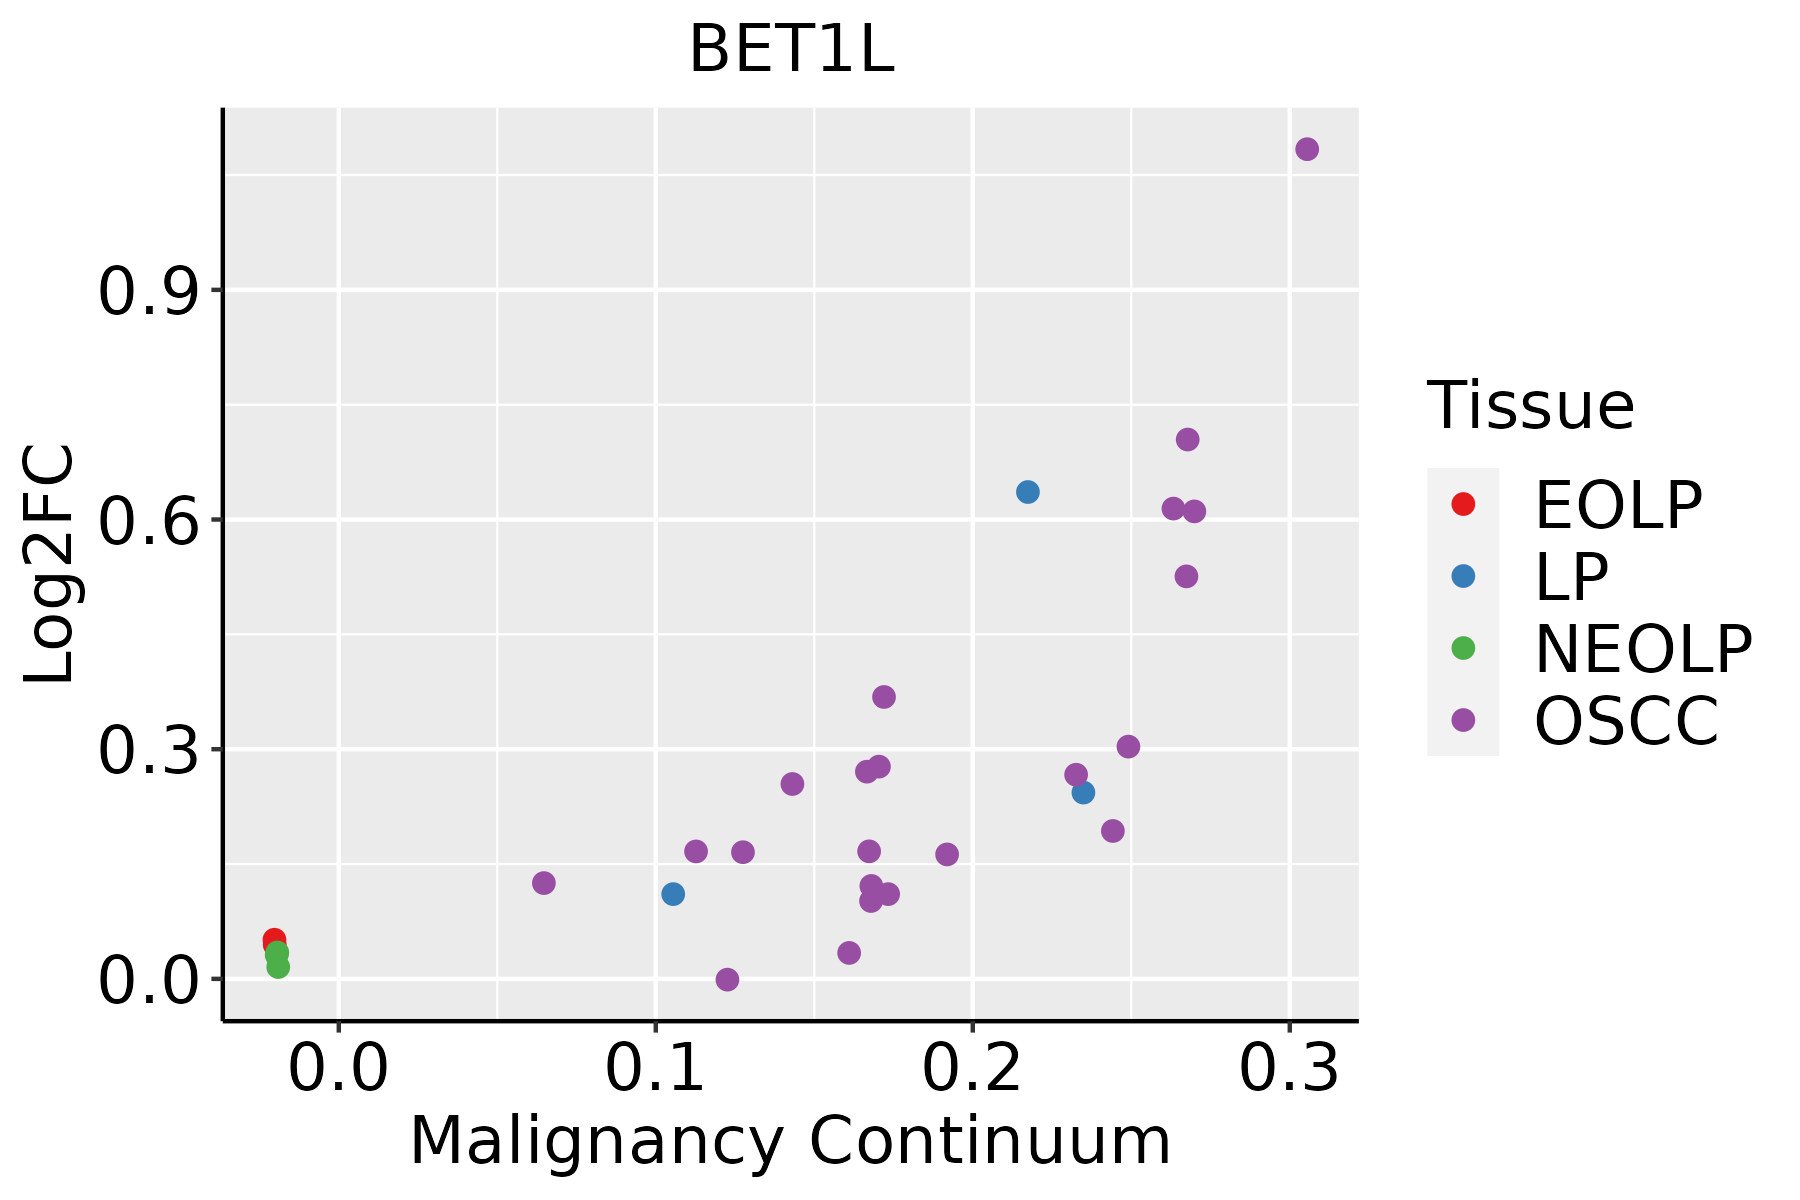 | EOLP: Erosive Oral lichen planus |
| LP: leukoplakia | ||
| NEOLP: Non-erosive oral lichen planus | ||
| OSCC: Oral squamous cell carcinoma |
| ∗log2FC in expression of this searched gene in stem-like cells from each diseased tissue sample relative to stem-like cells in normal samples in each tissue plotted against the malignancy continuum. Samples are colored based on if they are from different disease stage. |
Top |
Malignant transformation related pathway analysis |
| Find out the enriched GO biological processes and KEGG pathways involved in transition from healthy to precancer to cancer |
| Tissue | Disease Stage | Enriched GO biological Processes |
| Colorectum | AD |  |
| Colorectum | SER |  |
| Colorectum | MSS |  |
| Colorectum | MSI-H |  |
| Colorectum | FAP |  |
| ∗Top 15 enriched GO BP terms are showed in the bar plot of each disease state in each tissue. Each row represents a significant GO biological process which is colored according to the -log10(p.adjust). |
| Page: 1 2 3 4 5 6 7 8 9 |
| GO ID | Tissue | Disease Stage | Description | Gene Ratio | Bg Ratio | pvalue | p.adjust | Count |
| GO:0048193 | Colorectum | AD | Golgi vesicle transport | 109/3918 | 296/18723 | 1.80e-10 | 1.68e-08 | 109 |
| GO:0016197 | Colorectum | AD | endosomal transport | 90/3918 | 230/18723 | 1.88e-10 | 1.73e-08 | 90 |
| GO:0016482 | Colorectum | AD | cytosolic transport | 68/3918 | 168/18723 | 6.00e-09 | 3.72e-07 | 68 |
| GO:0006890 | Colorectum | AD | retrograde vesicle-mediated transport, Golgi to endoplasmic reticulum | 27/3918 | 52/18723 | 7.67e-07 | 2.70e-05 | 27 |
| GO:0042147 | Colorectum | AD | retrograde transport, endosome to Golgi | 37/3918 | 91/18723 | 1.46e-05 | 3.14e-04 | 37 |
| GO:00481931 | Colorectum | SER | Golgi vesicle transport | 79/2897 | 296/18723 | 4.20e-07 | 2.15e-05 | 79 |
| GO:00161971 | Colorectum | SER | endosomal transport | 61/2897 | 230/18723 | 1.03e-05 | 3.35e-04 | 61 |
| GO:00068901 | Colorectum | SER | retrograde vesicle-mediated transport, Golgi to endoplasmic reticulum | 20/2897 | 52/18723 | 4.80e-05 | 1.18e-03 | 20 |
| GO:00164821 | Colorectum | SER | cytosolic transport | 46/2897 | 168/18723 | 5.20e-05 | 1.25e-03 | 46 |
| GO:00481932 | Colorectum | MSS | Golgi vesicle transport | 101/3467 | 296/18723 | 9.09e-11 | 9.77e-09 | 101 |
| GO:00161972 | Colorectum | MSS | endosomal transport | 79/3467 | 230/18723 | 7.04e-09 | 4.39e-07 | 79 |
| GO:00164822 | Colorectum | MSS | cytosolic transport | 59/3467 | 168/18723 | 2.29e-07 | 9.79e-06 | 59 |
| GO:00068902 | Colorectum | MSS | retrograde vesicle-mediated transport, Golgi to endoplasmic reticulum | 26/3467 | 52/18723 | 2.66e-07 | 1.10e-05 | 26 |
| GO:00421471 | Colorectum | MSS | retrograde transport, endosome to Golgi | 33/3467 | 91/18723 | 4.78e-05 | 8.71e-04 | 33 |
| GO:004819318 | Esophagus | ESCC | Golgi vesicle transport | 231/8552 | 296/18723 | 1.82e-30 | 9.63e-28 | 231 |
| GO:001619715 | Esophagus | ESCC | endosomal transport | 168/8552 | 230/18723 | 2.28e-17 | 1.93e-15 | 168 |
| GO:001648210 | Esophagus | ESCC | cytosolic transport | 124/8552 | 168/18723 | 9.69e-14 | 4.69e-12 | 124 |
| GO:000689017 | Esophagus | ESCC | retrograde vesicle-mediated transport, Golgi to endoplasmic reticulum | 46/8552 | 52/18723 | 1.23e-10 | 3.66e-09 | 46 |
| GO:00421477 | Esophagus | ESCC | retrograde transport, endosome to Golgi | 63/8552 | 91/18723 | 4.58e-06 | 4.87e-05 | 63 |
| GO:00610254 | Esophagus | ESCC | membrane fusion | 98/8552 | 163/18723 | 1.39e-04 | 9.41e-04 | 98 |
| Page: 1 2 |
| Pathway ID | Tissue | Disease Stage | Description | Gene Ratio | Bg Ratio | pvalue | p.adjust | qvalue | Count |
| hsa041305 | Esophagus | ESCC | SNARE interactions in vesicular transport | 28/4205 | 33/8465 | 2.75e-05 | 1.32e-04 | 6.75e-05 | 28 |
| hsa0413012 | Esophagus | ESCC | SNARE interactions in vesicular transport | 28/4205 | 33/8465 | 2.75e-05 | 1.32e-04 | 6.75e-05 | 28 |
| hsa041302 | Liver | HCC | SNARE interactions in vesicular transport | 25/4020 | 33/8465 | 8.78e-04 | 3.38e-03 | 1.88e-03 | 25 |
| hsa041303 | Liver | HCC | SNARE interactions in vesicular transport | 25/4020 | 33/8465 | 8.78e-04 | 3.38e-03 | 1.88e-03 | 25 |
| hsa041304 | Oral cavity | OSCC | SNARE interactions in vesicular transport | 28/3704 | 33/8465 | 1.31e-06 | 7.18e-06 | 3.66e-06 | 28 |
| hsa0413011 | Oral cavity | OSCC | SNARE interactions in vesicular transport | 28/3704 | 33/8465 | 1.31e-06 | 7.18e-06 | 3.66e-06 | 28 |
| hsa0413021 | Oral cavity | LP | SNARE interactions in vesicular transport | 22/2418 | 33/8465 | 6.00e-06 | 4.76e-05 | 3.07e-05 | 22 |
| hsa0413031 | Oral cavity | LP | SNARE interactions in vesicular transport | 22/2418 | 33/8465 | 6.00e-06 | 4.76e-05 | 3.07e-05 | 22 |
| Page: 1 |
Top |
Cell-cell communication analysis |
| Identification of potential cell-cell interactions between two cell types and their ligand-receptor pairs for different disease states |
| Ligand | Receptor | LRpair | Pathway | Tissue | Disease Stage |
| Page: 1 |
Top |
Single-cell gene regulatory network inference analysis |
| Find out the significant the regulons (TFs) and the target genes of each regulon across cell types for different disease states |
| TF | Cell Type | Tissue | Disease Stage | Target Gene | RSS | Regulon Activity |
| ∗The dot plots of a searched regulon are shown for all cell subpopulations in each disease state of each tissue based on the regulon specific score inferred using pySCENIC and by calculating the average expression. |
| Page: 1 |
Top |
Somatic mutation of malignant transformation related genes |
| Annotation of somatic variants for genes involved in malignant transformation |
| Hugo Symbol | Variant Class | Variant Classification | dbSNP RS | HGVSc | HGVSp | HGVSp Short | SWISSPROT | BIOTYPE | SIFT | PolyPhen | Tumor Sample Barcode | Tissue | Histology | Sex | Age | Stage | Therapy Types | Drugs | Outcome |
| BET1L | SNV | Missense_Mutation | rs201986208 | c.241N>A | p.Gly81Arg | p.G81R | Q9NYM9 | protein_coding | deleterious(0.04) | possibly_damaging(0.659) | TCGA-CM-6162-01 | Colorectum | colon adenocarcinoma | Female | <65 | III/IV | Chemotherapy | oxaliplatin | SD |
| BET1L | SNV | Missense_Mutation | novel | c.112N>T | p.Leu38Phe | p.L38F | Q9NYM9 | protein_coding | deleterious(0.03) | possibly_damaging(0.754) | TCGA-G4-6304-01 | Colorectum | colon adenocarcinoma | Female | >=65 | I/II | Chemotherapy | fluorouracil | PD |
| BET1L | SNV | Missense_Mutation | rs537981172 | c.127G>A | p.Asp43Asn | p.D43N | Q9NYM9 | protein_coding | tolerated(0.06) | possibly_damaging(0.837) | TCGA-AP-A0LM-01 | Endometrium | uterine corpus endometrioid carcinoma | Female | <65 | III/IV | Chemotherapy | cisplatin | SD |
| BET1L | SNV | Missense_Mutation | rs779024831 | c.253C>T | p.Arg85Trp | p.R85W | Q9NYM9 | protein_coding | deleterious(0) | probably_damaging(0.997) | TCGA-D1-A103-01 | Endometrium | uterine corpus endometrioid carcinoma | Female | >=65 | I/II | Unknown | Unknown | SD |
| BET1L | SNV | Missense_Mutation | novel | c.247N>T | p.Asp83Tyr | p.D83Y | Q9NYM9 | protein_coding | deleterious(0.02) | possibly_damaging(0.453) | TCGA-EO-A22R-01 | Endometrium | uterine corpus endometrioid carcinoma | Female | <65 | I/II | Unknown | Unknown | SD |
| BET1L | SNV | Missense_Mutation | c.231N>T | p.Met77Ile | p.M77I | Q9NYM9 | protein_coding | tolerated(0.06) | benign(0.021) | TCGA-49-AAR2-01 | Lung | lung adenocarcinoma | Male | <65 | I/II | Chemotherapy | taxol | CR | |
| BET1L | SNV | Missense_Mutation | rs373427261 | c.217C>T | p.Arg73Cys | p.R73C | Q9NYM9 | protein_coding | deleterious(0) | probably_damaging(1) | TCGA-HU-A4H3-01 | Stomach | stomach adenocarcinoma | Female | <65 | III/IV | Chemotherapy | ts-1 | PD |
| BET1L | SNV | Missense_Mutation | novel | c.56G>T | p.Arg19Leu | p.R19L | Q9NYM9 | protein_coding | tolerated(0.3) | benign(0.007) | TCGA-E8-A2EA-01 | Thyroid | thyroid carcinoma | Female | <65 | I/II | Unknown | Unknown | SD |
| Page: 1 |
Top |
Related drugs of malignant transformation related genes |
| Identification of chemicals and drugs interact with genes involved in malignant transfromation |
| (DGIdb 4.0) |
| Entrez ID | Symbol | Category | Interaction Types | Drug Claim Name | Drug Name | PMIDs |
| Page: 1 |

Copyright 2023-Present -The University of Texas Health Science Center at Houston |