
|
|||||
|
 | |
| |
| |
| |
| |
| |
|
Gene: BET1 |
Gene summary for BET1 |
| Gene information | Species | Human | Gene symbol | BET1 | Gene ID | 10282 |
| Gene name | Bet1 golgi vesicular membrane trafficking protein | |
| Gene Alias | HBET1 | |
| Cytomap | 7q21.3 | |
| Gene Type | protein-coding | GO ID | GO:0006810 | UniProtAcc | O15155 |
Top |
Malignant transformation analysis |
| Identification of the aberrant gene expression in precancerous and cancerous lesions by comparing the gene expression of stem-like cells in diseased tissues with normal stem cells |
| Entrez ID | Symbol | Replicates | Species | Organ | Tissue | Adj P-value | Log2FC | Malignancy |
| 10282 | BET1 | LZE4T | Human | Esophagus | ESCC | 6.39e-12 | 2.94e-01 | 0.0811 |
| 10282 | BET1 | LZE5T | Human | Esophagus | ESCC | 4.09e-02 | 2.49e-01 | 0.0514 |
| 10282 | BET1 | LZE7T | Human | Esophagus | ESCC | 8.44e-03 | 9.06e-02 | 0.0667 |
| 10282 | BET1 | LZE8T | Human | Esophagus | ESCC | 1.38e-02 | 6.95e-02 | 0.067 |
| 10282 | BET1 | LZE20T | Human | Esophagus | ESCC | 1.53e-11 | 3.87e-01 | 0.0662 |
| 10282 | BET1 | LZE24T | Human | Esophagus | ESCC | 1.82e-18 | 4.42e-01 | 0.0596 |
| 10282 | BET1 | LZE6T | Human | Esophagus | ESCC | 1.03e-04 | 3.24e-01 | 0.0845 |
| 10282 | BET1 | P1T-E | Human | Esophagus | ESCC | 6.42e-12 | 5.97e-01 | 0.0875 |
| 10282 | BET1 | P2T-E | Human | Esophagus | ESCC | 1.17e-28 | 6.10e-01 | 0.1177 |
| 10282 | BET1 | P4T-E | Human | Esophagus | ESCC | 3.38e-32 | 6.91e-01 | 0.1323 |
| 10282 | BET1 | P5T-E | Human | Esophagus | ESCC | 1.92e-26 | 4.56e-01 | 0.1327 |
| 10282 | BET1 | P8T-E | Human | Esophagus | ESCC | 1.66e-29 | 3.99e-01 | 0.0889 |
| 10282 | BET1 | P9T-E | Human | Esophagus | ESCC | 1.13e-23 | 4.76e-01 | 0.1131 |
| 10282 | BET1 | P10T-E | Human | Esophagus | ESCC | 2.24e-32 | 4.46e-01 | 0.116 |
| 10282 | BET1 | P11T-E | Human | Esophagus | ESCC | 1.85e-20 | 1.11e+00 | 0.1426 |
| 10282 | BET1 | P12T-E | Human | Esophagus | ESCC | 2.97e-39 | 6.61e-01 | 0.1122 |
| 10282 | BET1 | P15T-E | Human | Esophagus | ESCC | 3.95e-24 | 5.84e-01 | 0.1149 |
| 10282 | BET1 | P16T-E | Human | Esophagus | ESCC | 3.09e-73 | 1.22e+00 | 0.1153 |
| 10282 | BET1 | P17T-E | Human | Esophagus | ESCC | 2.57e-20 | 9.59e-01 | 0.1278 |
| 10282 | BET1 | P19T-E | Human | Esophagus | ESCC | 5.12e-06 | 7.92e-01 | 0.1662 |
| Page: 1 2 3 4 5 6 |
| Tissue | Expression Dynamics | Abbreviation |
| Esophagus | 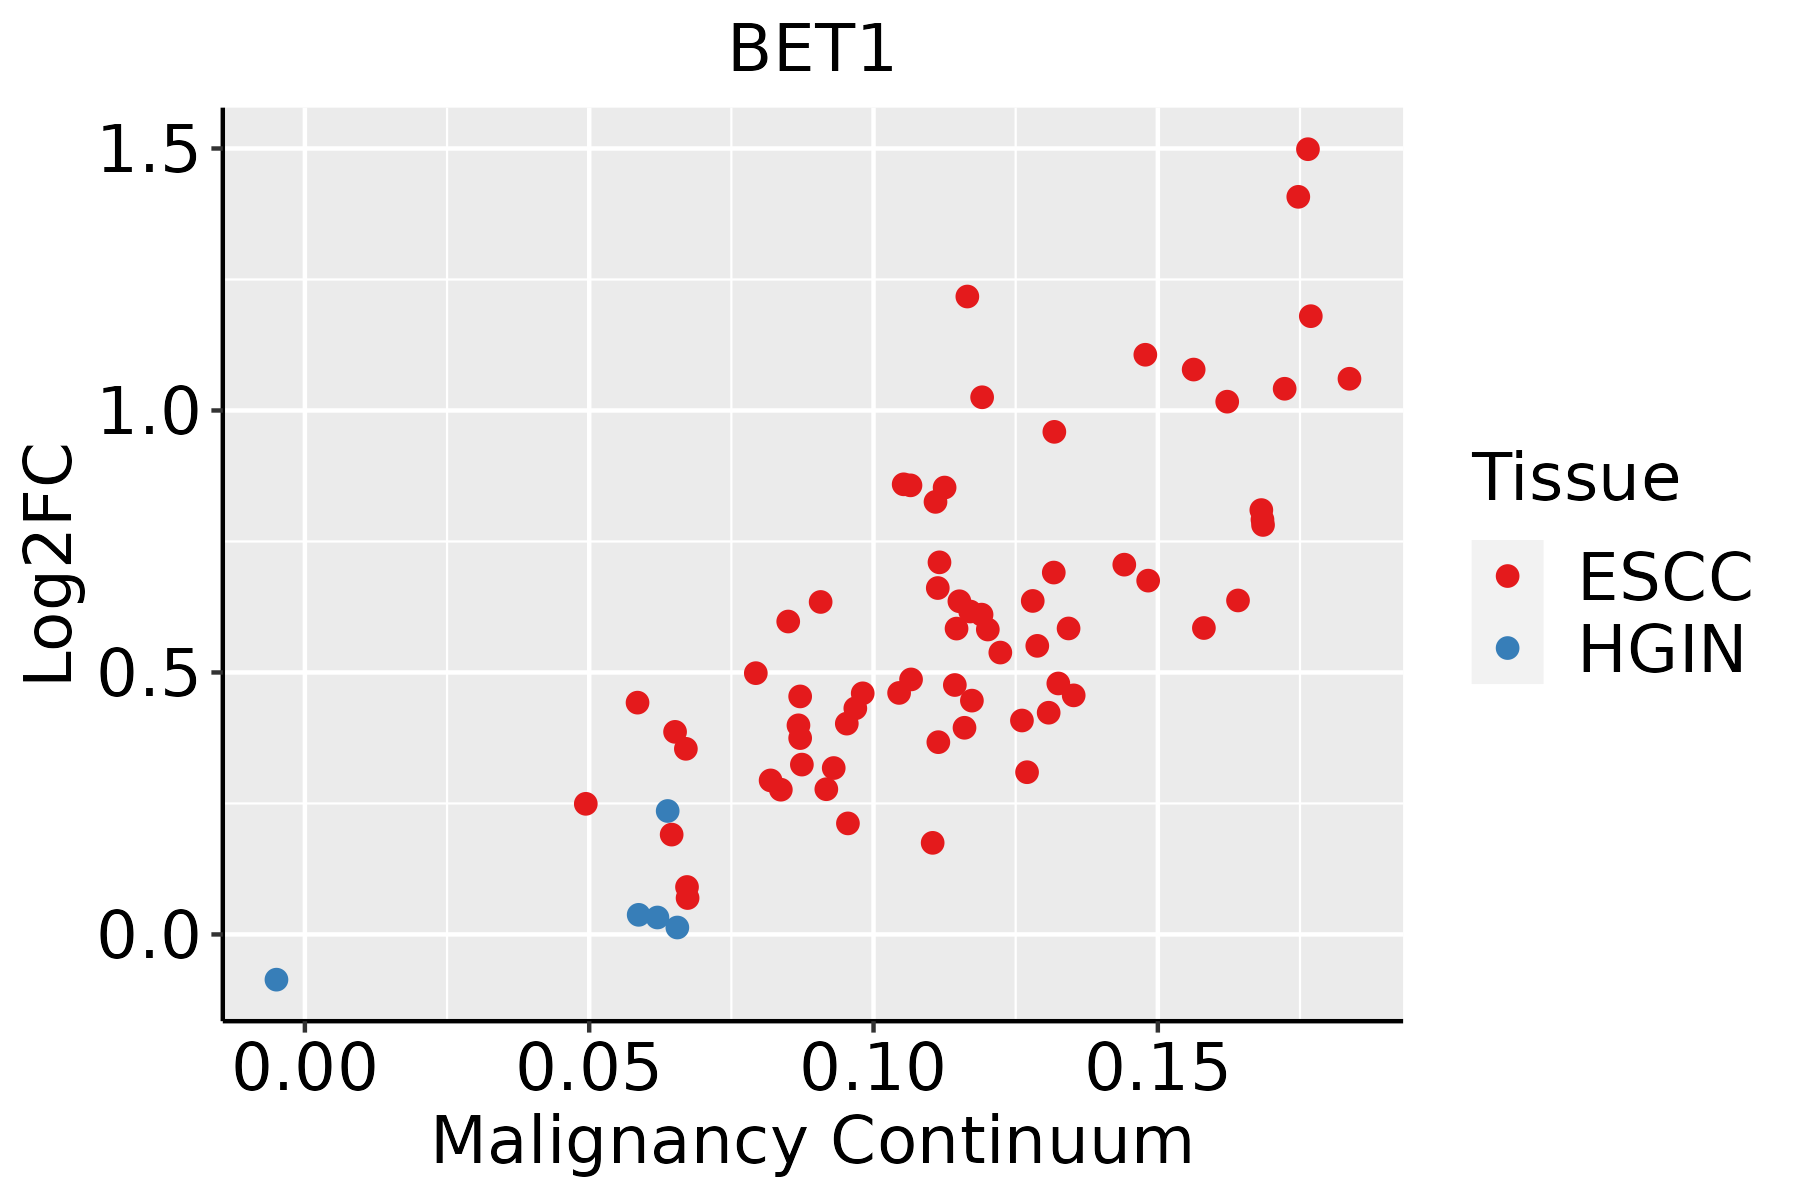 | ESCC: Esophageal squamous cell carcinoma |
| HGIN: High-grade intraepithelial neoplasias | ||
| LGIN: Low-grade intraepithelial neoplasias | ||
| Liver | 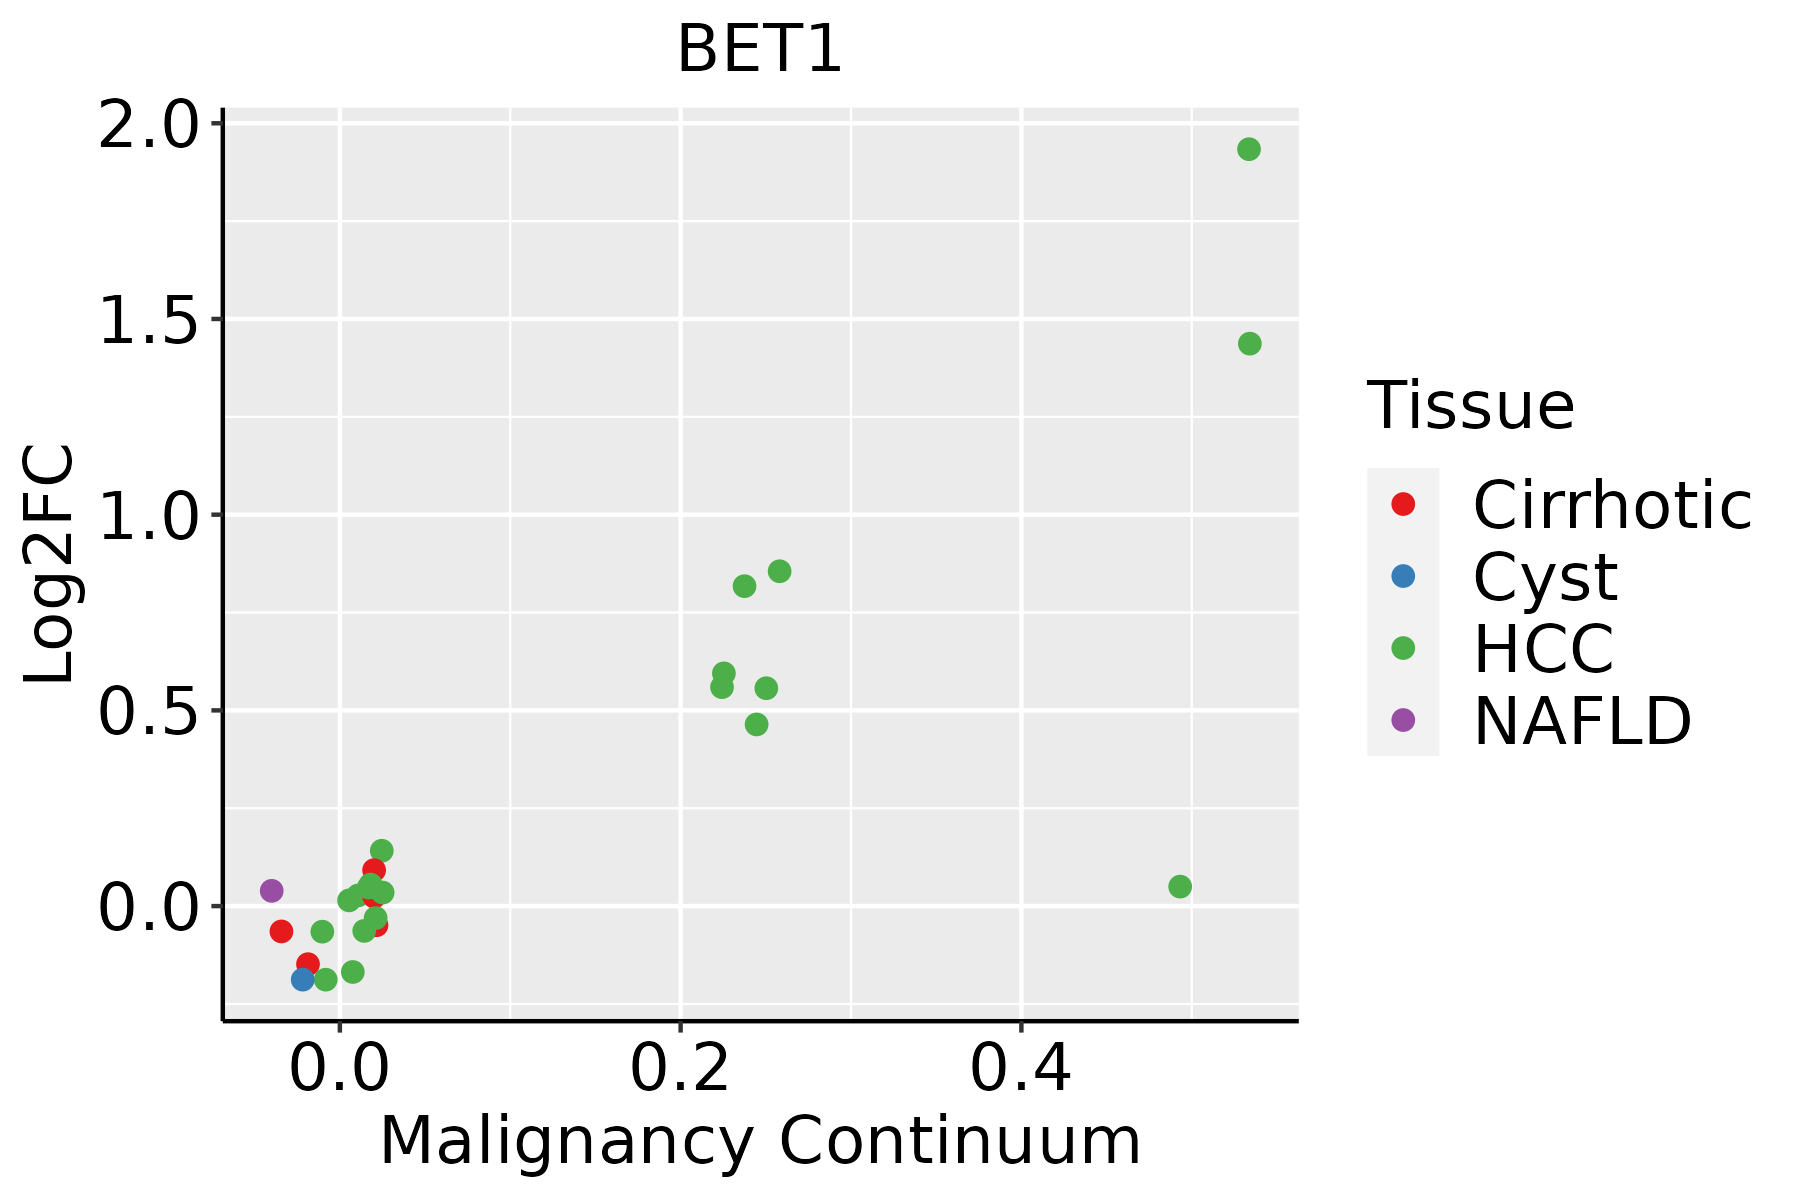 | HCC: Hepatocellular carcinoma |
| NAFLD: Non-alcoholic fatty liver disease | ||
| Oral Cavity | 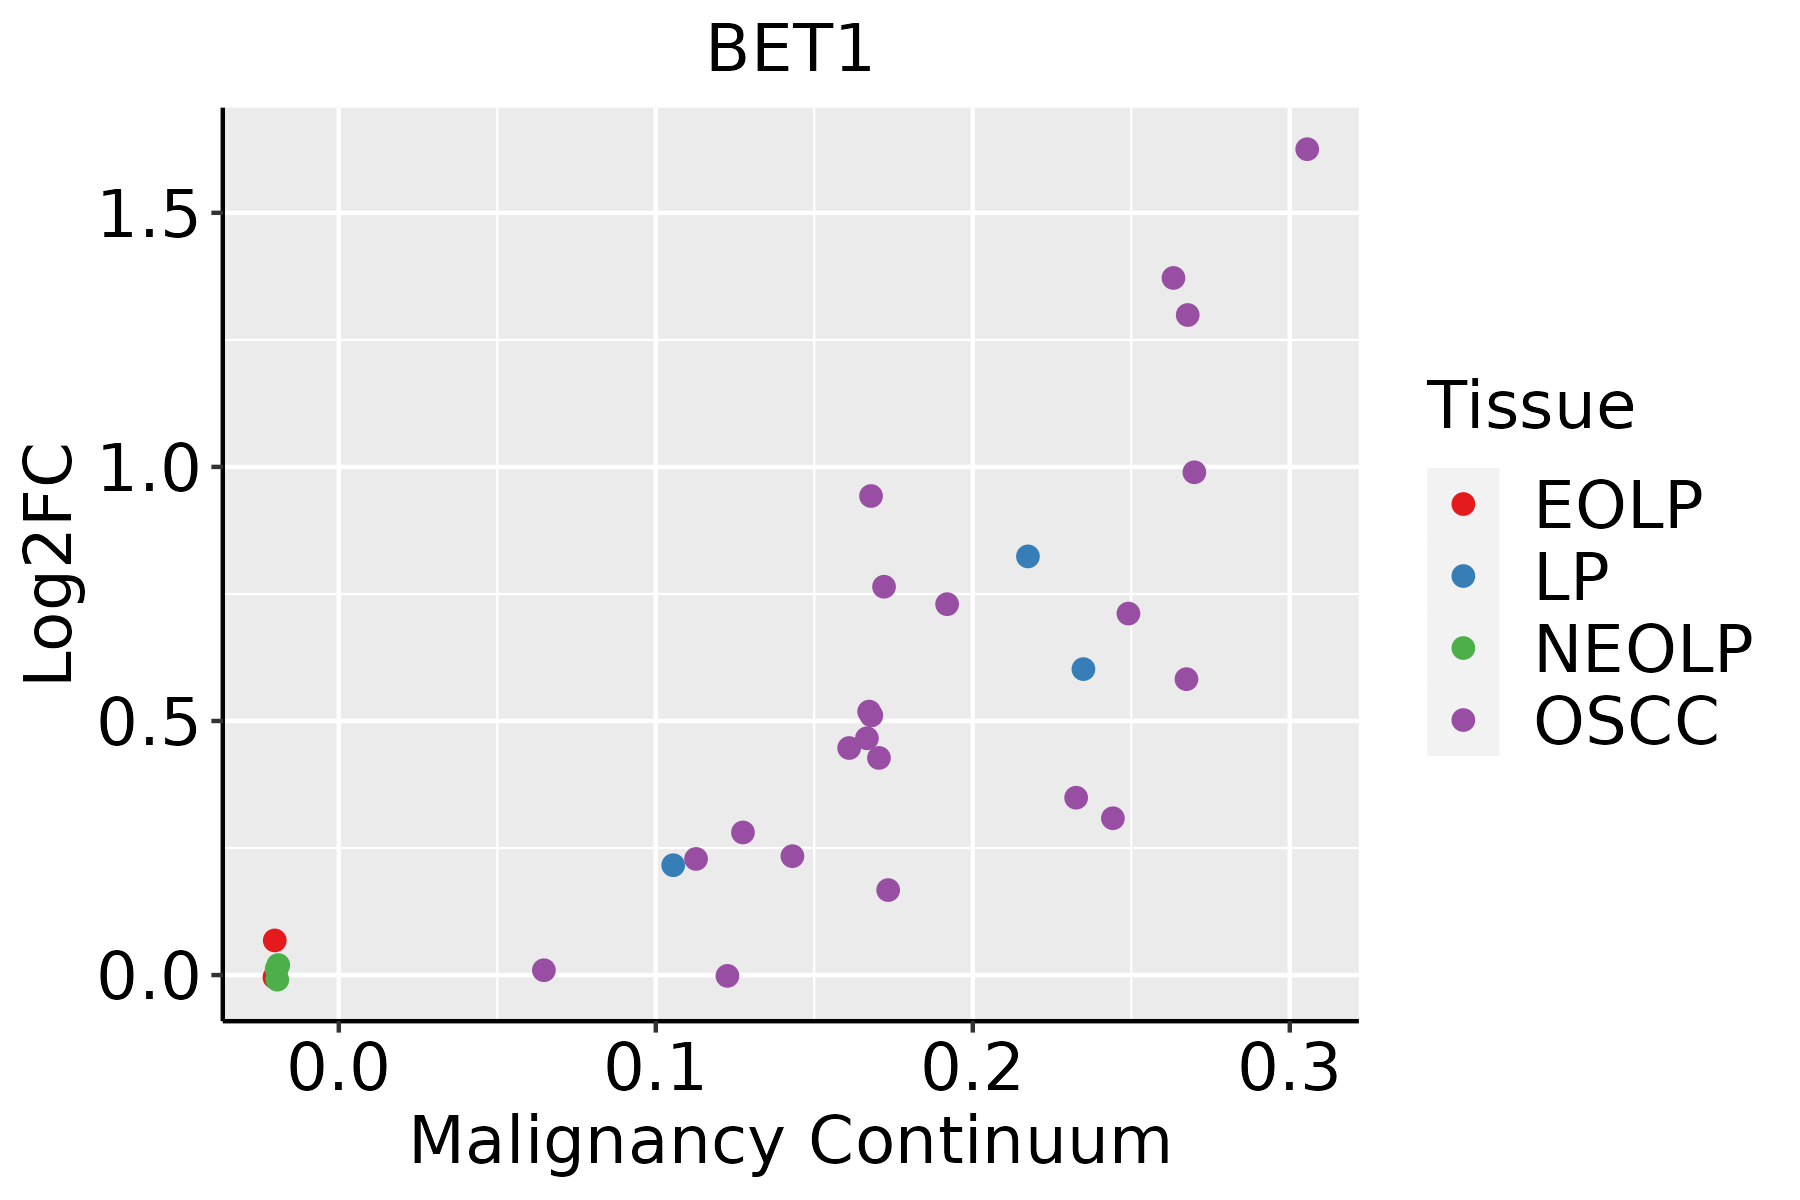 | EOLP: Erosive Oral lichen planus |
| LP: leukoplakia | ||
| NEOLP: Non-erosive oral lichen planus | ||
| OSCC: Oral squamous cell carcinoma | ||
| Prostate | 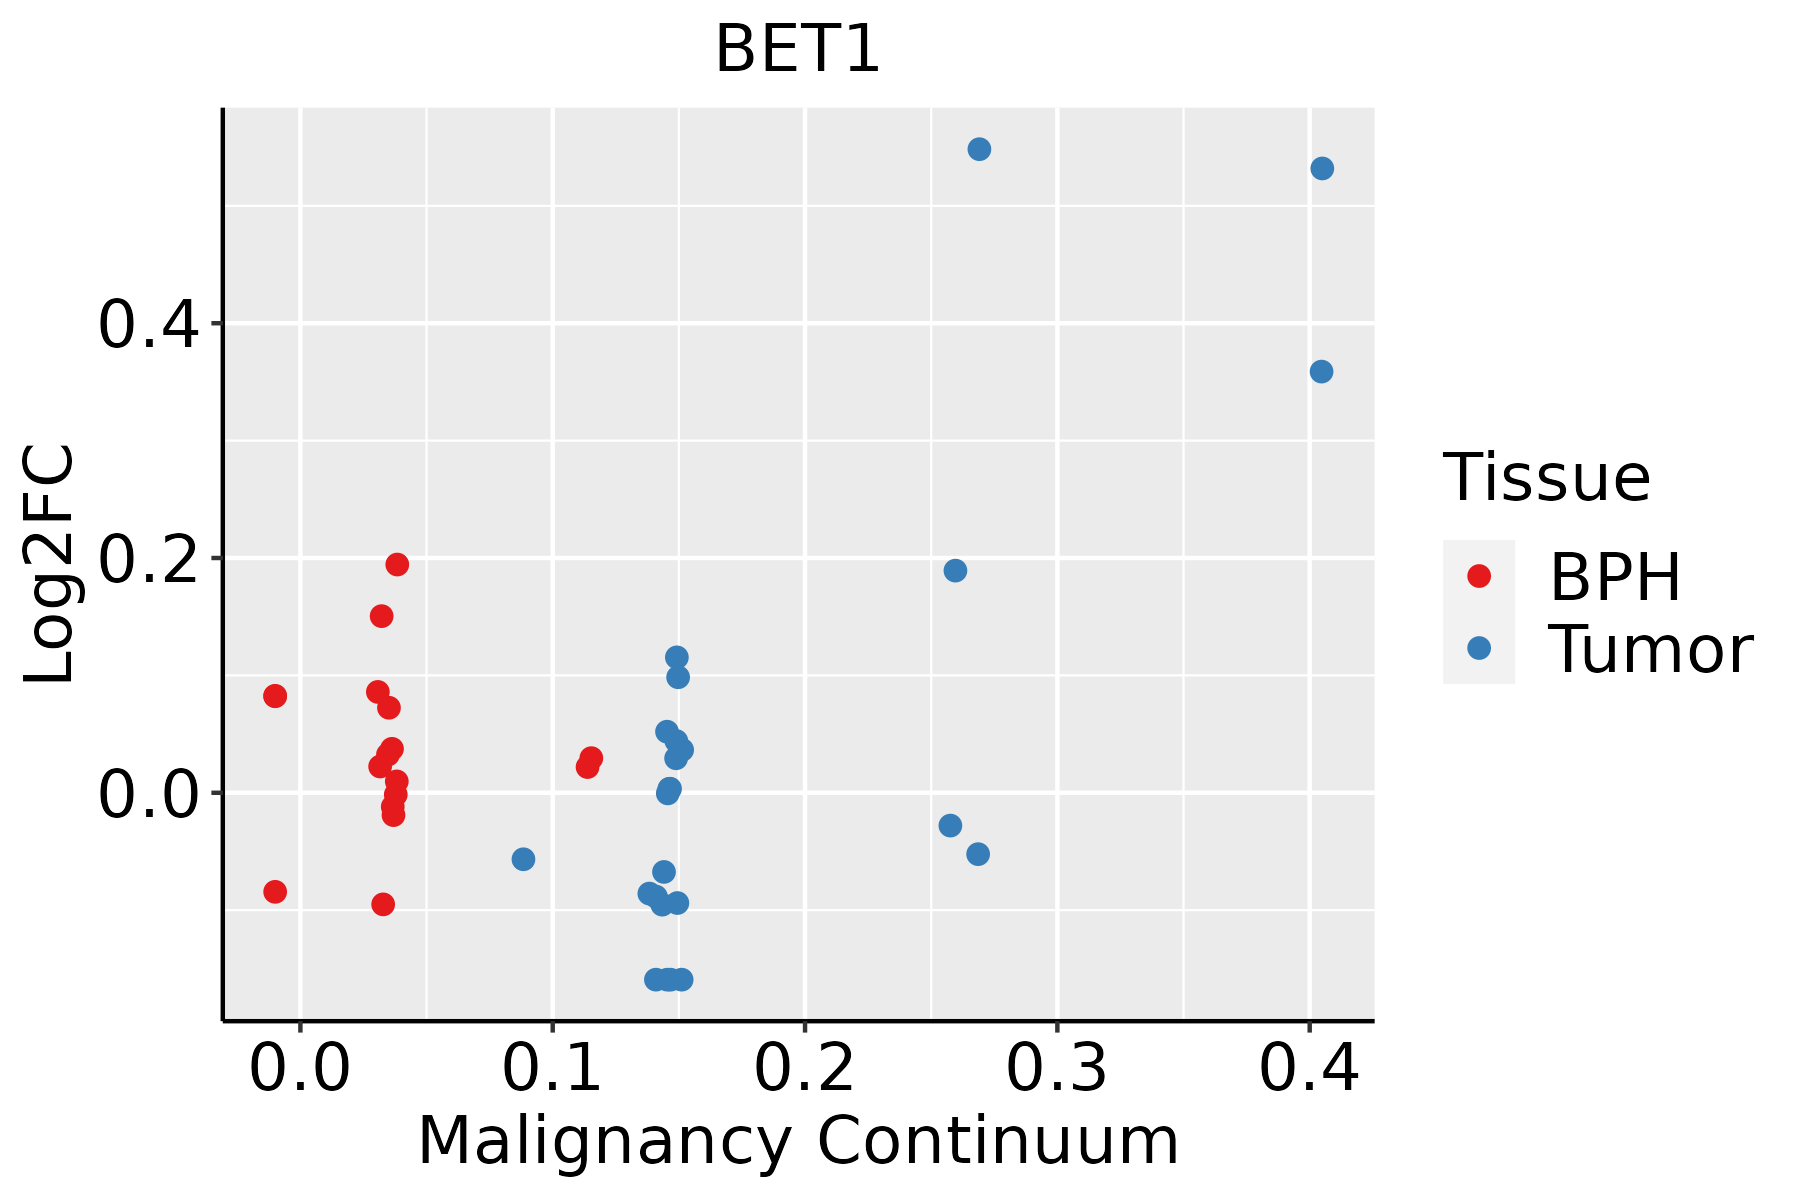 | BPH: Benign Prostatic Hyperplasia |
| Skin | 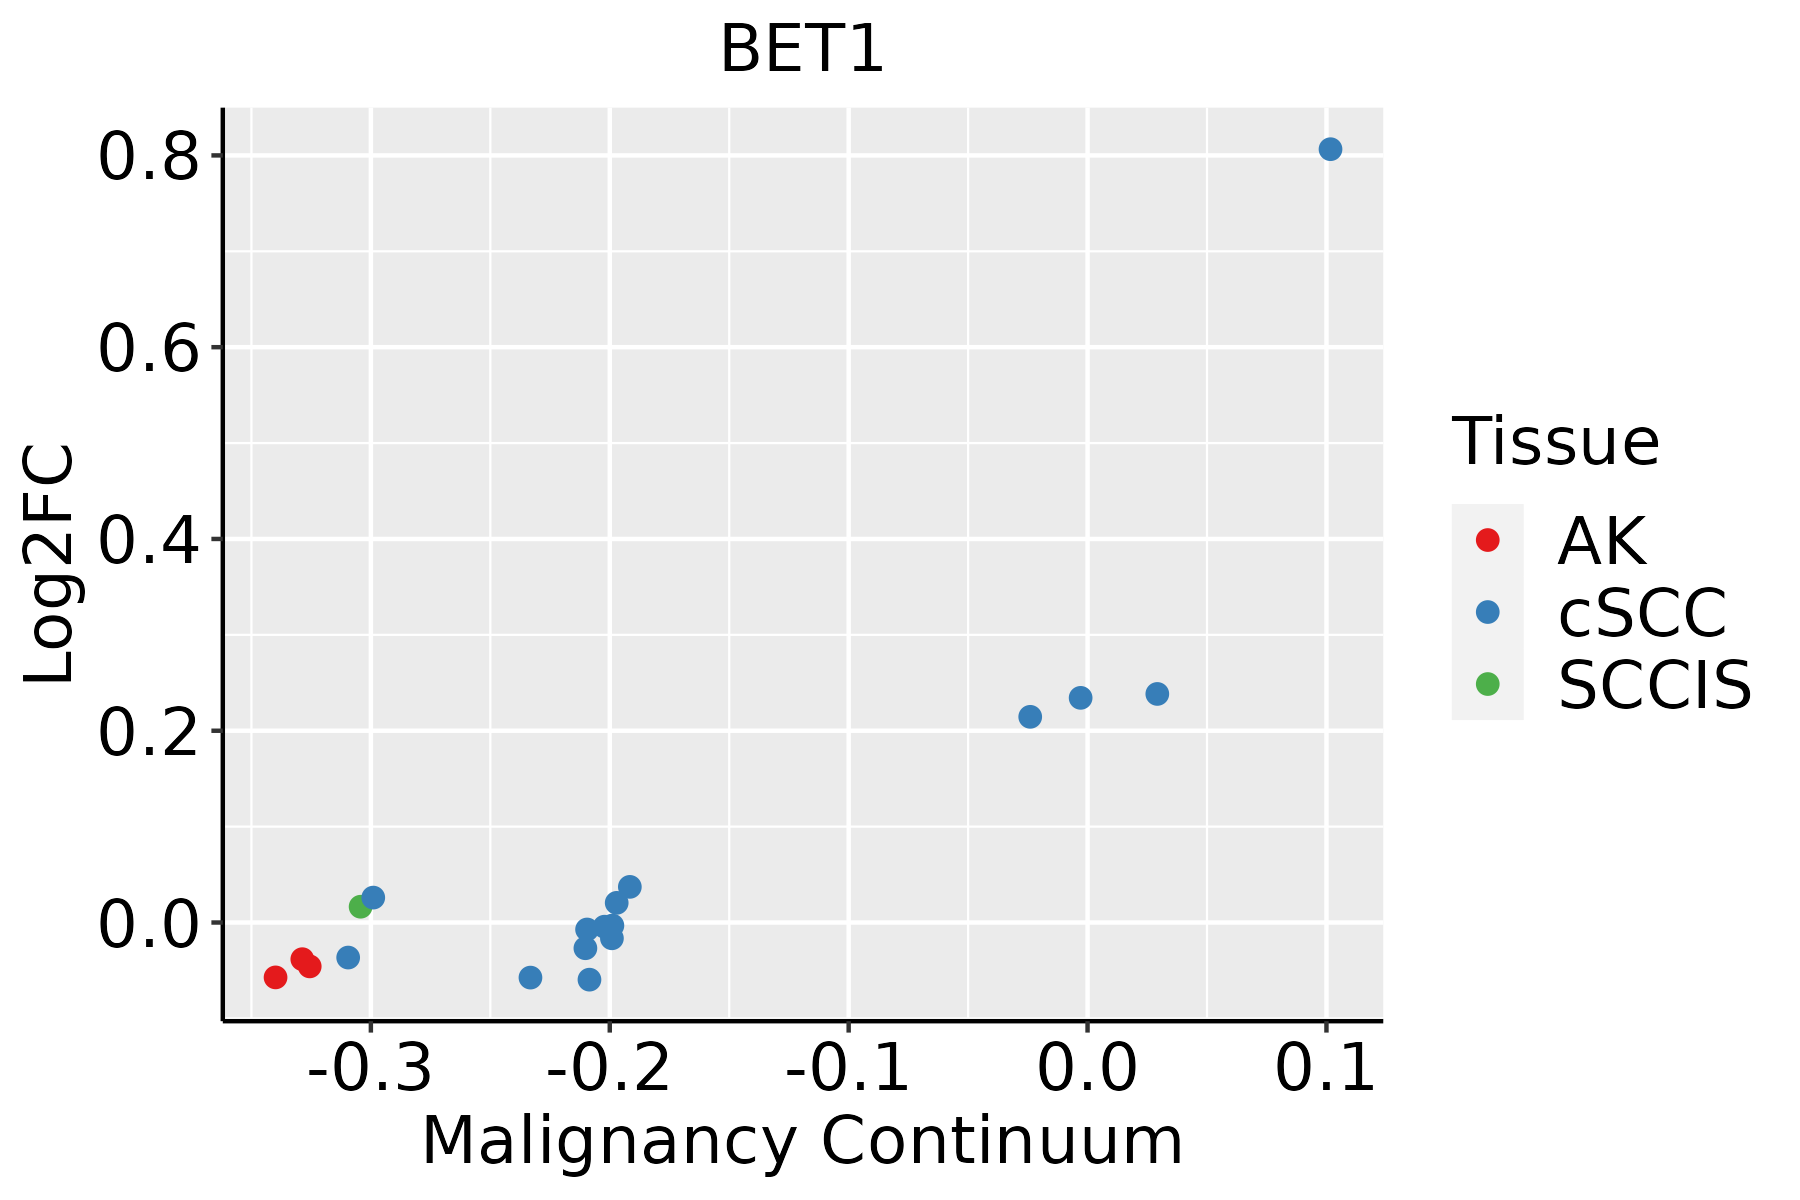 | AK: Actinic keratosis |
| cSCC: Cutaneous squamous cell carcinoma | ||
| SCCIS:squamous cell carcinoma in situ | ||
| Thyroid | 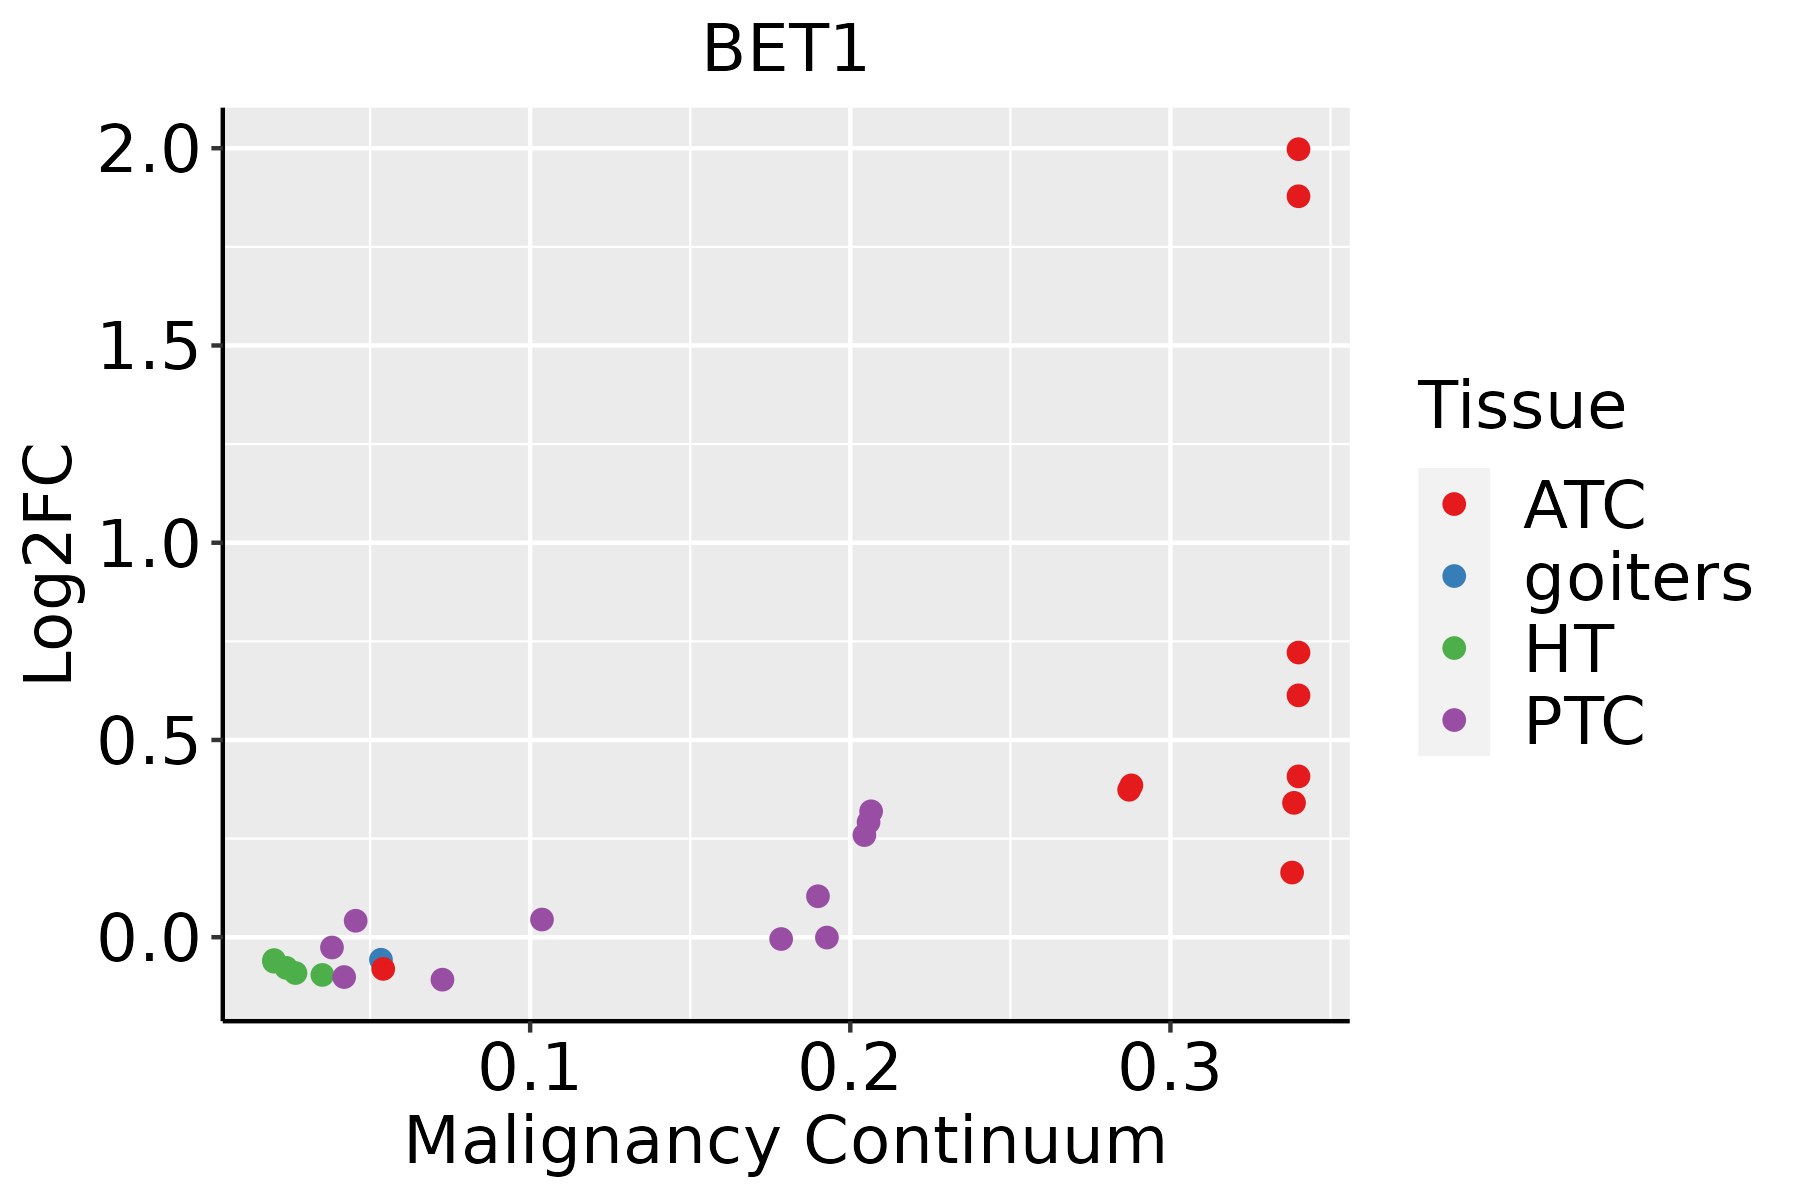 | ATC: Anaplastic thyroid cancer |
| HT: Hashimoto's thyroiditis | ||
| PTC: Papillary thyroid cancer |
| ∗log2FC in expression of this searched gene in stem-like cells from each diseased tissue sample relative to stem-like cells in normal samples in each tissue plotted against the malignancy continuum. Samples are colored based on if they are from different disease stage. |
Top |
Malignant transformation related pathway analysis |
| Find out the enriched GO biological processes and KEGG pathways involved in transition from healthy to precancer to cancer |
| Tissue | Disease Stage | Enriched GO biological Processes |
| Colorectum | AD |  |
| Colorectum | SER |  |
| Colorectum | MSS |  |
| Colorectum | MSI-H |  |
| Colorectum | FAP |  |
| ∗Top 15 enriched GO BP terms are showed in the bar plot of each disease state in each tissue. Each row represents a significant GO biological process which is colored according to the -log10(p.adjust). |
| Page: 1 2 3 4 5 6 7 8 9 |
| GO ID | Tissue | Disease Stage | Description | Gene Ratio | Bg Ratio | pvalue | p.adjust | Count |
| GO:0048193 | Colorectum | AD | Golgi vesicle transport | 109/3918 | 296/18723 | 1.80e-10 | 1.68e-08 | 109 |
| GO:0016197 | Colorectum | AD | endosomal transport | 90/3918 | 230/18723 | 1.88e-10 | 1.73e-08 | 90 |
| GO:0016482 | Colorectum | AD | cytosolic transport | 68/3918 | 168/18723 | 6.00e-09 | 3.72e-07 | 68 |
| GO:0006890 | Colorectum | AD | retrograde vesicle-mediated transport, Golgi to endoplasmic reticulum | 27/3918 | 52/18723 | 7.67e-07 | 2.70e-05 | 27 |
| GO:0042147 | Colorectum | AD | retrograde transport, endosome to Golgi | 37/3918 | 91/18723 | 1.46e-05 | 3.14e-04 | 37 |
| GO:00481931 | Colorectum | SER | Golgi vesicle transport | 79/2897 | 296/18723 | 4.20e-07 | 2.15e-05 | 79 |
| GO:00161971 | Colorectum | SER | endosomal transport | 61/2897 | 230/18723 | 1.03e-05 | 3.35e-04 | 61 |
| GO:00068901 | Colorectum | SER | retrograde vesicle-mediated transport, Golgi to endoplasmic reticulum | 20/2897 | 52/18723 | 4.80e-05 | 1.18e-03 | 20 |
| GO:00164821 | Colorectum | SER | cytosolic transport | 46/2897 | 168/18723 | 5.20e-05 | 1.25e-03 | 46 |
| GO:00481932 | Colorectum | MSS | Golgi vesicle transport | 101/3467 | 296/18723 | 9.09e-11 | 9.77e-09 | 101 |
| GO:00161972 | Colorectum | MSS | endosomal transport | 79/3467 | 230/18723 | 7.04e-09 | 4.39e-07 | 79 |
| GO:00164822 | Colorectum | MSS | cytosolic transport | 59/3467 | 168/18723 | 2.29e-07 | 9.79e-06 | 59 |
| GO:00068902 | Colorectum | MSS | retrograde vesicle-mediated transport, Golgi to endoplasmic reticulum | 26/3467 | 52/18723 | 2.66e-07 | 1.10e-05 | 26 |
| GO:00421471 | Colorectum | MSS | retrograde transport, endosome to Golgi | 33/3467 | 91/18723 | 4.78e-05 | 8.71e-04 | 33 |
| GO:004819318 | Esophagus | ESCC | Golgi vesicle transport | 231/8552 | 296/18723 | 1.82e-30 | 9.63e-28 | 231 |
| GO:001605014 | Esophagus | ESCC | vesicle organization | 211/8552 | 300/18723 | 2.85e-18 | 2.87e-16 | 211 |
| GO:001619715 | Esophagus | ESCC | endosomal transport | 168/8552 | 230/18723 | 2.28e-17 | 1.93e-15 | 168 |
| GO:000688815 | Esophagus | ESCC | endoplasmic reticulum to Golgi vesicle-mediated transport | 102/8552 | 130/18723 | 1.73e-14 | 9.22e-13 | 102 |
| GO:001648210 | Esophagus | ESCC | cytosolic transport | 124/8552 | 168/18723 | 9.69e-14 | 4.69e-12 | 124 |
| GO:000689017 | Esophagus | ESCC | retrograde vesicle-mediated transport, Golgi to endoplasmic reticulum | 46/8552 | 52/18723 | 1.23e-10 | 3.66e-09 | 46 |
| Page: 1 2 3 4 5 6 |
| Pathway ID | Tissue | Disease Stage | Description | Gene Ratio | Bg Ratio | pvalue | p.adjust | qvalue | Count |
| hsa041305 | Esophagus | ESCC | SNARE interactions in vesicular transport | 28/4205 | 33/8465 | 2.75e-05 | 1.32e-04 | 6.75e-05 | 28 |
| hsa0413012 | Esophagus | ESCC | SNARE interactions in vesicular transport | 28/4205 | 33/8465 | 2.75e-05 | 1.32e-04 | 6.75e-05 | 28 |
| hsa04130 | Liver | Cirrhotic | SNARE interactions in vesicular transport | 18/2530 | 33/8465 | 2.64e-03 | 1.10e-02 | 6.76e-03 | 18 |
| hsa041301 | Liver | Cirrhotic | SNARE interactions in vesicular transport | 18/2530 | 33/8465 | 2.64e-03 | 1.10e-02 | 6.76e-03 | 18 |
| hsa041302 | Liver | HCC | SNARE interactions in vesicular transport | 25/4020 | 33/8465 | 8.78e-04 | 3.38e-03 | 1.88e-03 | 25 |
| hsa041303 | Liver | HCC | SNARE interactions in vesicular transport | 25/4020 | 33/8465 | 8.78e-04 | 3.38e-03 | 1.88e-03 | 25 |
| Page: 1 |
Top |
Cell-cell communication analysis |
| Identification of potential cell-cell interactions between two cell types and their ligand-receptor pairs for different disease states |
| Ligand | Receptor | LRpair | Pathway | Tissue | Disease Stage |
| Page: 1 |
Top |
Single-cell gene regulatory network inference analysis |
| Find out the significant the regulons (TFs) and the target genes of each regulon across cell types for different disease states |
| TF | Cell Type | Tissue | Disease Stage | Target Gene | RSS | Regulon Activity |
| ∗The dot plots of a searched regulon are shown for all cell subpopulations in each disease state of each tissue based on the regulon specific score inferred using pySCENIC and by calculating the average expression. |
| Page: 1 |
Top |
Somatic mutation of malignant transformation related genes |
| Annotation of somatic variants for genes involved in malignant transformation |
| Hugo Symbol | Variant Class | Variant Classification | dbSNP RS | HGVSc | HGVSp | HGVSp Short | SWISSPROT | BIOTYPE | SIFT | PolyPhen | Tumor Sample Barcode | Tissue | Histology | Sex | Age | Stage | Therapy Types | Drugs | Outcome |
| BET1 | SNV | Missense_Mutation | c.13N>T | p.Gly5Cys | p.G5C | O15155 | protein_coding | deleterious(0.01) | benign(0.286) | TCGA-AO-A128-01 | Breast | breast invasive carcinoma | Female | <65 | I/II | Chemotherapy | doxorubicin | SD | |
| BET1 | SNV | Missense_Mutation | novel | c.42N>A | p.Asn14Lys | p.N14K | O15155 | protein_coding | deleterious(0.04) | benign(0.007) | TCGA-A6-3809-01 | Colorectum | colon adenocarcinoma | Female | >=65 | I/II | Unknown | Unknown | SD |
| BET1 | SNV | Missense_Mutation | c.101G>T | p.Arg34Met | p.R34M | O15155 | protein_coding | deleterious(0) | probably_damaging(0.935) | TCGA-AA-3710-01 | Colorectum | colon adenocarcinoma | Female | >=65 | I/II | Unknown | Unknown | SD | |
| BET1 | SNV | Missense_Mutation | novel | c.311N>A | p.Ser104Tyr | p.S104Y | O15155 | protein_coding | deleterious(0) | possibly_damaging(0.547) | TCGA-AJ-A3EL-01 | Endometrium | uterine corpus endometrioid carcinoma | Female | <65 | I/II | Unknown | Unknown | SD |
| BET1 | SNV | Missense_Mutation | novel | c.258N>T | p.Lys86Asn | p.K86N | O15155 | protein_coding | tolerated(0.36) | benign(0.043) | TCGA-AJ-A5DW-01 | Endometrium | uterine corpus endometrioid carcinoma | Female | <65 | I/II | Unknown | Unknown | SD |
| BET1 | SNV | Missense_Mutation | c.202G>A | p.Asp68Asn | p.D68N | O15155 | protein_coding | tolerated(0.09) | benign(0.257) | TCGA-AX-A05Z-01 | Endometrium | uterine corpus endometrioid carcinoma | Female | <65 | III/IV | Chemotherapy | adriamycin | SD | |
| BET1 | SNV | Missense_Mutation | rs775800524 | c.227N>A | p.Gly76Glu | p.G76E | O15155 | protein_coding | deleterious(0) | probably_damaging(0.998) | TCGA-AX-A06F-01 | Endometrium | uterine corpus endometrioid carcinoma | Female | <65 | III/IV | Chemotherapy | carboplatin | SD |
| BET1 | SNV | Missense_Mutation | c.143C>A | p.Ser48Tyr | p.S48Y | O15155 | protein_coding | deleterious(0.02) | benign(0.2) | TCGA-AX-A0J0-01 | Endometrium | uterine corpus endometrioid carcinoma | Female | <65 | I/II | Unknown | Unknown | SD | |
| BET1 | SNV | Missense_Mutation | novel | c.98N>C | p.Glu33Ala | p.E33A | O15155 | protein_coding | deleterious(0.01) | benign(0.226) | TCGA-AX-A1CE-01 | Endometrium | uterine corpus endometrioid carcinoma | Female | <65 | I/II | Unspecific | Paclitaxel | SD |
| BET1 | SNV | Missense_Mutation | novel | c.242C>A | p.Thr81Asn | p.T81N | O15155 | protein_coding | deleterious(0) | probably_damaging(0.993) | TCGA-AX-A2HC-01 | Endometrium | uterine corpus endometrioid carcinoma | Female | <65 | III/IV | Chemotherapy | paclitaxel | PD |
| Page: 1 2 |
Top |
Related drugs of malignant transformation related genes |
| Identification of chemicals and drugs interact with genes involved in malignant transfromation |
| (DGIdb 4.0) |
| Entrez ID | Symbol | Category | Interaction Types | Drug Claim Name | Drug Name | PMIDs |
| Page: 1 |

Copyright 2023-Present -The University of Texas Health Science Center at Houston |