
|
|||||
|
 | |
| |
| |
| |
| |
| |
|
Gene: BEND7 |
Gene summary for BEND7 |
| Gene information | Species | Human | Gene symbol | BEND7 | Gene ID | 222389 |
| Gene name | BEN domain containing 7 | |
| Gene Alias | C10orf30 | |
| Cytomap | 10p13 | |
| Gene Type | protein-coding | GO ID | GO:0005575 | UniProtAcc | Q8N7W2 |
Top |
Malignant transformation analysis |
| Identification of the aberrant gene expression in precancerous and cancerous lesions by comparing the gene expression of stem-like cells in diseased tissues with normal stem cells |
| Entrez ID | Symbol | Replicates | Species | Organ | Tissue | Adj P-value | Log2FC | Malignancy |
| 222389 | BEND7 | GSM5252132_BPH389PrGF | Human | Prostate | BPH | 1.75e-04 | 6.40e-01 | -0.2247 |
| 222389 | BEND7 | GSM5252133_BPH389PrSF | Human | Prostate | BPH | 1.39e-03 | 8.39e-01 | -0.2027 |
| 222389 | BEND7 | GSM5252135_BPH511PrPUr_Fcol_3GEX | Human | Prostate | BPH | 1.48e-29 | 8.21e-01 | -0.1833 |
| 222389 | BEND7 | 047563_1562-all-cells | Human | Prostate | BPH | 1.61e-02 | 1.62e-01 | 0.0791 |
| 222389 | BEND7 | 048752_1579-all-cells | Human | Prostate | BPH | 2.60e-19 | 4.86e-01 | 0.1008 |
| 222389 | BEND7 | 052095_1628-all-cells | Human | Prostate | BPH | 1.79e-02 | 2.21e-01 | 0.1032 |
| 222389 | BEND7 | 052097_1595-all-cells | Human | Prostate | BPH | 1.09e-31 | 6.53e-01 | 0.0972 |
| 222389 | BEND7 | 052099_1652-all-cells | Human | Prostate | BPH | 1.55e-13 | 4.71e-01 | 0.1038 |
| 222389 | BEND7 | Dong_P1 | Human | Prostate | Tumor | 9.12e-11 | 8.28e-02 | 0.035 |
| 222389 | BEND7 | male-WTA | Human | Thyroid | PTC | 6.65e-19 | 1.91e-02 | 0.1037 |
| 222389 | BEND7 | PTC01 | Human | Thyroid | PTC | 2.01e-11 | 2.49e-02 | 0.1899 |
| 222389 | BEND7 | PTC03 | Human | Thyroid | PTC | 5.24e-04 | 4.95e-02 | 0.1784 |
| 222389 | BEND7 | PTC04 | Human | Thyroid | PTC | 5.06e-17 | 3.18e-01 | 0.1927 |
| 222389 | BEND7 | PTC05 | Human | Thyroid | PTC | 1.14e-24 | 7.94e-01 | 0.2065 |
| 222389 | BEND7 | PTC06 | Human | Thyroid | PTC | 3.20e-31 | 7.12e-01 | 0.2057 |
| 222389 | BEND7 | PTC07 | Human | Thyroid | PTC | 9.34e-24 | 5.32e-01 | 0.2044 |
| 222389 | BEND7 | ATC09 | Human | Thyroid | ATC | 2.35e-05 | 1.15e-01 | 0.2871 |
| 222389 | BEND7 | ATC13 | Human | Thyroid | ATC | 4.57e-25 | 5.02e-01 | 0.34 |
| 222389 | BEND7 | ATC1 | Human | Thyroid | ATC | 3.01e-04 | 1.00e-01 | 0.2878 |
| 222389 | BEND7 | ATC5 | Human | Thyroid | ATC | 8.60e-25 | 5.59e-01 | 0.34 |
| Page: 1 |
| Tissue | Expression Dynamics | Abbreviation |
| Prostate | 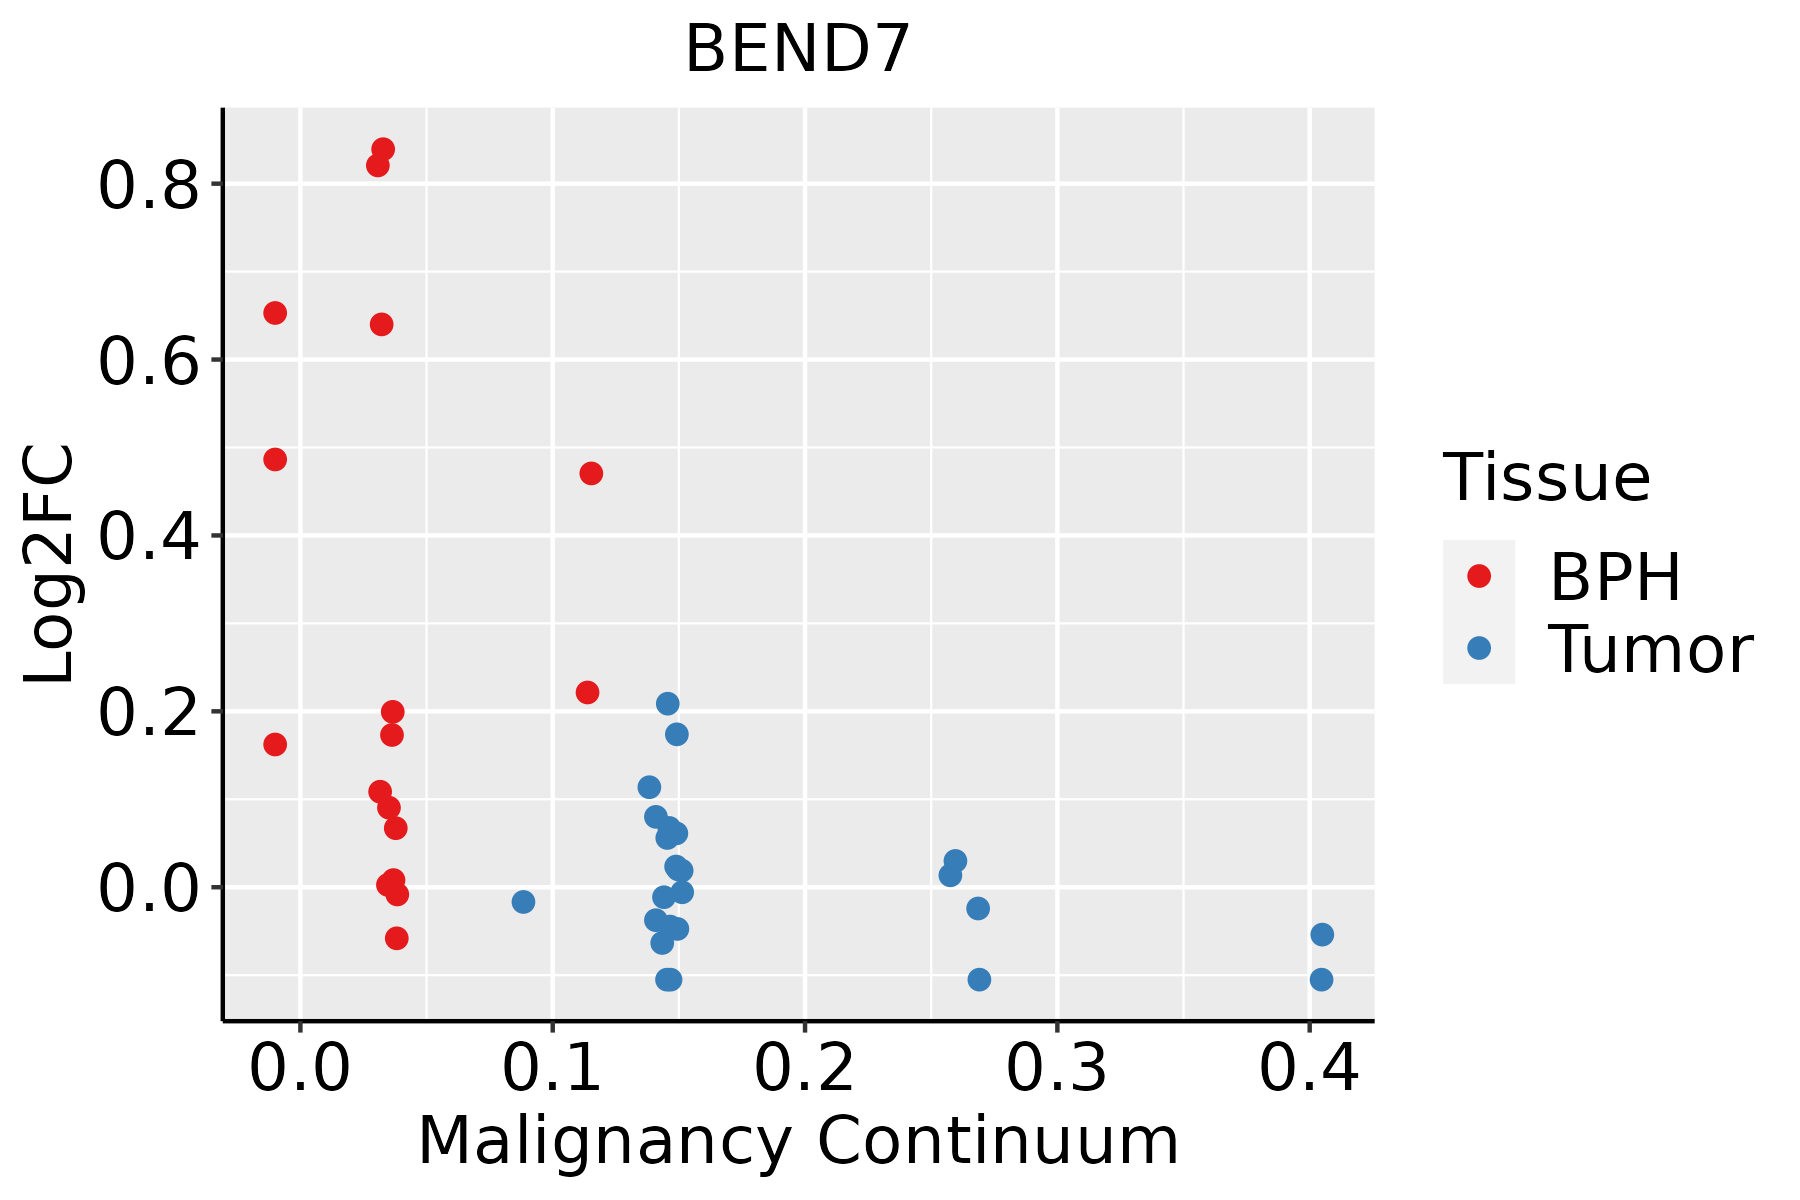 | BPH: Benign Prostatic Hyperplasia |
| Thyroid | 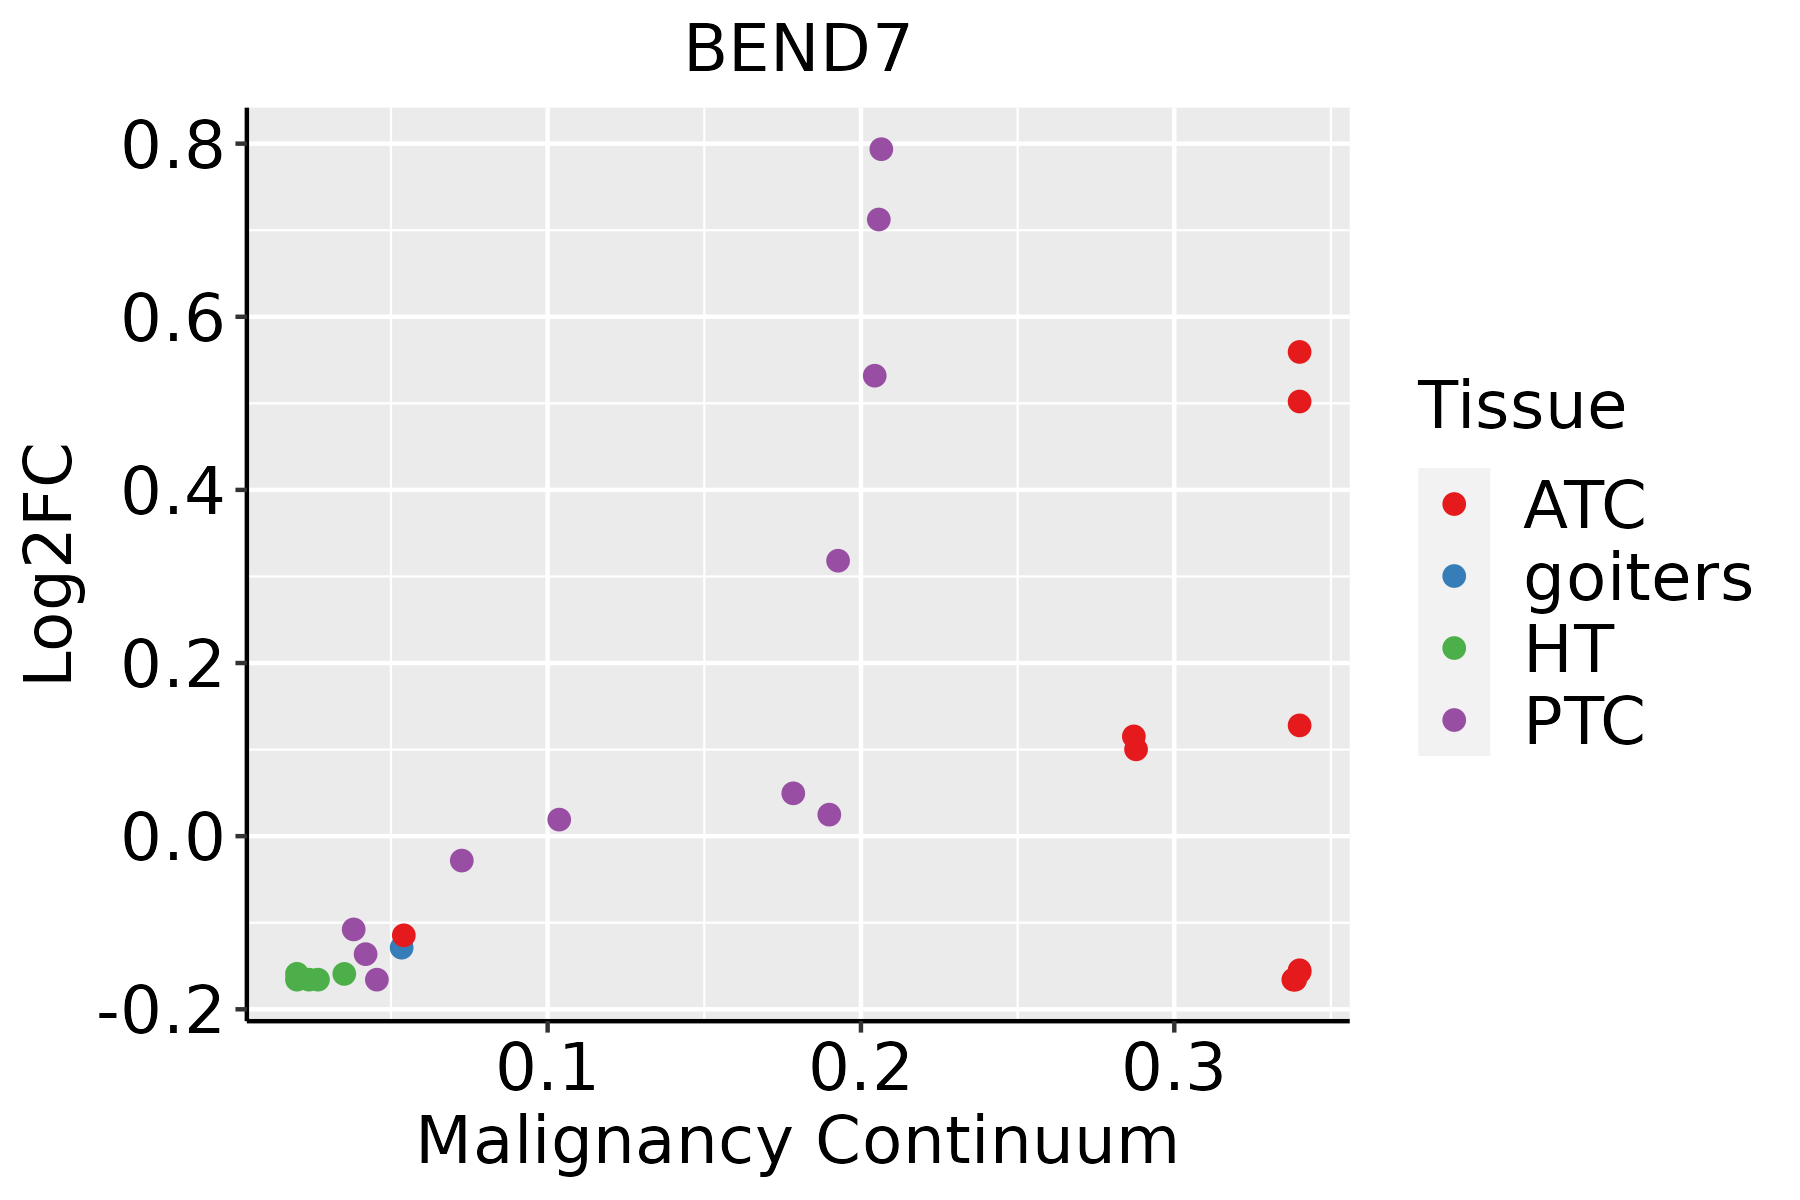 | ATC: Anaplastic thyroid cancer |
| HT: Hashimoto's thyroiditis | ||
| PTC: Papillary thyroid cancer |
| ∗log2FC in expression of this searched gene in stem-like cells from each diseased tissue sample relative to stem-like cells in normal samples in each tissue plotted against the malignancy continuum. Samples are colored based on if they are from different disease stage. |
Top |
Malignant transformation related pathway analysis |
| Find out the enriched GO biological processes and KEGG pathways involved in transition from healthy to precancer to cancer |
| Tissue | Disease Stage | Enriched GO biological Processes |
| Colorectum | AD |  |
| Colorectum | SER |  |
| Colorectum | MSS |  |
| Colorectum | MSI-H |  |
| Colorectum | FAP |  |
| ∗Top 15 enriched GO BP terms are showed in the bar plot of each disease state in each tissue. Each row represents a significant GO biological process which is colored according to the -log10(p.adjust). |
| Page: 1 2 3 4 5 6 7 8 9 |
| GO ID | Tissue | Disease Stage | Description | Gene Ratio | Bg Ratio | pvalue | p.adjust | Count |
| Page: 1 |
| Pathway ID | Tissue | Disease Stage | Description | Gene Ratio | Bg Ratio | pvalue | p.adjust | qvalue | Count |
| Page: 1 |
Top |
Cell-cell communication analysis |
| Identification of potential cell-cell interactions between two cell types and their ligand-receptor pairs for different disease states |
| Ligand | Receptor | LRpair | Pathway | Tissue | Disease Stage |
| Page: 1 |
Top |
Single-cell gene regulatory network inference analysis |
| Find out the significant the regulons (TFs) and the target genes of each regulon across cell types for different disease states |
| TF | Cell Type | Tissue | Disease Stage | Target Gene | RSS | Regulon Activity |
| ∗The dot plots of a searched regulon are shown for all cell subpopulations in each disease state of each tissue based on the regulon specific score inferred using pySCENIC and by calculating the average expression. |
| Page: 1 |
Top |
Somatic mutation of malignant transformation related genes |
| Annotation of somatic variants for genes involved in malignant transformation |
| Hugo Symbol | Variant Class | Variant Classification | dbSNP RS | HGVSc | HGVSp | HGVSp Short | SWISSPROT | BIOTYPE | SIFT | PolyPhen | Tumor Sample Barcode | Tissue | Histology | Sex | Age | Stage | Therapy Types | Drugs | Outcome |
| BEND7 | SNV | Missense_Mutation | novel | c.248C>T | p.Ser83Phe | p.S83F | Q8N7W2 | protein_coding | deleterious_low_confidence(0) | probably_damaging(0.996) | TCGA-5L-AAT1-01 | Breast | breast invasive carcinoma | Female | <65 | III/IV | Hormone Therapy | letrozol | SD |
| BEND7 | SNV | Missense_Mutation | c.896G>C | p.Gly299Ala | p.G299A | Q8N7W2 | protein_coding | deleterious_low_confidence(0.01) | probably_damaging(0.998) | TCGA-A7-A0DA-01 | Breast | breast invasive carcinoma | Female | <65 | I/II | Chemotherapy | adriamycin | SD | |
| BEND7 | SNV | Missense_Mutation | rs141298792 | c.679G>A | p.Asp227Asn | p.D227N | Q8N7W2 | protein_coding | deleterious_low_confidence(0.03) | probably_damaging(0.973) | TCGA-AC-A23H-01 | Breast | breast invasive carcinoma | Female | >=65 | I/II | Unknown | Unknown | PD |
| BEND7 | SNV | Missense_Mutation | novel | c.113N>T | p.Asp38Val | p.D38V | Q8N7W2 | protein_coding | deleterious_low_confidence(0.01) | benign(0.046) | TCGA-AN-A03X-01 | Breast | breast invasive carcinoma | Female | >=65 | I/II | Unknown | Unknown | SD |
| BEND7 | insertion | Nonsense_Mutation | novel | c.1102_1103insAAAAAATGCTTTAAAAAATGTGAGAGAGTGGTTGAGTGCAGTG | p.Thr368LysfsTer5 | p.T368Kfs*5 | Q8N7W2 | protein_coding | TCGA-A8-A06X-01 | Breast | breast invasive carcinoma | Female | >=65 | I/II | Unknown | Unknown | SD | ||
| BEND7 | insertion | Nonsense_Mutation | novel | c.769_770insTGTTAATTTGTTGAAATAATAATTTAAGAGCC | p.Ser257MetfsTer5 | p.S257Mfs*5 | Q8N7W2 | protein_coding | TCGA-A8-A090-01 | Breast | breast invasive carcinoma | Female | >=65 | I/II | Unknown | Unknown | SD | ||
| BEND7 | insertion | Nonsense_Mutation | novel | c.506_507insTATGGCACGCTATGATGCTGAGCAGCGATGAGCAGCCGAAGC | p.Val169_Pro170insMetAlaArgTyrAspAlaGluGlnArgTerAlaAlaGluAla | p.V169_P170insMARYDAEQR*AAEA | Q8N7W2 | protein_coding | TCGA-AN-A0FX-01 | Breast | breast invasive carcinoma | Female | <65 | I/II | Unknown | Unknown | SD | ||
| BEND7 | SNV | Missense_Mutation | rs534620750 | c.58C>T | p.Arg20Trp | p.R20W | Q8N7W2 | protein_coding | deleterious_low_confidence(0) | probably_damaging(0.997) | TCGA-EA-A410-01 | Cervix | cervical & endocervical cancer | Female | <65 | I/II | Unknown | Unknown | SD |
| BEND7 | SNV | Missense_Mutation | c.370N>G | p.Leu124Val | p.L124V | Q8N7W2 | protein_coding | deleterious_low_confidence(0) | probably_damaging(0.99) | TCGA-EK-A2PG-01 | Cervix | cervical & endocervical cancer | Female | >=65 | I/II | Unknown | Unknown | SD | |
| BEND7 | SNV | Missense_Mutation | c.633G>C | p.Glu211Asp | p.E211D | Q8N7W2 | protein_coding | tolerated_low_confidence(0.2) | benign(0.145) | TCGA-IR-A3LA-01 | Cervix | cervical & endocervical cancer | Female | <65 | I/II | Chemotherapy | cisplatin | CR |
| Page: 1 2 3 4 5 6 |
Top |
Related drugs of malignant transformation related genes |
| Identification of chemicals and drugs interact with genes involved in malignant transfromation |
| (DGIdb 4.0) |
| Entrez ID | Symbol | Category | Interaction Types | Drug Claim Name | Drug Name | PMIDs |
| Page: 1 |

Copyright 2023-Present -The University of Texas Health Science Center at Houston |