
|
|||||
|
 | |
| |
| |
| |
| |
| |
|
Gene: BEND6 |
Gene summary for BEND6 |
| Gene information | Species | Human | Gene symbol | BEND6 | Gene ID | 221336 |
| Gene name | BEN domain containing 6 | |
| Gene Alias | C6orf65 | |
| Cytomap | 6p12.1 | |
| Gene Type | protein-coding | GO ID | GO:0006139 | UniProtAcc | Q5SZJ8 |
Top |
Malignant transformation analysis |
| Identification of the aberrant gene expression in precancerous and cancerous lesions by comparing the gene expression of stem-like cells in diseased tissues with normal stem cells |
| Entrez ID | Symbol | Replicates | Species | Organ | Tissue | Adj P-value | Log2FC | Malignancy |
| 221336 | BEND6 | P2T-E | Human | Esophagus | ESCC | 1.66e-02 | 9.22e-02 | 0.1177 |
| 221336 | BEND6 | P4T-E | Human | Esophagus | ESCC | 2.81e-07 | 2.03e-01 | 0.1323 |
| 221336 | BEND6 | P9T-E | Human | Esophagus | ESCC | 8.38e-03 | 1.01e-01 | 0.1131 |
| 221336 | BEND6 | P10T-E | Human | Esophagus | ESCC | 8.56e-12 | 2.17e-01 | 0.116 |
| 221336 | BEND6 | P11T-E | Human | Esophagus | ESCC | 9.07e-04 | 1.62e-01 | 0.1426 |
| 221336 | BEND6 | P15T-E | Human | Esophagus | ESCC | 5.26e-03 | 9.91e-02 | 0.1149 |
| 221336 | BEND6 | P21T-E | Human | Esophagus | ESCC | 4.30e-10 | 1.95e-01 | 0.1617 |
| 221336 | BEND6 | P22T-E | Human | Esophagus | ESCC | 7.90e-03 | 8.94e-02 | 0.1236 |
| 221336 | BEND6 | P26T-E | Human | Esophagus | ESCC | 9.53e-09 | 1.63e-01 | 0.1276 |
| 221336 | BEND6 | P27T-E | Human | Esophagus | ESCC | 1.96e-05 | 1.21e-01 | 0.1055 |
| 221336 | BEND6 | P28T-E | Human | Esophagus | ESCC | 1.88e-04 | 1.20e-01 | 0.1149 |
| 221336 | BEND6 | P31T-E | Human | Esophagus | ESCC | 7.90e-03 | 1.01e-01 | 0.1251 |
| 221336 | BEND6 | P32T-E | Human | Esophagus | ESCC | 8.40e-04 | 1.03e-01 | 0.1666 |
| 221336 | BEND6 | P37T-E | Human | Esophagus | ESCC | 2.47e-11 | 2.66e-01 | 0.1371 |
| 221336 | BEND6 | P40T-E | Human | Esophagus | ESCC | 6.35e-03 | 1.83e-01 | 0.109 |
| 221336 | BEND6 | P44T-E | Human | Esophagus | ESCC | 6.93e-04 | 1.56e-01 | 0.1096 |
| 221336 | BEND6 | P49T-E | Human | Esophagus | ESCC | 5.57e-05 | 7.21e-01 | 0.1768 |
| 221336 | BEND6 | P52T-E | Human | Esophagus | ESCC | 3.89e-12 | 2.49e-01 | 0.1555 |
| 221336 | BEND6 | P56T-E | Human | Esophagus | ESCC | 6.66e-05 | 4.55e-01 | 0.1613 |
| 221336 | BEND6 | P61T-E | Human | Esophagus | ESCC | 6.37e-05 | 1.56e-01 | 0.099 |
| Page: 1 2 |
| Tissue | Expression Dynamics | Abbreviation |
| Esophagus | 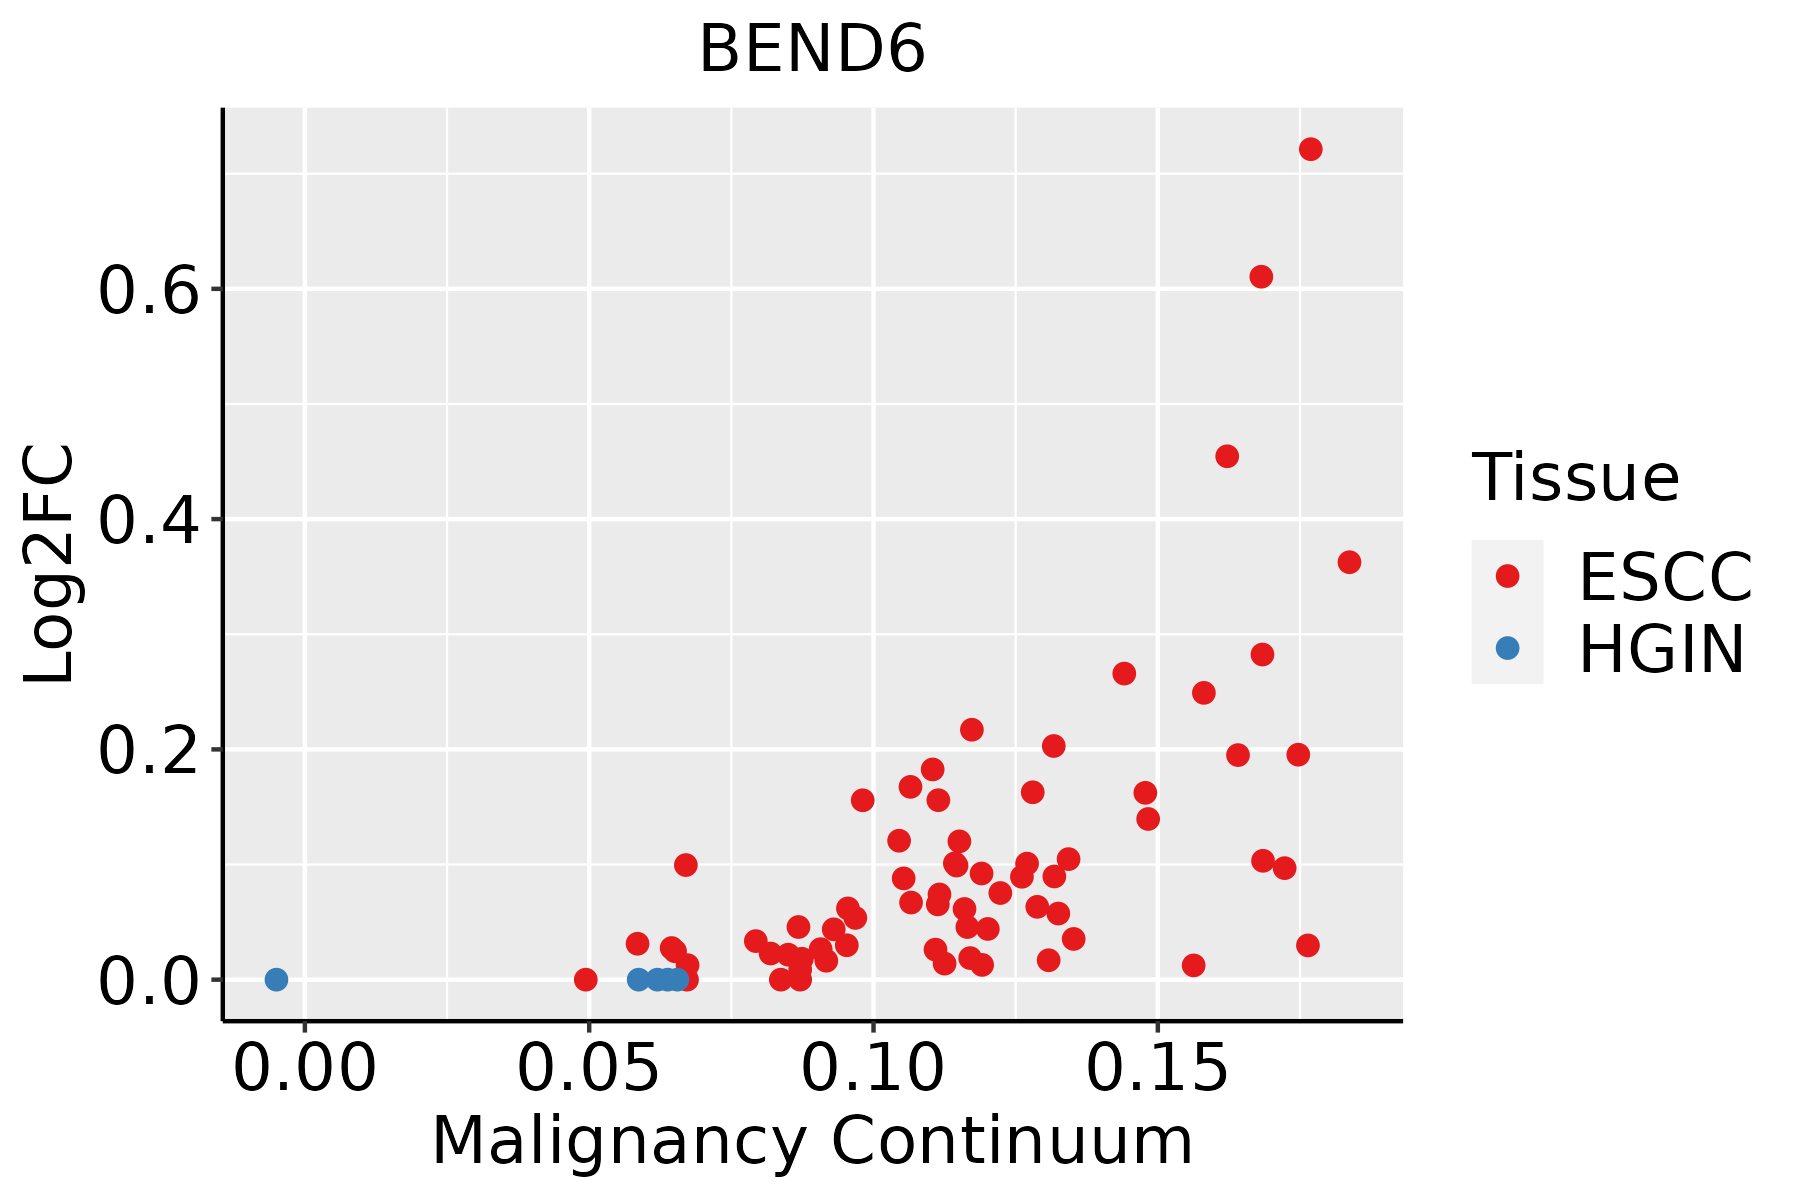 | ESCC: Esophageal squamous cell carcinoma |
| HGIN: High-grade intraepithelial neoplasias | ||
| LGIN: Low-grade intraepithelial neoplasias | ||
| Thyroid | 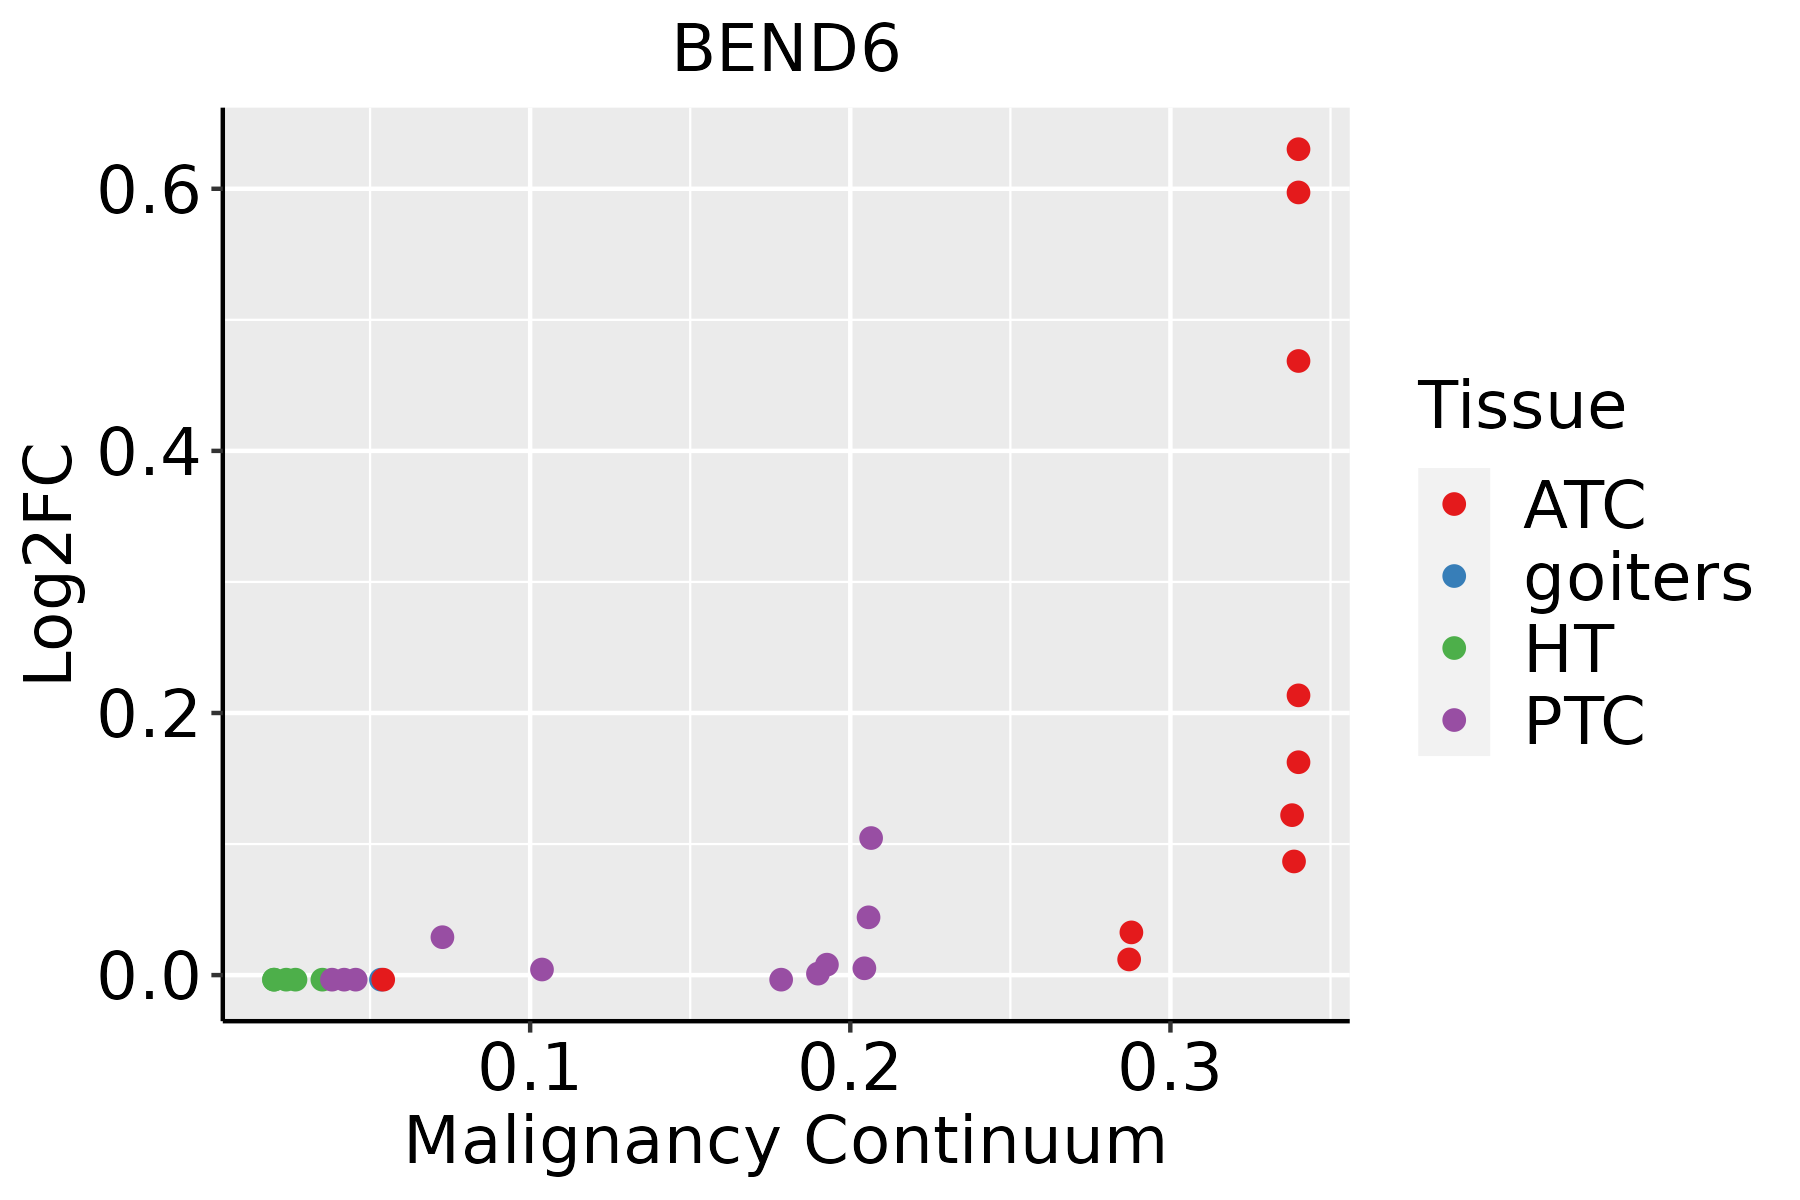 | ATC: Anaplastic thyroid cancer |
| HT: Hashimoto's thyroiditis | ||
| PTC: Papillary thyroid cancer |
| ∗log2FC in expression of this searched gene in stem-like cells from each diseased tissue sample relative to stem-like cells in normal samples in each tissue plotted against the malignancy continuum. Samples are colored based on if they are from different disease stage. |
Top |
Malignant transformation related pathway analysis |
| Find out the enriched GO biological processes and KEGG pathways involved in transition from healthy to precancer to cancer |
| Tissue | Disease Stage | Enriched GO biological Processes |
| Colorectum | AD |  |
| Colorectum | SER |  |
| Colorectum | MSS |  |
| Colorectum | MSI-H |  |
| Colorectum | FAP |  |
| ∗Top 15 enriched GO BP terms are showed in the bar plot of each disease state in each tissue. Each row represents a significant GO biological process which is colored according to the -log10(p.adjust). |
| Page: 1 2 3 4 5 6 7 8 9 |
| GO ID | Tissue | Disease Stage | Description | Gene Ratio | Bg Ratio | pvalue | p.adjust | Count |
| GO:00072197 | Esophagus | ESCC | Notch signaling pathway | 106/8552 | 172/18723 | 1.74e-05 | 1.55e-04 | 106 |
| GO:0045746 | Esophagus | ESCC | negative regulation of Notch signaling pathway | 28/8552 | 36/18723 | 8.62e-05 | 6.22e-04 | 28 |
| GO:00085935 | Esophagus | ESCC | regulation of Notch signaling pathway | 59/8552 | 95/18723 | 9.12e-04 | 4.65e-03 | 59 |
| GO:000721915 | Thyroid | ATC | Notch signaling pathway | 79/6293 | 172/18723 | 5.08e-04 | 2.96e-03 | 79 |
| GO:00085937 | Thyroid | ATC | regulation of Notch signaling pathway | 43/6293 | 95/18723 | 1.19e-02 | 4.22e-02 | 43 |
| Page: 1 |
| Pathway ID | Tissue | Disease Stage | Description | Gene Ratio | Bg Ratio | pvalue | p.adjust | qvalue | Count |
| Page: 1 |
Top |
Cell-cell communication analysis |
| Identification of potential cell-cell interactions between two cell types and their ligand-receptor pairs for different disease states |
| Ligand | Receptor | LRpair | Pathway | Tissue | Disease Stage |
| Page: 1 |
Top |
Single-cell gene regulatory network inference analysis |
| Find out the significant the regulons (TFs) and the target genes of each regulon across cell types for different disease states |
| TF | Cell Type | Tissue | Disease Stage | Target Gene | RSS | Regulon Activity |
| ∗The dot plots of a searched regulon are shown for all cell subpopulations in each disease state of each tissue based on the regulon specific score inferred using pySCENIC and by calculating the average expression. |
| Page: 1 |
Top |
Somatic mutation of malignant transformation related genes |
| Annotation of somatic variants for genes involved in malignant transformation |
| Hugo Symbol | Variant Class | Variant Classification | dbSNP RS | HGVSc | HGVSp | HGVSp Short | SWISSPROT | BIOTYPE | SIFT | PolyPhen | Tumor Sample Barcode | Tissue | Histology | Sex | Age | Stage | Therapy Types | Drugs | Outcome |
| BEND6 | SNV | Missense_Mutation | c.331N>A | p.Leu111Met | p.L111M | Q5SZJ8 | protein_coding | deleterious_low_confidence(0) | probably_damaging(0.994) | TCGA-D8-A1XK-01 | Breast | breast invasive carcinoma | Female | <65 | I/II | Chemotherapy | doxorubicine+cyclophosphamide | SD | |
| BEND6 | SNV | Missense_Mutation | c.569N>G | p.Gln190Arg | p.Q190R | Q5SZJ8 | protein_coding | deleterious(0) | probably_damaging(0.982) | TCGA-AA-3811-01 | Colorectum | colon adenocarcinoma | Female | >=65 | III/IV | Unknown | Unknown | PD | |
| BEND6 | SNV | Missense_Mutation | c.827N>G | p.Gln276Arg | p.Q276R | Q5SZJ8 | protein_coding | tolerated_low_confidence(0.12) | benign(0.037) | TCGA-AD-A5EJ-01 | Colorectum | colon adenocarcinoma | Female | >=65 | I/II | Unknown | Unknown | SD | |
| BEND6 | SNV | Missense_Mutation | novel | c.226N>C | p.Ser76Arg | p.S76R | Q5SZJ8 | protein_coding | deleterious_low_confidence(0.01) | benign(0.017) | TCGA-CA-6717-01 | Colorectum | colon adenocarcinoma | Male | <65 | I/II | Chemotherapy | oxaliplatin | CR |
| BEND6 | SNV | Missense_Mutation | novel | c.50N>T | p.Arg17Ile | p.R17I | Q5SZJ8 | protein_coding | tolerated_low_confidence(0.07) | benign(0.202) | TCGA-EI-6917-01 | Colorectum | rectum adenocarcinoma | Male | <65 | III/IV | Chemotherapy | 5fluorouracil+oxaciplatina+l-folinian | SD |
| BEND6 | SNV | Missense_Mutation | c.718N>G | p.Thr240Ala | p.T240A | Q5SZJ8 | protein_coding | deleterious(0.03) | probably_damaging(0.989) | TCGA-EI-6917-01 | Colorectum | rectum adenocarcinoma | Male | <65 | III/IV | Chemotherapy | 5fluorouracil+oxaciplatina+l-folinian | SD | |
| BEND6 | SNV | Missense_Mutation | novel | c.668N>A | p.Ala223Asp | p.A223D | Q5SZJ8 | protein_coding | tolerated(0.36) | possibly_damaging(0.9) | TCGA-A5-A0G1-01 | Endometrium | uterine corpus endometrioid carcinoma | Female | >=65 | I/II | Unknown | Unknown | SD |
| BEND6 | SNV | Missense_Mutation | rs752940502 | c.38N>T | p.Thr13Ile | p.T13I | Q5SZJ8 | protein_coding | tolerated_low_confidence(0.31) | benign(0) | TCGA-A5-A0G2-01 | Endometrium | uterine corpus endometrioid carcinoma | Female | <65 | III/IV | Unknown | Unknown | SD |
| BEND6 | SNV | Missense_Mutation | rs564440830 | c.410N>G | p.Asn137Ser | p.N137S | Q5SZJ8 | protein_coding | tolerated_low_confidence(0.48) | benign(0.009) | TCGA-A5-A0G2-01 | Endometrium | uterine corpus endometrioid carcinoma | Female | <65 | III/IV | Unknown | Unknown | SD |
| BEND6 | SNV | Missense_Mutation | c.81N>A | p.Met27Ile | p.M27I | Q5SZJ8 | protein_coding | tolerated_low_confidence(1) | benign(0) | TCGA-A5-A0GP-01 | Endometrium | uterine corpus endometrioid carcinoma | Female | <65 | I/II | Unknown | Unknown | SD |
| Page: 1 2 3 4 |
Top |
Related drugs of malignant transformation related genes |
| Identification of chemicals and drugs interact with genes involved in malignant transfromation |
| (DGIdb 4.0) |
| Entrez ID | Symbol | Category | Interaction Types | Drug Claim Name | Drug Name | PMIDs |
| Page: 1 |

Copyright 2023-Present -The University of Texas Health Science Center at Houston |