| Tissue | Expression Dynamics | Abbreviation |
| Cervix | 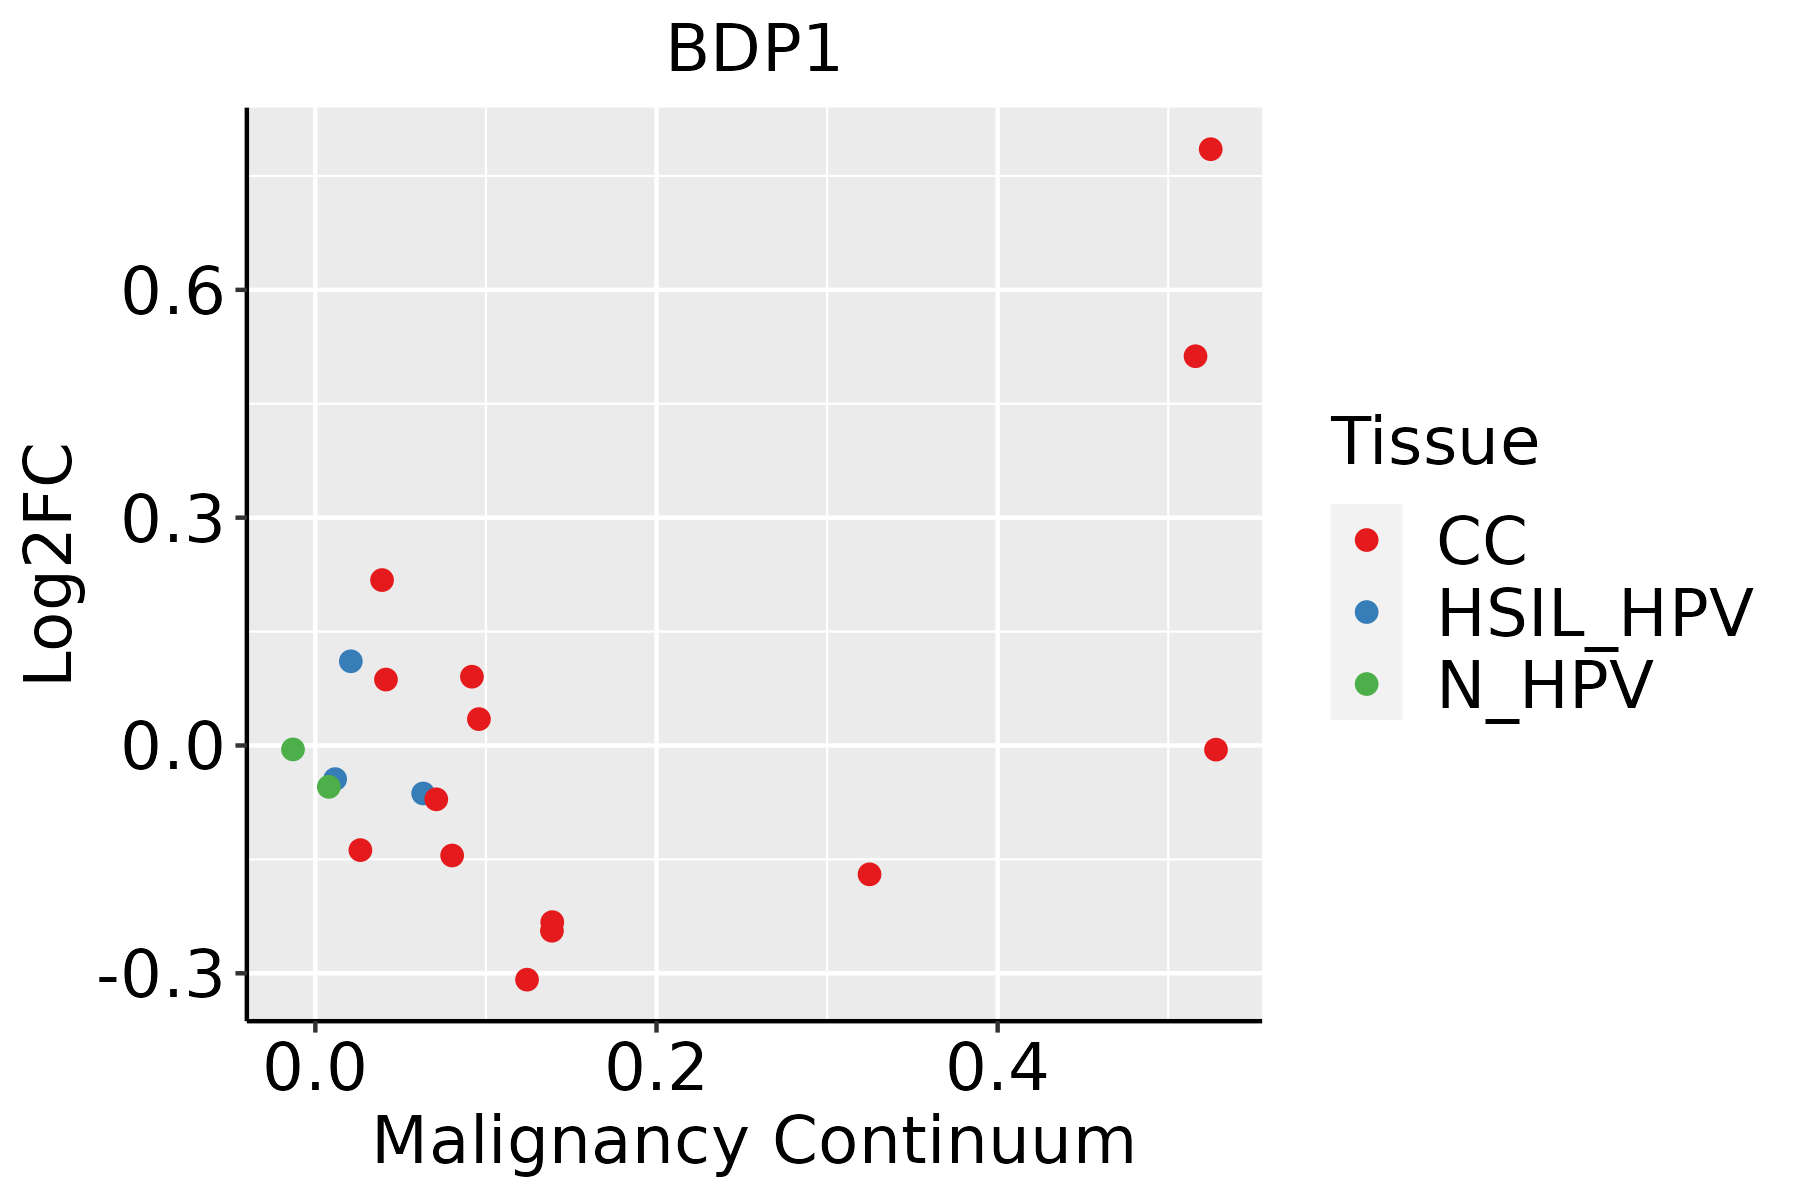 | CC: Cervix cancer |
| HSIL_HPV: HPV-infected high-grade squamous intraepithelial lesions |
| N_HPV: HPV-infected normal cervix |
| Colorectum (GSE201348) |  | FAP: Familial adenomatous polyposis |
| CRC: Colorectal cancer |
| Colorectum (HTA11) |  | AD: Adenomas |
| SER: Sessile serrated lesions |
| MSI-H: Microsatellite-high colorectal cancer |
| MSS: Microsatellite stable colorectal cancer |
| Esophagus |  | ESCC: Esophageal squamous cell carcinoma |
| HGIN: High-grade intraepithelial neoplasias |
| LGIN: Low-grade intraepithelial neoplasias |
| Liver | 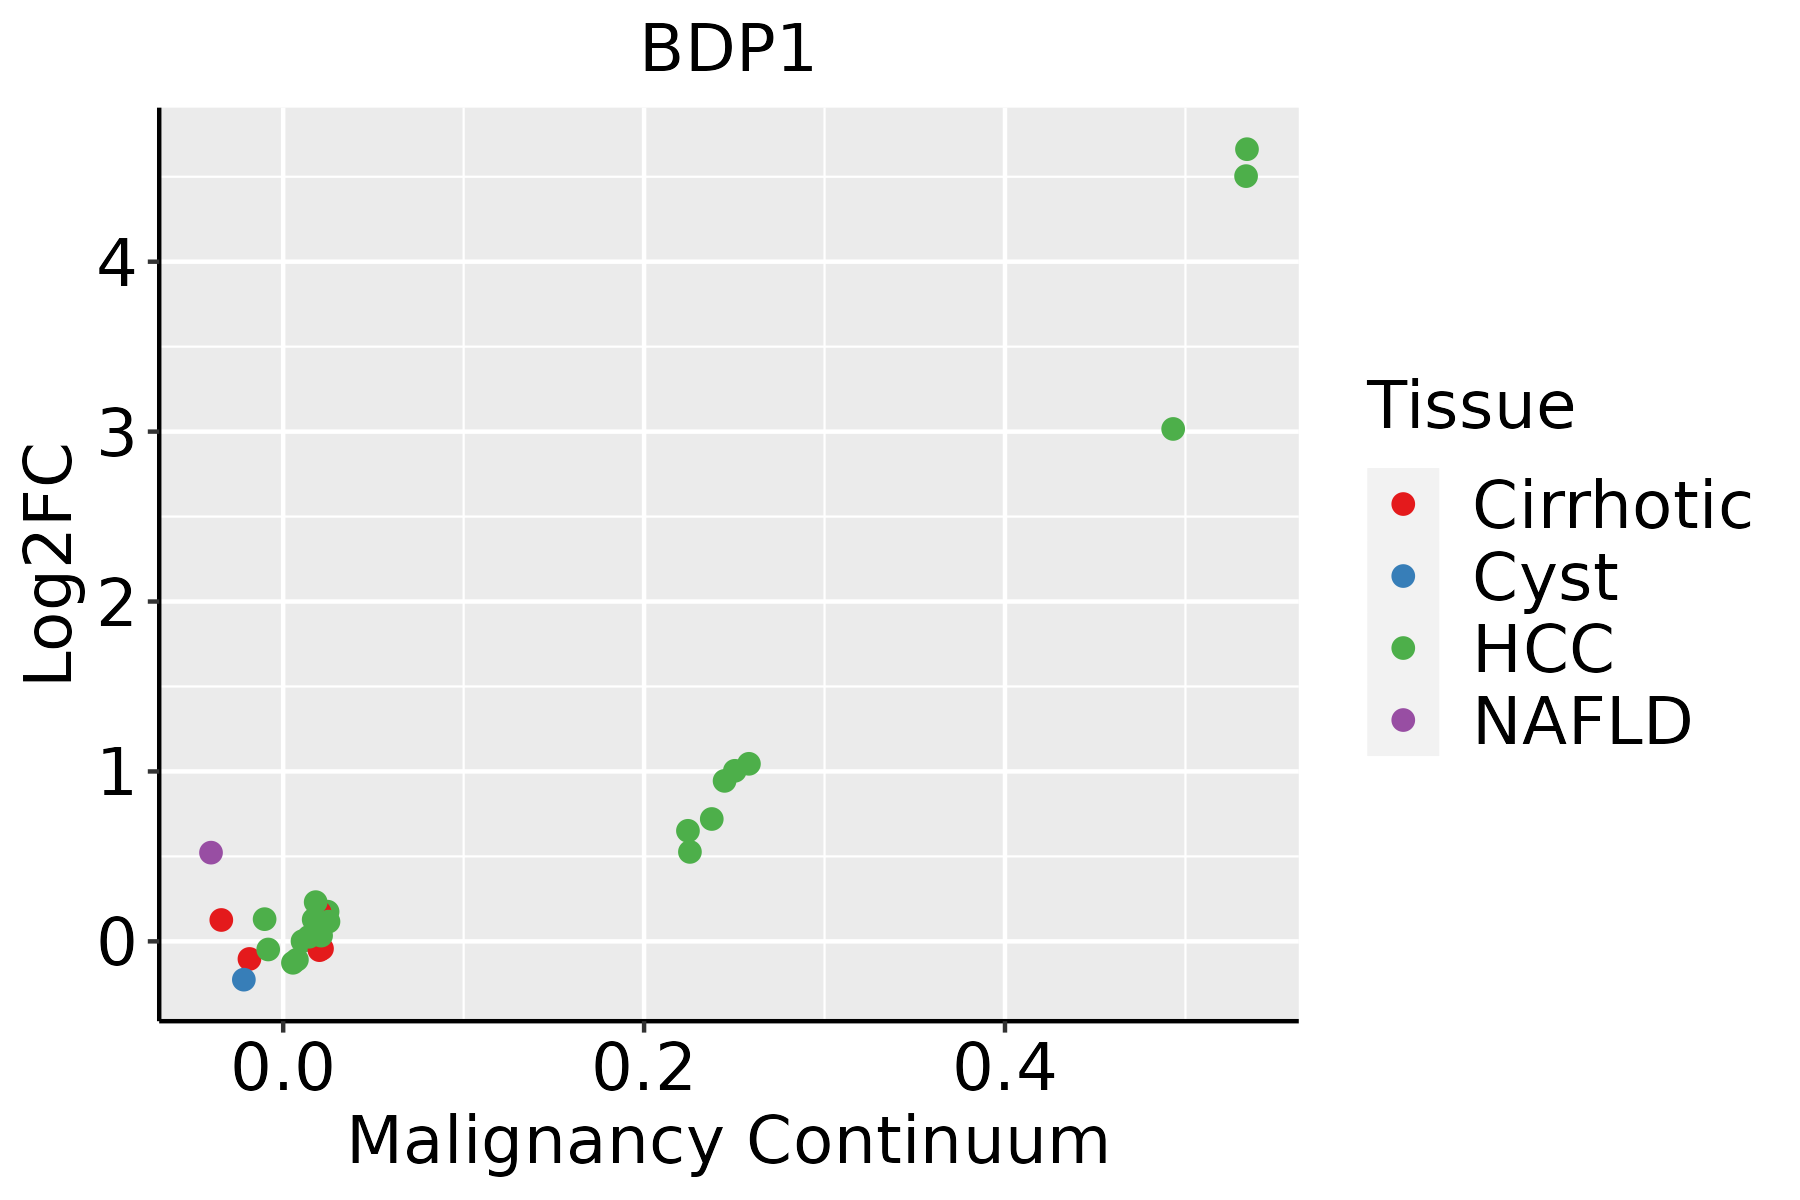 | HCC: Hepatocellular carcinoma |
| NAFLD: Non-alcoholic fatty liver disease |
| Oral Cavity |  | EOLP: Erosive Oral lichen planus |
| LP: leukoplakia |
| NEOLP: Non-erosive oral lichen planus |
| OSCC: Oral squamous cell carcinoma |
| Prostate |  | BPH: Benign Prostatic Hyperplasia |
| Skin | 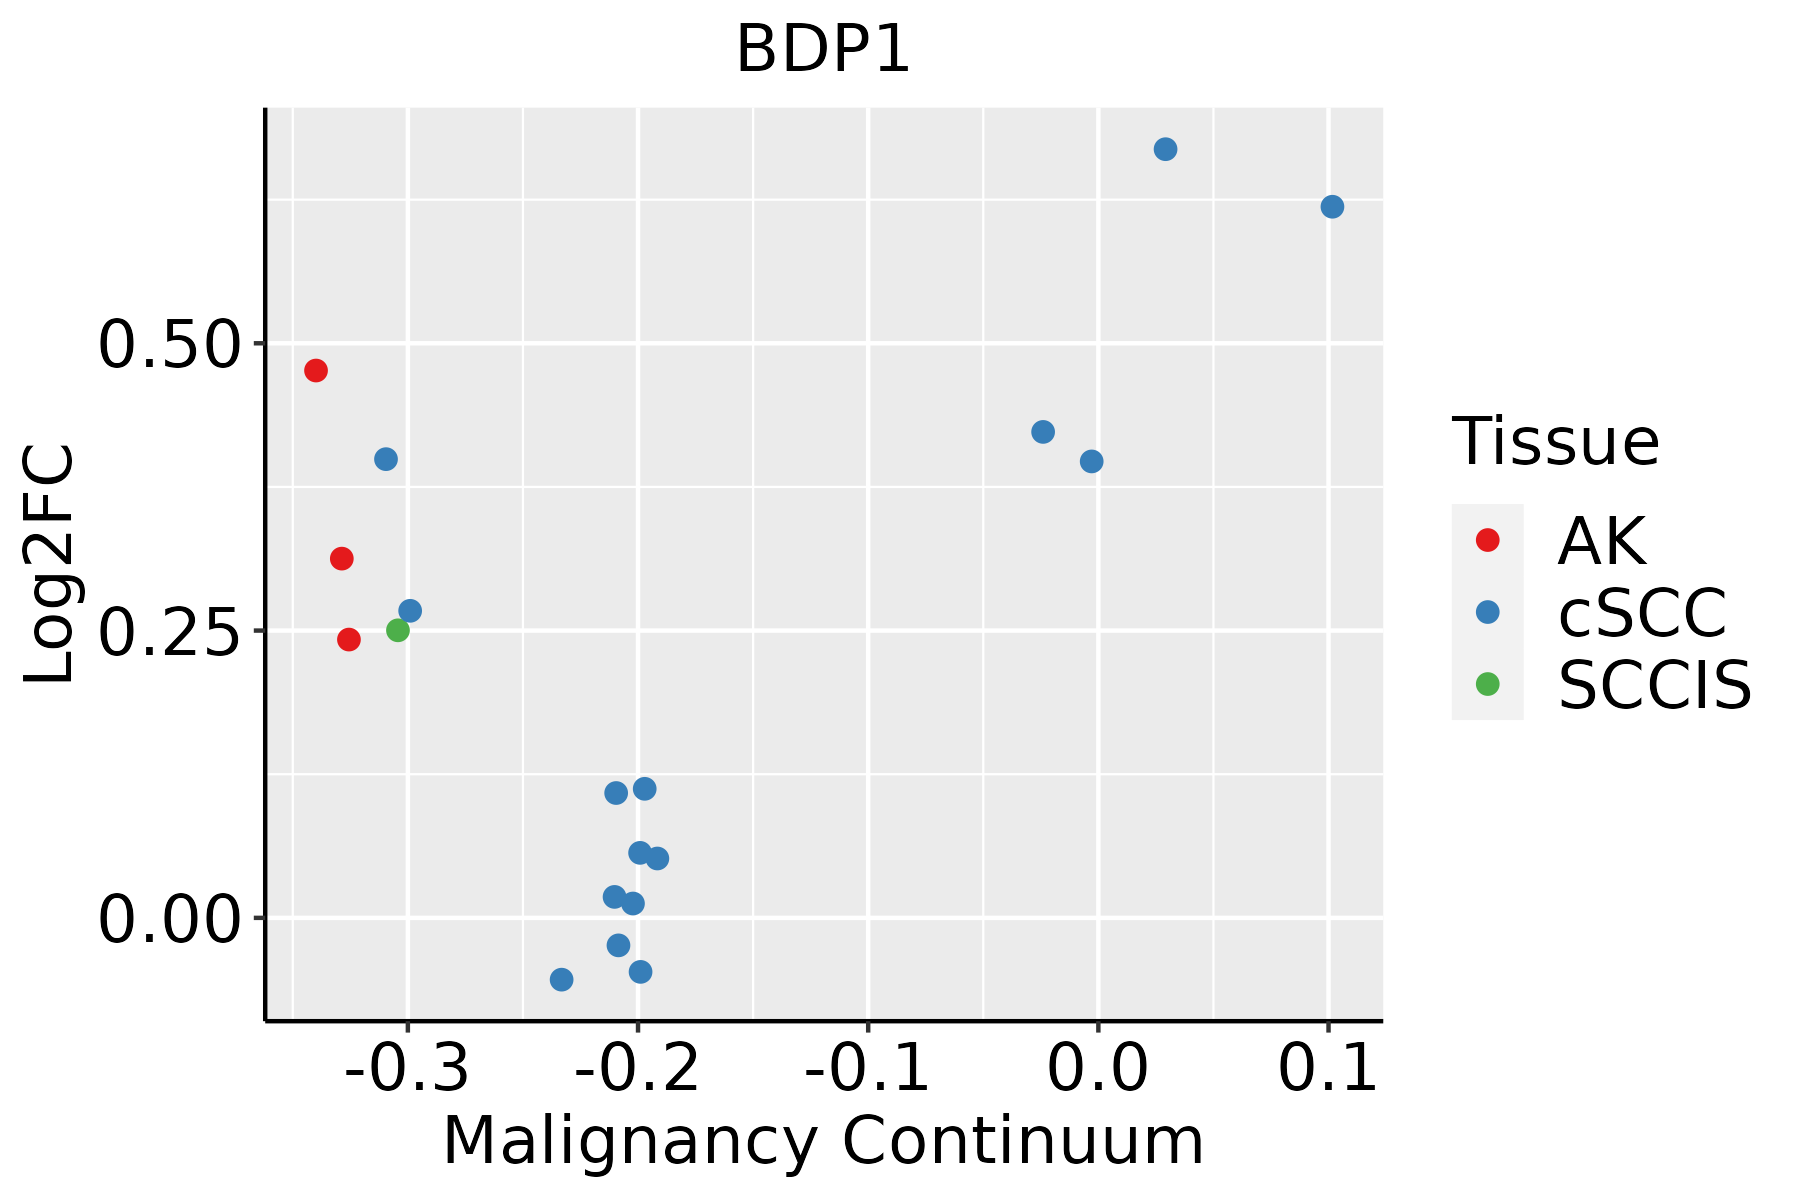 | AK: Actinic keratosis |
| cSCC: Cutaneous squamous cell carcinoma |
| SCCIS:squamous cell carcinoma in situ |
| Thyroid |  | ATC: Anaplastic thyroid cancer |
| HT: Hashimoto's thyroiditis |
| PTC: Papillary thyroid cancer |
| GO ID | Tissue | Disease Stage | Description | Gene Ratio | Bg Ratio | pvalue | p.adjust | Count |
| GO:00063833 | Esophagus | ESCC | transcription by RNA polymerase III | 41/8552 | 46/18723 | 7.69e-10 | 1.90e-08 | 41 |
| GO:000635211 | Esophagus | ESCC | DNA-templated transcription, initiation | 86/8552 | 130/18723 | 1.88e-06 | 2.19e-05 | 86 |
| GO:00708973 | Esophagus | ESCC | transcription preinitiation complex assembly | 30/8552 | 36/18723 | 3.60e-06 | 3.95e-05 | 30 |
| GO:0070897 | Liver | Cirrhotic | transcription preinitiation complex assembly | 17/4634 | 36/18723 | 2.82e-03 | 1.63e-02 | 17 |
| GO:0006352 | Liver | HCC | DNA-templated transcription, initiation | 78/7958 | 130/18723 | 4.19e-05 | 4.11e-04 | 78 |
| GO:0006383 | Liver | HCC | transcription by RNA polymerase III | 31/7958 | 46/18723 | 5.67e-04 | 3.61e-03 | 31 |
| GO:00708971 | Liver | HCC | transcription preinitiation complex assembly | 25/7958 | 36/18723 | 9.87e-04 | 5.71e-03 | 25 |
| GO:00063832 | Oral cavity | OSCC | transcription by RNA polymerase III | 34/7305 | 46/18723 | 1.61e-06 | 2.11e-05 | 34 |
| GO:00063522 | Oral cavity | OSCC | DNA-templated transcription, initiation | 74/7305 | 130/18723 | 2.56e-05 | 2.39e-04 | 74 |
| GO:00708972 | Oral cavity | OSCC | transcription preinitiation complex assembly | 24/7305 | 36/18723 | 7.18e-04 | 3.95e-03 | 24 |
| GO:0071824 | Skin | AK | protein-DNA complex subunit organization | 38/1910 | 241/18723 | 4.43e-03 | 2.57e-02 | 38 |
| GO:00063524 | Skin | AK | DNA-templated transcription, initiation | 23/1910 | 130/18723 | 6.10e-03 | 3.29e-02 | 23 |
| GO:000635212 | Skin | cSCC | DNA-templated transcription, initiation | 57/4864 | 130/18723 | 7.28e-06 | 1.01e-04 | 57 |
| GO:00708974 | Skin | cSCC | transcription preinitiation complex assembly | 21/4864 | 36/18723 | 3.98e-05 | 4.26e-04 | 21 |
| GO:00718241 | Skin | cSCC | protein-DNA complex subunit organization | 87/4864 | 241/18723 | 3.09e-04 | 2.47e-03 | 87 |
| GO:00063834 | Skin | cSCC | transcription by RNA polymerase III | 20/4864 | 46/18723 | 7.44e-03 | 3.50e-02 | 20 |
| GO:00063525 | Thyroid | PTC | DNA-templated transcription, initiation | 63/5968 | 130/18723 | 5.72e-05 | 5.05e-04 | 63 |
| GO:00708975 | Thyroid | PTC | transcription preinitiation complex assembly | 22/5968 | 36/18723 | 2.85e-04 | 2.02e-03 | 22 |
| GO:00063835 | Thyroid | PTC | transcription by RNA polymerase III | 23/5968 | 46/18723 | 7.89e-03 | 3.33e-02 | 23 |
| GO:000635213 | Thyroid | ATC | DNA-templated transcription, initiation | 64/6293 | 130/18723 | 1.60e-04 | 1.10e-03 | 64 |
| TF | Cell Type | Tissue | Disease Stage | Target Gene | RSS | Regulon Activity |
| BDP1 | CD8TEXINT | Breast | ADJ | ARGLU1,AKAP9,PBX1, etc. | 8.47e-02 |  |
| BDP1 | CD8TEFF | Breast | ADJ | ARGLU1,AKAP9,PBX1, etc. | 1.60e-01 | |
| BDP1 | COL | Cervix | HSIL_HPV | SRRM2,PNN,GOLGB1, etc. | 2.66e-01 |  |
| BDP1 | TH1 | Colorectum | AD | RHOBTB2,TIMM23B,HERC2, etc. | 1.76e-02 |  |
| BDP1 | CD4TN | Colorectum | MSI-H | RHOBTB2,TIMM23B,HERC2, etc. | 4.35e-02 |  |
| BDP1 | MAC | Colorectum | MSS | RHOBTB2,TIMM23B,HERC2, etc. | 6.43e-02 |  |
| BDP1 | CD8TEFF | Endometrium | ADJ | HAX1,SLC25A20,Z94721.1, etc. | 1.64e-02 |  |
| BDP1 | DIFF | Esophagus | Healthy | PPA1,PRSS22,AURKAIP1, etc. | 3.56e-02 |  |
| BDP1 | CD8TCM | Oral cavity | ADJ | ARGLU1,GOLGB1,RSRP1, etc. | 3.97e-01 |  |
| BDP1 | CD8TCM | Oral cavity | LP | ARGLU1,GOLGB1,RSRP1, etc. | 2.37e-01 |  |
| Hugo Symbol | Variant Class | Variant Classification | dbSNP RS | HGVSc | HGVSp | HGVSp Short | SWISSPROT | BIOTYPE | SIFT | PolyPhen | Tumor Sample Barcode | Tissue | Histology | Sex | Age | Stage | Therapy Types | Drugs | Outcome |
| BDP1 | SNV | Missense_Mutation | | c.7669N>C | p.Glu2557Gln | p.E2557Q | A6H8Y1 | protein_coding | deleterious(0) | possibly_damaging(0.475) | TCGA-A1-A0SH-01 | Breast | breast invasive carcinoma | Female | <65 | I/II | Chemotherapy | tc | SD |
| BDP1 | SNV | Missense_Mutation | | c.275N>T | p.Ser92Leu | p.S92L | A6H8Y1 | protein_coding | tolerated(0.2) | benign(0.225) | TCGA-A2-A3Y0-01 | Breast | breast invasive carcinoma | Female | <65 | I/II | Chemotherapy | adriamycin | CR |
| BDP1 | SNV | Missense_Mutation | | c.560N>A | p.Arg187Lys | p.R187K | A6H8Y1 | protein_coding | deleterious(0) | probably_damaging(0.924) | TCGA-A7-A26H-01 | Breast | breast invasive carcinoma | Female | >=65 | I/II | Hormone Therapy | anastrozole | PD |
| BDP1 | SNV | Missense_Mutation | | c.3253N>A | p.Glu1085Lys | p.E1085K | A6H8Y1 | protein_coding | tolerated(0.47) | benign(0.014) | TCGA-A8-A094-01 | Breast | breast invasive carcinoma | Female | >=65 | I/II | Unknown | Unknown | SD |
| BDP1 | SNV | Missense_Mutation | rs527435694 | c.2661N>C | p.Lys887Asn | p.K887N | A6H8Y1 | protein_coding | tolerated(0.13) | benign(0.046) | TCGA-AR-A1AO-01 | Breast | breast invasive carcinoma | Female | <65 | I/II | Chemotherapy | doxorubicin | SD |
| BDP1 | SNV | Missense_Mutation | | c.1877C>T | p.Ala626Val | p.A626V | A6H8Y1 | protein_coding | deleterious(0.01) | probably_damaging(0.947) | TCGA-B6-A0IC-01 | Breast | breast invasive carcinoma | Female | >=65 | I/II | Unknown | Unknown | SD |
| BDP1 | SNV | Missense_Mutation | novel | c.6587C>G | p.Ser2196Cys | p.S2196C | A6H8Y1 | protein_coding | tolerated(0.06) | benign(0.012) | TCGA-BH-A8FY-01 | Breast | breast invasive carcinoma | Female | >=65 | I/II | Unknown | Unknown | SD |
| BDP1 | SNV | Missense_Mutation | | c.4178N>G | p.Ser1393Cys | p.S1393C | A6H8Y1 | protein_coding | tolerated(0.16) | benign(0.443) | TCGA-C8-A26Y-01 | Breast | breast invasive carcinoma | Female | >=65 | I/II | Unknown | Unknown | SD |
| BDP1 | SNV | Missense_Mutation | novel | c.6065N>C | p.Ser2022Thr | p.S2022T | A6H8Y1 | protein_coding | tolerated(0.27) | possibly_damaging(0.889) | TCGA-D8-A4Z1-01 | Breast | breast invasive carcinoma | Female | >=65 | I/II | Hormone Therapy | tamoxiphen | SD |
| BDP1 | SNV | Missense_Mutation | | c.7535N>C | p.Cys2512Ser | p.C2512S | A6H8Y1 | protein_coding | deleterious(0.05) | probably_damaging(0.999) | TCGA-GM-A2DB-01 | Breast | breast invasive carcinoma | Female | <65 | I/II | Chemotherapy | taxol | CR |


