
|
|||||
|
 | |
| |
| |
| |
| |
| |
|
Gene: BDNF |
Gene summary for BDNF |
| Gene information | Species | Human | Gene symbol | BDNF | Gene ID | 627 |
| Gene name | brain derived neurotrophic factor | |
| Gene Alias | ANON2 | |
| Cytomap | 11p14.1 | |
| Gene Type | protein-coding | GO ID | GO:0000902 | UniProtAcc | A0A0E3SU01 |
Top |
Malignant transformation analysis |
| Identification of the aberrant gene expression in precancerous and cancerous lesions by comparing the gene expression of stem-like cells in diseased tissues with normal stem cells |
| Entrez ID | Symbol | Replicates | Species | Organ | Tissue | Adj P-value | Log2FC | Malignancy |
| 627 | BDNF | LZE7T | Human | Esophagus | ESCC | 5.34e-06 | 3.67e-01 | 0.0667 |
| 627 | BDNF | P4T-E | Human | Esophagus | ESCC | 1.49e-06 | 2.57e-01 | 0.1323 |
| 627 | BDNF | P8T-E | Human | Esophagus | ESCC | 4.36e-08 | 2.85e-01 | 0.0889 |
| 627 | BDNF | P9T-E | Human | Esophagus | ESCC | 4.37e-08 | 2.43e-01 | 0.1131 |
| 627 | BDNF | P10T-E | Human | Esophagus | ESCC | 4.86e-15 | 3.32e-01 | 0.116 |
| 627 | BDNF | P12T-E | Human | Esophagus | ESCC | 2.80e-21 | 5.07e-01 | 0.1122 |
| 627 | BDNF | P26T-E | Human | Esophagus | ESCC | 1.78e-07 | 2.68e-01 | 0.1276 |
| 627 | BDNF | P28T-E | Human | Esophagus | ESCC | 1.09e-18 | 4.43e-01 | 0.1149 |
| 627 | BDNF | P30T-E | Human | Esophagus | ESCC | 2.01e-09 | 5.64e-01 | 0.137 |
| 627 | BDNF | P31T-E | Human | Esophagus | ESCC | 1.08e-07 | 1.66e-01 | 0.1251 |
| 627 | BDNF | P32T-E | Human | Esophagus | ESCC | 5.79e-04 | 1.72e-01 | 0.1666 |
| 627 | BDNF | P39T-E | Human | Esophagus | ESCC | 2.15e-16 | 4.56e-01 | 0.0894 |
| 627 | BDNF | P61T-E | Human | Esophagus | ESCC | 1.34e-11 | 3.21e-01 | 0.099 |
| 627 | BDNF | P74T-E | Human | Esophagus | ESCC | 1.44e-03 | 1.93e-01 | 0.1479 |
| 627 | BDNF | P75T-E | Human | Esophagus | ESCC | 5.23e-03 | 1.46e-01 | 0.1125 |
| 627 | BDNF | P80T-E | Human | Esophagus | ESCC | 5.01e-06 | 1.59e-01 | 0.155 |
| 627 | BDNF | P84T-E | Human | Esophagus | ESCC | 3.35e-05 | 6.72e-01 | 0.0933 |
| 627 | BDNF | P107T-E | Human | Esophagus | ESCC | 2.65e-03 | 1.66e-01 | 0.171 |
| 627 | BDNF | P128T-E | Human | Esophagus | ESCC | 1.27e-15 | 7.00e-01 | 0.1241 |
| Page: 1 |
| Tissue | Expression Dynamics | Abbreviation |
| Esophagus | 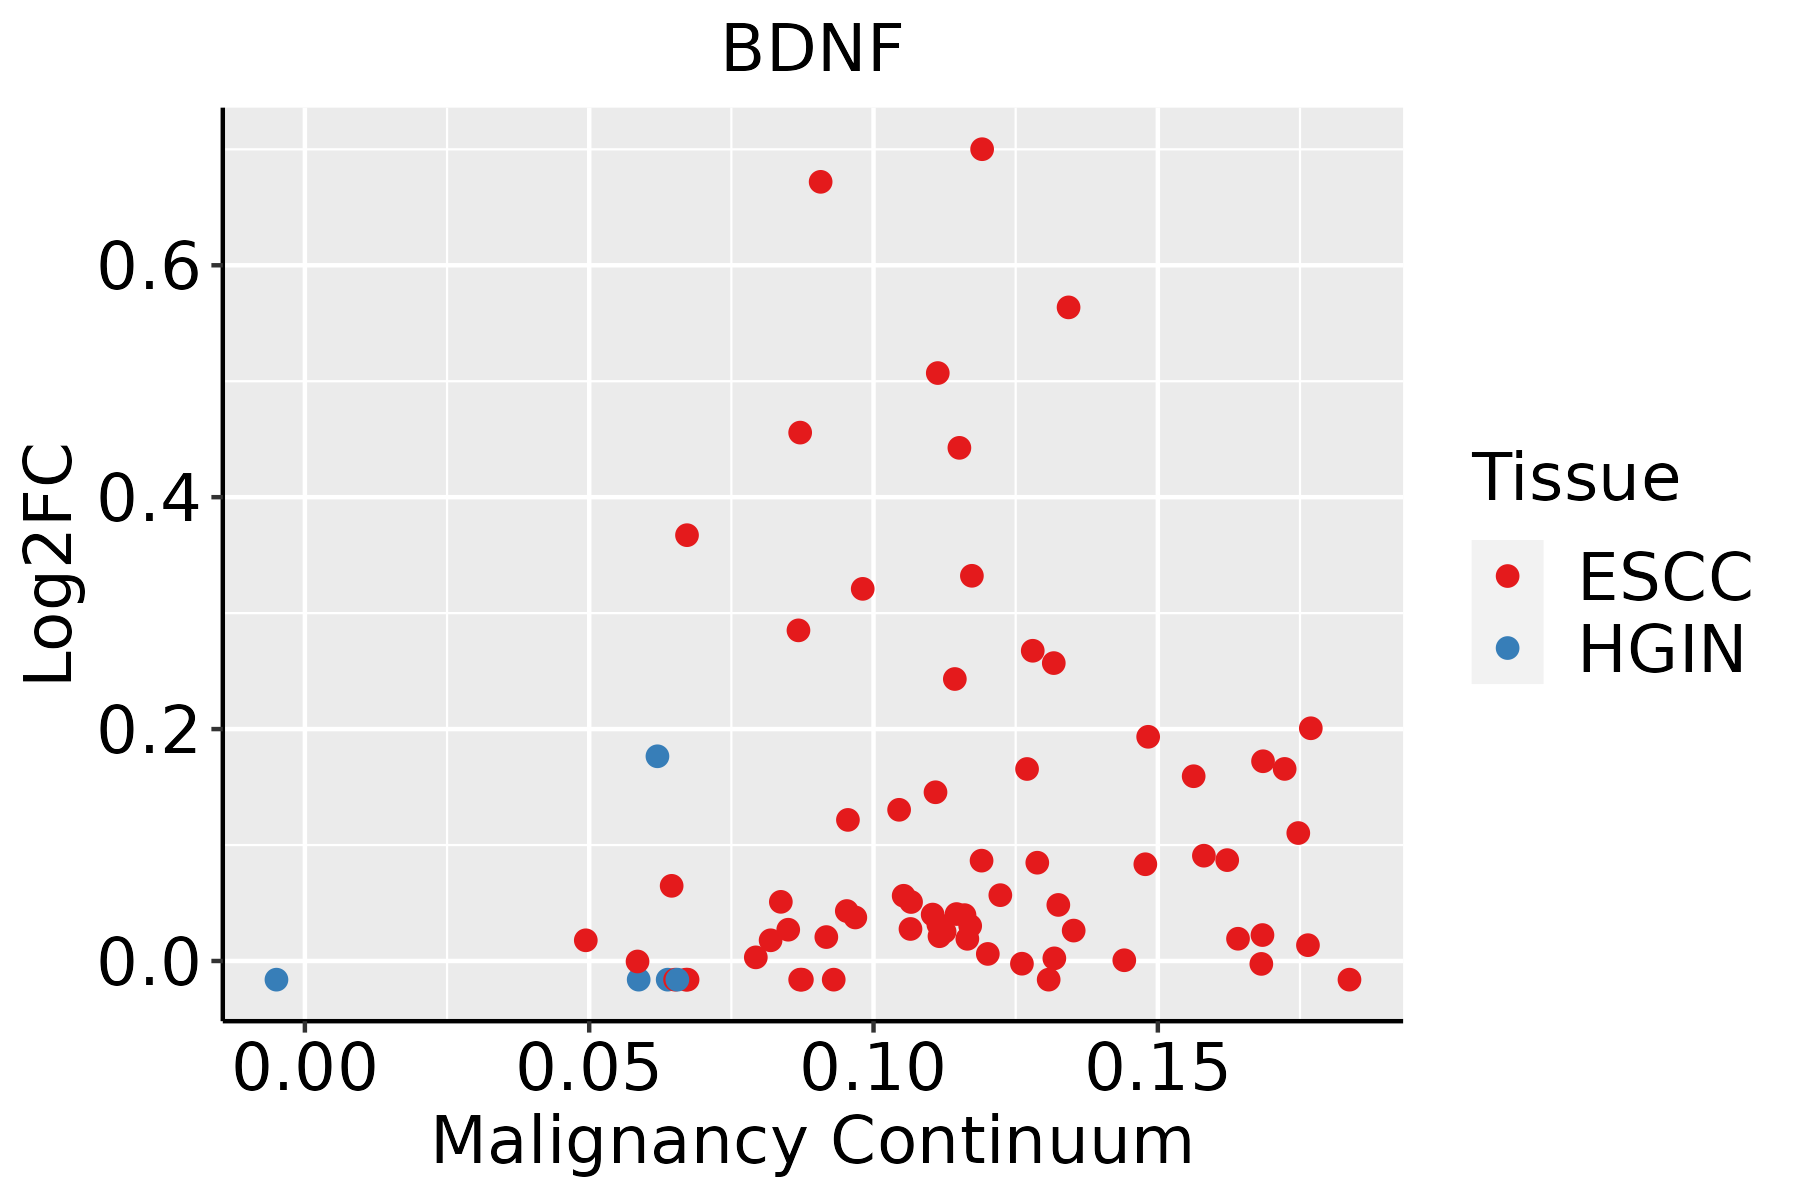 | ESCC: Esophageal squamous cell carcinoma |
| HGIN: High-grade intraepithelial neoplasias | ||
| LGIN: Low-grade intraepithelial neoplasias |
| ∗log2FC in expression of this searched gene in stem-like cells from each diseased tissue sample relative to stem-like cells in normal samples in each tissue plotted against the malignancy continuum. Samples are colored based on if they are from different disease stage. |
Top |
Malignant transformation related pathway analysis |
| Find out the enriched GO biological processes and KEGG pathways involved in transition from healthy to precancer to cancer |
| Tissue | Disease Stage | Enriched GO biological Processes |
| Colorectum | AD |  |
| Colorectum | SER |  |
| Colorectum | MSS |  |
| Colorectum | MSI-H |  |
| Colorectum | FAP |  |
| ∗Top 15 enriched GO BP terms are showed in the bar plot of each disease state in each tissue. Each row represents a significant GO biological process which is colored according to the -log10(p.adjust). |
| Page: 1 2 3 4 5 6 7 8 9 |
| GO ID | Tissue | Disease Stage | Description | Gene Ratio | Bg Ratio | pvalue | p.adjust | Count |
| GO:2001233111 | Esophagus | ESCC | regulation of apoptotic signaling pathway | 256/8552 | 356/18723 | 4.11e-24 | 1.04e-21 | 256 |
| GO:0051098111 | Esophagus | ESCC | regulation of binding | 251/8552 | 363/18723 | 6.73e-20 | 8.46e-18 | 251 |
| GO:2001234111 | Esophagus | ESCC | negative regulation of apoptotic signaling pathway | 161/8552 | 224/18723 | 1.24e-15 | 8.09e-14 | 161 |
| GO:0051099111 | Esophagus | ESCC | positive regulation of binding | 122/8552 | 173/18723 | 2.79e-11 | 9.45e-10 | 122 |
| GO:004339320 | Esophagus | ESCC | regulation of protein binding | 135/8552 | 196/18723 | 3.69e-11 | 1.22e-09 | 135 |
| GO:0016049110 | Esophagus | ESCC | cell growth | 289/8552 | 482/18723 | 1.29e-10 | 3.77e-09 | 289 |
| GO:000155819 | Esophagus | ESCC | regulation of cell growth | 248/8552 | 414/18723 | 2.97e-09 | 6.45e-08 | 248 |
| GO:0070997111 | Esophagus | ESCC | neuron death | 216/8552 | 361/18723 | 3.49e-08 | 6.45e-07 | 216 |
| GO:003253520 | Esophagus | ESCC | regulation of cellular component size | 227/8552 | 383/18723 | 4.77e-08 | 8.60e-07 | 227 |
| GO:003209216 | Esophagus | ESCC | positive regulation of protein binding | 60/8552 | 85/18723 | 2.83e-06 | 3.22e-05 | 60 |
| GO:00182099 | Esophagus | ESCC | peptidyl-serine modification | 196/8552 | 338/18723 | 3.07e-06 | 3.47e-05 | 196 |
| GO:0051402110 | Esophagus | ESCC | neuron apoptotic process | 148/8552 | 246/18723 | 3.08e-06 | 3.47e-05 | 148 |
| GO:001810515 | Esophagus | ESCC | peptidyl-serine phosphorylation | 184/8552 | 315/18723 | 3.22e-06 | 3.61e-05 | 184 |
| GO:1901214111 | Esophagus | ESCC | regulation of neuron death | 186/8552 | 319/18723 | 3.35e-06 | 3.73e-05 | 186 |
| GO:003134616 | Esophagus | ESCC | positive regulation of cell projection organization | 201/8552 | 353/18723 | 1.19e-05 | 1.11e-04 | 201 |
| GO:001072010 | Esophagus | ESCC | positive regulation of cell development | 172/8552 | 298/18723 | 1.74e-05 | 1.55e-04 | 172 |
| GO:005076710 | Esophagus | ESCC | regulation of neurogenesis | 203/8552 | 364/18723 | 6.10e-05 | 4.68e-04 | 203 |
| GO:00507697 | Esophagus | ESCC | positive regulation of neurogenesis | 131/8552 | 225/18723 | 9.71e-05 | 6.90e-04 | 131 |
| GO:003030710 | Esophagus | ESCC | positive regulation of cell growth | 100/8552 | 166/18723 | 1.07e-04 | 7.55e-04 | 100 |
| GO:199009017 | Esophagus | ESCC | cellular response to nerve growth factor stimulus | 38/8552 | 53/18723 | 1.10e-04 | 7.69e-04 | 38 |
| Page: 1 2 |
| Pathway ID | Tissue | Disease Stage | Description | Gene Ratio | Bg Ratio | pvalue | p.adjust | qvalue | Count |
| hsa05016210 | Esophagus | ESCC | Huntington disease | 226/4205 | 306/8465 | 1.38e-18 | 8.72e-17 | 4.46e-17 | 226 |
| hsa05022210 | Esophagus | ESCC | Pathways of neurodegeneration - multiple diseases | 318/4205 | 476/8465 | 6.10e-15 | 2.04e-13 | 1.05e-13 | 318 |
| hsa0472225 | Esophagus | ESCC | Neurotrophin signaling pathway | 80/4205 | 119/8465 | 7.33e-05 | 3.07e-04 | 1.57e-04 | 80 |
| hsa041517 | Esophagus | ESCC | PI3K-Akt signaling pathway | 197/4205 | 354/8465 | 1.24e-02 | 2.83e-02 | 1.45e-02 | 197 |
| hsa0501638 | Esophagus | ESCC | Huntington disease | 226/4205 | 306/8465 | 1.38e-18 | 8.72e-17 | 4.46e-17 | 226 |
| hsa0502238 | Esophagus | ESCC | Pathways of neurodegeneration - multiple diseases | 318/4205 | 476/8465 | 6.10e-15 | 2.04e-13 | 1.05e-13 | 318 |
| hsa04722111 | Esophagus | ESCC | Neurotrophin signaling pathway | 80/4205 | 119/8465 | 7.33e-05 | 3.07e-04 | 1.57e-04 | 80 |
| hsa0415114 | Esophagus | ESCC | PI3K-Akt signaling pathway | 197/4205 | 354/8465 | 1.24e-02 | 2.83e-02 | 1.45e-02 | 197 |
| Page: 1 |
Top |
Cell-cell communication analysis |
| Identification of potential cell-cell interactions between two cell types and their ligand-receptor pairs for different disease states |
| Ligand | Receptor | LRpair | Pathway | Tissue | Disease Stage |
| BDNF | NTRK2 | BDNF_NTRK2 | NT | Esophagus | ESCC |
| Page: 1 |
Top |
Single-cell gene regulatory network inference analysis |
| Find out the significant the regulons (TFs) and the target genes of each regulon across cell types for different disease states |
| TF | Cell Type | Tissue | Disease Stage | Target Gene | RSS | Regulon Activity |
| ∗The dot plots of a searched regulon are shown for all cell subpopulations in each disease state of each tissue based on the regulon specific score inferred using pySCENIC and by calculating the average expression. |
| Page: 1 |
Top |
Somatic mutation of malignant transformation related genes |
| Annotation of somatic variants for genes involved in malignant transformation |
| Hugo Symbol | Variant Class | Variant Classification | dbSNP RS | HGVSc | HGVSp | HGVSp Short | SWISSPROT | BIOTYPE | SIFT | PolyPhen | Tumor Sample Barcode | Tissue | Histology | Sex | Age | Stage | Therapy Types | Drugs | Outcome |
| BDNF | SNV | Missense_Mutation | c.880N>A | p.Gln294Lys | p.Q294K | P23560 | protein_coding | deleterious(0.04) | probably_damaging(0.948) | TCGA-AN-A0AK-01 | Breast | breast invasive carcinoma | Female | >=65 | I/II | Unknown | Unknown | SD | |
| BDNF | SNV | Missense_Mutation | c.127N>C | p.Val43Leu | p.V43L | P23560 | protein_coding | deleterious_low_confidence(0.04) | benign(0.001) | TCGA-BH-A0BZ-01 | Breast | breast invasive carcinoma | Female | <65 | III/IV | Chemotherapy | doxorubicin | CR | |
| BDNF | insertion | Frame_Shift_Ins | novel | c.633_634insATTCAGCCCATTTCACACCTGAAAATGTTAGTGATCACCACTT | p.Ser212IlefsTer16 | p.S212Ifs*16 | P23560 | protein_coding | TCGA-AO-A0JF-01 | Breast | breast invasive carcinoma | Female | >=65 | I/II | Chemotherapy | doxorubicin | SD | ||
| BDNF | SNV | Missense_Mutation | c.647N>A | p.Arg216His | p.R216H | P23560 | protein_coding | tolerated(1) | probably_damaging(0.982) | TCGA-AA-3966-01 | Colorectum | colon adenocarcinoma | Female | >=65 | I/II | Unknown | Unknown | SD | |
| BDNF | SNV | Missense_Mutation | novel | c.37N>G | p.Arg13Gly | p.R13G | P23560 | protein_coding | deleterious_low_confidence(0) | benign(0.051) | TCGA-AZ-6598-01 | Colorectum | colon adenocarcinoma | Female | >=65 | I/II | Unknown | Unknown | SD |
| BDNF | SNV | Missense_Mutation | novel | c.560N>A | p.Pro187His | p.P187H | P23560 | protein_coding | deleterious(0) | probably_damaging(0.999) | TCGA-CA-6717-01 | Colorectum | colon adenocarcinoma | Male | <65 | I/II | Chemotherapy | oxaliplatin | CR |
| BDNF | SNV | Missense_Mutation | c.625C>T | p.Arg209Trp | p.R209W | P23560 | protein_coding | deleterious(0) | probably_damaging(0.999) | TCGA-D5-5540-01 | Colorectum | colon adenocarcinoma | Male | >=65 | I/II | Unknown | Unknown | SD | |
| BDNF | SNV | Missense_Mutation | c.626N>A | p.Arg209Gln | p.R209Q | P23560 | protein_coding | deleterious(0) | probably_damaging(0.996) | TCGA-F4-6856-01 | Colorectum | colon adenocarcinoma | Male | <65 | I/II | Ancillary | leucovorin | CR | |
| BDNF | SNV | Missense_Mutation | c.69G>T | p.Glu23Asp | p.E23D | P23560 | protein_coding | deleterious_low_confidence(0) | benign(0.015) | TCGA-CL-5918-01 | Colorectum | rectum adenocarcinoma | Female | >=65 | I/II | Unknown | Unknown | SD | |
| BDNF | SNV | Missense_Mutation | c.692N>T | p.Thr231Met | p.T231M | P23560 | protein_coding | deleterious(0.01) | probably_damaging(0.999) | TCGA-EI-6882-01 | Colorectum | rectum adenocarcinoma | Male | <65 | I/II | Unknown | Unknown | SD |
| Page: 1 2 3 4 5 |
Top |
Related drugs of malignant transformation related genes |
| Identification of chemicals and drugs interact with genes involved in malignant transfromation |
| (DGIdb 4.0) |
| Entrez ID | Symbol | Category | Interaction Types | Drug Claim Name | Drug Name | PMIDs |
| 627 | BDNF | DRUGGABLE GENOME, GROWTH FACTOR | CAPSAICIN | CAPSAICIN | 10430952 | |
| 627 | BDNF | DRUGGABLE GENOME, GROWTH FACTOR | ANTIOXIDANT | 11274788 | ||
| 627 | BDNF | DRUGGABLE GENOME, GROWTH FACTOR | VINCRISTINE | VINCRISTINE | 15569250 | |
| 627 | BDNF | DRUGGABLE GENOME, GROWTH FACTOR | CHLORPROMAZINE | CHLORPROMAZINE | 18408624 | |
| 627 | BDNF | DRUGGABLE GENOME, GROWTH FACTOR | Analgesics | 25096645 | ||
| 627 | BDNF | DRUGGABLE GENOME, GROWTH FACTOR | heroin | DIACETYLMORPHINE | 24279859,28692418,26401760 | |
| 627 | BDNF | DRUGGABLE GENOME, GROWTH FACTOR | VERTEPORFIN | VERTEPORFIN | 15505074 | |
| 627 | BDNF | DRUGGABLE GENOME, GROWTH FACTOR | IL-12 | 16026835 | ||
| 627 | BDNF | DRUGGABLE GENOME, GROWTH FACTOR | NICARDIPINE | NICARDIPINE | 10748141 | |
| 627 | BDNF | DRUGGABLE GENOME, GROWTH FACTOR | ANTIBIOTICS | 14736076 |
| Page: 1 2 3 4 5 6 7 8 9 10 11 12 |

Copyright 2023-Present -The University of Texas Health Science Center at Houston |