
|
|||||
|
 | |
| |
| |
| |
| |
| |
|
Gene: BDKRB2 |
Gene summary for BDKRB2 |
| Gene information | Species | Human | Gene symbol | BDKRB2 | Gene ID | 624 |
| Gene name | bradykinin receptor B2 | |
| Gene Alias | B2R | |
| Cytomap | 14q32.2 | |
| Gene Type | protein-coding | GO ID | GO:0001932 | UniProtAcc | P30411 |
Top |
Malignant transformation analysis |
| Identification of the aberrant gene expression in precancerous and cancerous lesions by comparing the gene expression of stem-like cells in diseased tissues with normal stem cells |
| Entrez ID | Symbol | Replicates | Species | Organ | Tissue | Adj P-value | Log2FC | Malignancy |
| 624 | BDKRB2 | LZE4T | Human | Esophagus | ESCC | 1.22e-04 | 1.56e-01 | 0.0811 |
| 624 | BDKRB2 | LZE5T | Human | Esophagus | ESCC | 3.46e-03 | 2.15e-01 | 0.0514 |
| 624 | BDKRB2 | LZE20T | Human | Esophagus | ESCC | 5.90e-03 | 1.72e-01 | 0.0662 |
| 624 | BDKRB2 | P4T-E | Human | Esophagus | ESCC | 3.77e-07 | 1.34e-01 | 0.1323 |
| 624 | BDKRB2 | P5T-E | Human | Esophagus | ESCC | 2.53e-08 | 1.48e-01 | 0.1327 |
| 624 | BDKRB2 | P8T-E | Human | Esophagus | ESCC | 1.46e-04 | 2.43e-01 | 0.0889 |
| 624 | BDKRB2 | P11T-E | Human | Esophagus | ESCC | 1.09e-10 | 5.14e-01 | 0.1426 |
| 624 | BDKRB2 | P15T-E | Human | Esophagus | ESCC | 2.43e-03 | 9.26e-02 | 0.1149 |
| 624 | BDKRB2 | P17T-E | Human | Esophagus | ESCC | 4.23e-03 | 2.18e-01 | 0.1278 |
| 624 | BDKRB2 | P20T-E | Human | Esophagus | ESCC | 1.63e-02 | 1.96e-01 | 0.1124 |
| 624 | BDKRB2 | P21T-E | Human | Esophagus | ESCC | 4.36e-16 | 4.09e-01 | 0.1617 |
| 624 | BDKRB2 | P22T-E | Human | Esophagus | ESCC | 2.22e-08 | 1.45e-01 | 0.1236 |
| 624 | BDKRB2 | P23T-E | Human | Esophagus | ESCC | 1.07e-08 | 3.14e-01 | 0.108 |
| 624 | BDKRB2 | P24T-E | Human | Esophagus | ESCC | 9.56e-04 | 1.39e-01 | 0.1287 |
| 624 | BDKRB2 | P26T-E | Human | Esophagus | ESCC | 1.69e-05 | 5.04e-02 | 0.1276 |
| 624 | BDKRB2 | P27T-E | Human | Esophagus | ESCC | 2.33e-03 | 1.37e-01 | 0.1055 |
| 624 | BDKRB2 | P28T-E | Human | Esophagus | ESCC | 2.11e-07 | 1.39e-01 | 0.1149 |
| 624 | BDKRB2 | P31T-E | Human | Esophagus | ESCC | 2.17e-02 | 6.46e-02 | 0.1251 |
| 624 | BDKRB2 | P32T-E | Human | Esophagus | ESCC | 2.70e-06 | 1.48e-01 | 0.1666 |
| 624 | BDKRB2 | P37T-E | Human | Esophagus | ESCC | 1.88e-11 | 2.94e-01 | 0.1371 |
| Page: 1 2 3 |
| Tissue | Expression Dynamics | Abbreviation |
| Esophagus | 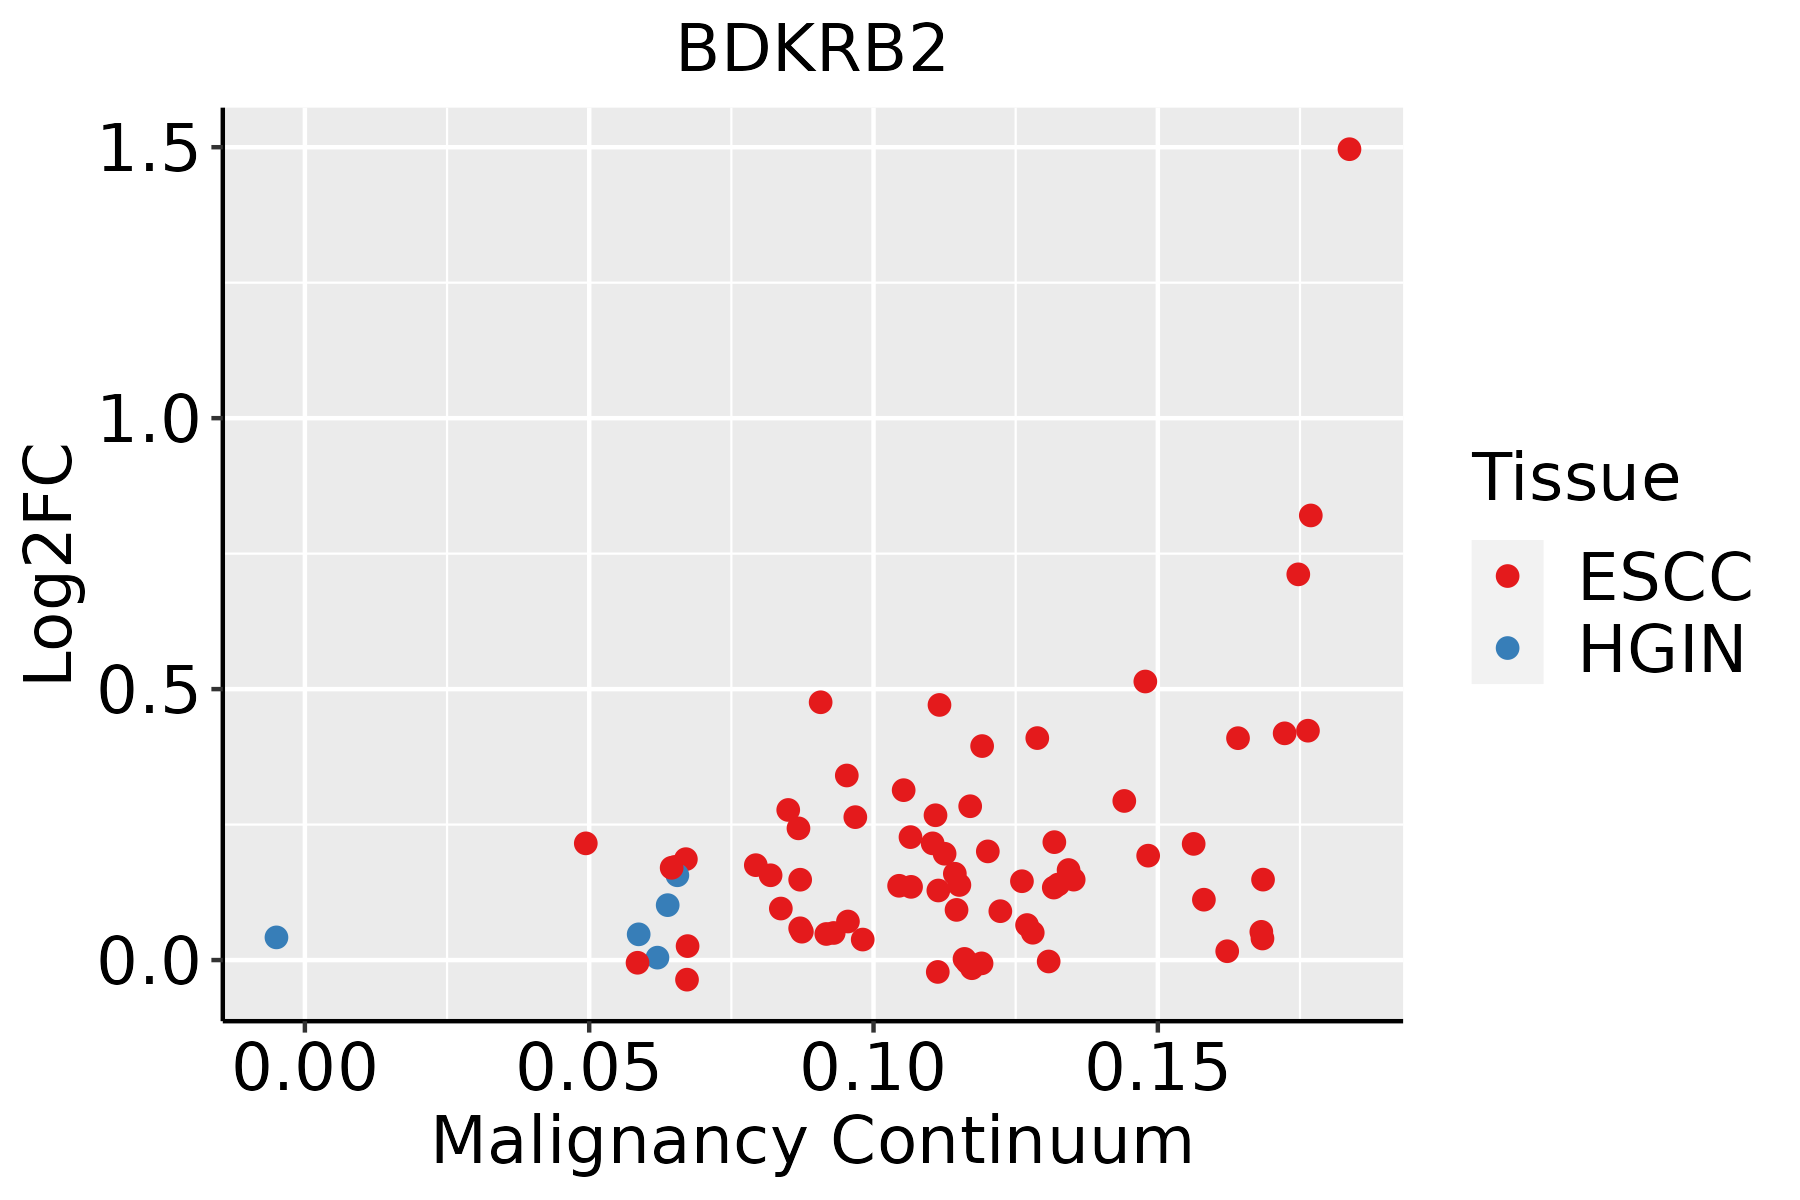 | ESCC: Esophageal squamous cell carcinoma |
| HGIN: High-grade intraepithelial neoplasias | ||
| LGIN: Low-grade intraepithelial neoplasias | ||
| Skin | 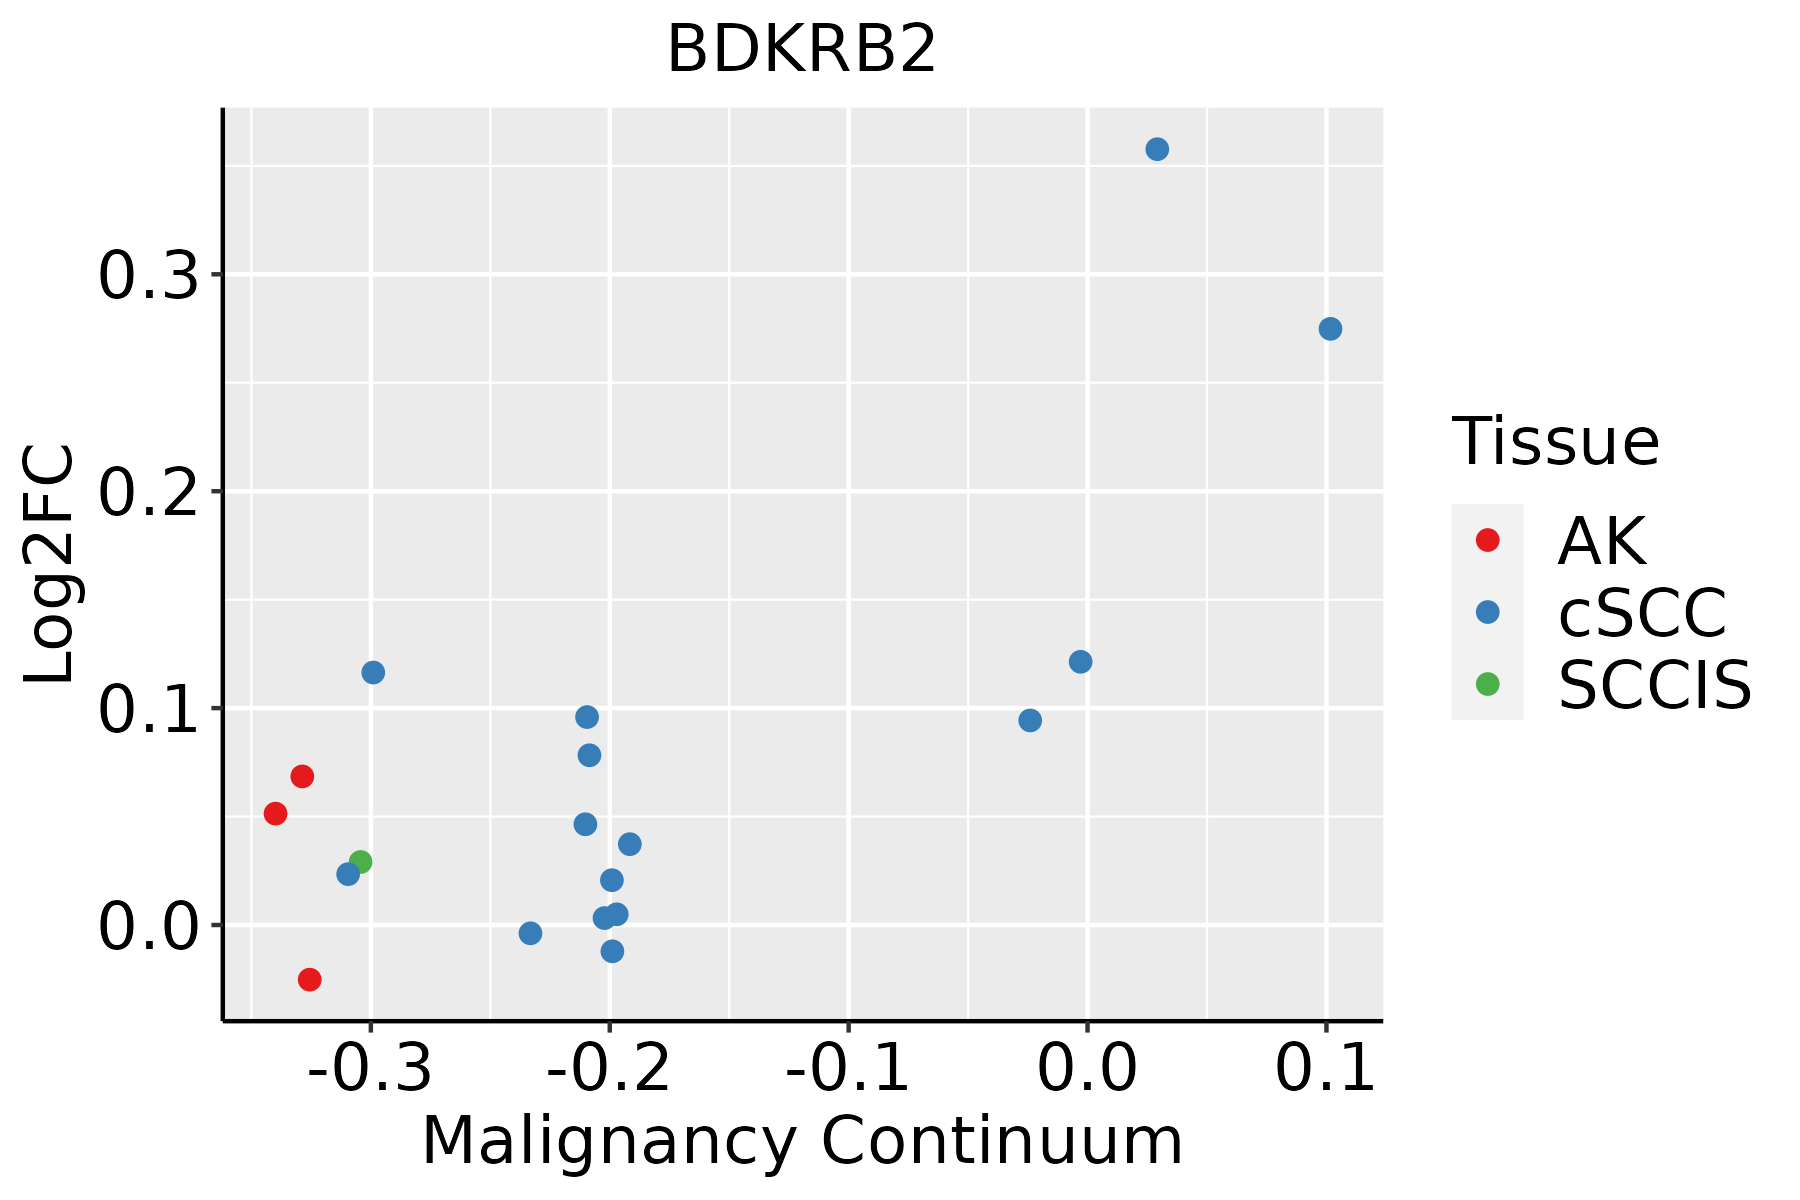 | AK: Actinic keratosis |
| cSCC: Cutaneous squamous cell carcinoma | ||
| SCCIS:squamous cell carcinoma in situ |
| ∗log2FC in expression of this searched gene in stem-like cells from each diseased tissue sample relative to stem-like cells in normal samples in each tissue plotted against the malignancy continuum. Samples are colored based on if they are from different disease stage. |
Top |
Malignant transformation related pathway analysis |
| Find out the enriched GO biological processes and KEGG pathways involved in transition from healthy to precancer to cancer |
| Tissue | Disease Stage | Enriched GO biological Processes |
| Colorectum | AD |  |
| Colorectum | SER |  |
| Colorectum | MSS |  |
| Colorectum | MSI-H |  |
| Colorectum | FAP |  |
| ∗Top 15 enriched GO BP terms are showed in the bar plot of each disease state in each tissue. Each row represents a significant GO biological process which is colored according to the -log10(p.adjust). |
| Page: 1 2 3 4 5 6 7 8 9 |
| GO ID | Tissue | Disease Stage | Description | Gene Ratio | Bg Ratio | pvalue | p.adjust | Count |
| GO:0097193111 | Esophagus | ESCC | intrinsic apoptotic signaling pathway | 222/8552 | 288/18723 | 5.87e-28 | 2.02e-25 | 222 |
| GO:2001233111 | Esophagus | ESCC | regulation of apoptotic signaling pathway | 256/8552 | 356/18723 | 4.11e-24 | 1.04e-21 | 256 |
| GO:0062197111 | Esophagus | ESCC | cellular response to chemical stress | 234/8552 | 337/18723 | 5.37e-19 | 5.97e-17 | 234 |
| GO:2001242111 | Esophagus | ESCC | regulation of intrinsic apoptotic signaling pathway | 128/8552 | 164/18723 | 1.75e-17 | 1.50e-15 | 128 |
| GO:2001234111 | Esophagus | ESCC | negative regulation of apoptotic signaling pathway | 161/8552 | 224/18723 | 1.24e-15 | 8.09e-14 | 161 |
| GO:0072331111 | Esophagus | ESCC | signal transduction by p53 class mediator | 121/8552 | 163/18723 | 9.61e-14 | 4.69e-12 | 121 |
| GO:0010563111 | Esophagus | ESCC | negative regulation of phosphorus metabolic process | 274/8552 | 442/18723 | 2.32e-12 | 9.41e-11 | 274 |
| GO:0045936111 | Esophagus | ESCC | negative regulation of phosphate metabolic process | 273/8552 | 441/18723 | 3.18e-12 | 1.25e-10 | 273 |
| GO:2001243111 | Esophagus | ESCC | negative regulation of intrinsic apoptotic signaling pathway | 78/8552 | 98/18723 | 5.50e-12 | 2.10e-10 | 78 |
| GO:0042326111 | Esophagus | ESCC | negative regulation of phosphorylation | 237/8552 | 385/18723 | 1.86e-10 | 5.33e-09 | 237 |
| GO:0001933111 | Esophagus | ESCC | negative regulation of protein phosphorylation | 213/8552 | 342/18723 | 3.54e-10 | 9.76e-09 | 213 |
| GO:007121419 | Esophagus | ESCC | cellular response to abiotic stimulus | 206/8552 | 331/18723 | 7.52e-10 | 1.88e-08 | 206 |
| GO:010400419 | Esophagus | ESCC | cellular response to environmental stimulus | 206/8552 | 331/18723 | 7.52e-10 | 1.88e-08 | 206 |
| GO:1901796111 | Esophagus | ESCC | regulation of signal transduction by p53 class mediator | 70/8552 | 93/18723 | 5.69e-09 | 1.18e-07 | 70 |
| GO:0072332111 | Esophagus | ESCC | intrinsic apoptotic signaling pathway by p53 class mediator | 59/8552 | 76/18723 | 1.22e-08 | 2.42e-07 | 59 |
| GO:00182099 | Esophagus | ESCC | peptidyl-serine modification | 196/8552 | 338/18723 | 3.07e-06 | 3.47e-05 | 196 |
| GO:001810515 | Esophagus | ESCC | peptidyl-serine phosphorylation | 184/8552 | 315/18723 | 3.22e-06 | 3.61e-05 | 184 |
| GO:00069707 | Esophagus | ESCC | response to osmotic stress | 57/8552 | 84/18723 | 3.26e-05 | 2.70e-04 | 57 |
| GO:00714707 | Esophagus | ESCC | cellular response to osmotic stress | 31/8552 | 41/18723 | 9.32e-05 | 6.68e-04 | 31 |
| GO:1902253110 | Esophagus | ESCC | regulation of intrinsic apoptotic signaling pathway by p53 class mediator | 23/8552 | 29/18723 | 2.25e-04 | 1.40e-03 | 23 |
| Page: 1 2 3 |
| Pathway ID | Tissue | Disease Stage | Description | Gene Ratio | Bg Ratio | pvalue | p.adjust | qvalue | Count |
| hsa0407116 | Esophagus | ESCC | Sphingolipid signaling pathway | 85/4205 | 121/8465 | 3.04e-06 | 1.73e-05 | 8.84e-06 | 85 |
| hsa051425 | Esophagus | ESCC | Chagas disease | 65/4205 | 102/8465 | 2.81e-03 | 7.59e-03 | 3.89e-03 | 65 |
| hsa0481028 | Esophagus | ESCC | Regulation of actin cytoskeleton | 133/4205 | 229/8465 | 5.94e-03 | 1.48e-02 | 7.56e-03 | 133 |
| hsa0407117 | Esophagus | ESCC | Sphingolipid signaling pathway | 85/4205 | 121/8465 | 3.04e-06 | 1.73e-05 | 8.84e-06 | 85 |
| hsa0514213 | Esophagus | ESCC | Chagas disease | 65/4205 | 102/8465 | 2.81e-03 | 7.59e-03 | 3.89e-03 | 65 |
| hsa04810112 | Esophagus | ESCC | Regulation of actin cytoskeleton | 133/4205 | 229/8465 | 5.94e-03 | 1.48e-02 | 7.56e-03 | 133 |
| Page: 1 |
Top |
Cell-cell communication analysis |
| Identification of potential cell-cell interactions between two cell types and their ligand-receptor pairs for different disease states |
| Ligand | Receptor | LRpair | Pathway | Tissue | Disease Stage |
| Page: 1 |
Top |
Single-cell gene regulatory network inference analysis |
| Find out the significant the regulons (TFs) and the target genes of each regulon across cell types for different disease states |
| TF | Cell Type | Tissue | Disease Stage | Target Gene | RSS | Regulon Activity |
| ∗The dot plots of a searched regulon are shown for all cell subpopulations in each disease state of each tissue based on the regulon specific score inferred using pySCENIC and by calculating the average expression. |
| Page: 1 |
Top |
Somatic mutation of malignant transformation related genes |
| Annotation of somatic variants for genes involved in malignant transformation |
| Hugo Symbol | Variant Class | Variant Classification | dbSNP RS | HGVSc | HGVSp | HGVSp Short | SWISSPROT | BIOTYPE | SIFT | PolyPhen | Tumor Sample Barcode | Tissue | Histology | Sex | Age | Stage | Therapy Types | Drugs | Outcome |
| BDKRB2 | SNV | Missense_Mutation | c.1133G>T | p.Arg378Leu | p.R378L | P30411 | protein_coding | tolerated(0.16) | benign(0.071) | TCGA-A2-A04Y-01 | Breast | breast invasive carcinoma | Female | <65 | I/II | Chemotherapy | cytoxan | SD | |
| BDKRB2 | SNV | Missense_Mutation | rs776833029 | c.79N>A | p.Asp27Asn | p.D27N | P30411 | protein_coding | tolerated_low_confidence(0.37) | benign(0.027) | TCGA-AN-A046-01 | Breast | breast invasive carcinoma | Female | >=65 | I/II | Unknown | Unknown | SD |
| BDKRB2 | SNV | Missense_Mutation | c.731N>T | p.Thr244Met | p.T244M | P30411 | protein_coding | deleterious(0) | probably_damaging(0.982) | TCGA-AN-A046-01 | Breast | breast invasive carcinoma | Female | >=65 | I/II | Unknown | Unknown | SD | |
| BDKRB2 | SNV | Missense_Mutation | rs751331696 | c.1132C>T | p.Arg378Cys | p.R378C | P30411 | protein_coding | deleterious(0.04) | possibly_damaging(0.676) | TCGA-LL-A8F5-01 | Breast | breast invasive carcinoma | Female | <65 | I/II | Chemotherapy | cyclophosphamide | SD |
| BDKRB2 | insertion | In_Frame_Ins | novel | c.394_395insGCACCCTCCACCCTC | p.Val132delinsGlyThrLeuHisProLeu | p.V132delinsGTLHPL | P30411 | protein_coding | TCGA-A8-A07G-01 | Breast | breast invasive carcinoma | Female | >=65 | I/II | Chemotherapy | 5-fluorouracil | CR | ||
| BDKRB2 | insertion | Frame_Shift_Ins | novel | c.397_398insGCCACAG | p.Val133GlyfsTer74 | p.V133Gfs*74 | P30411 | protein_coding | TCGA-A8-A07G-01 | Breast | breast invasive carcinoma | Female | >=65 | I/II | Chemotherapy | 5-fluorouracil | CR | ||
| BDKRB2 | SNV | Missense_Mutation | c.1032G>T | p.Trp344Cys | p.W344C | P30411 | protein_coding | tolerated(0.11) | benign(0.027) | TCGA-AA-3663-01 | Colorectum | colon adenocarcinoma | Male | <65 | I/II | Unknown | Unknown | SD | |
| BDKRB2 | SNV | Missense_Mutation | rs200683377 | c.241N>A | p.Val81Ile | p.V81I | P30411 | protein_coding | deleterious(0.05) | possibly_damaging(0.451) | TCGA-AA-3672-01 | Colorectum | colon adenocarcinoma | Female | >=65 | III/IV | Unknown | Unknown | SD |
| BDKRB2 | SNV | Missense_Mutation | novel | c.596A>C | p.Lys199Thr | p.K199T | P30411 | protein_coding | tolerated(0.27) | benign(0.142) | TCGA-CA-6717-01 | Colorectum | colon adenocarcinoma | Male | <65 | I/II | Chemotherapy | oxaliplatin | CR |
| BDKRB2 | SNV | Missense_Mutation | c.731C>T | p.Thr244Met | p.T244M | P30411 | protein_coding | deleterious(0) | probably_damaging(0.982) | TCGA-F4-6806-01 | Colorectum | colon adenocarcinoma | Female | <65 | I/II | Chemotherapy | irinotecan | PD |
| Page: 1 2 3 4 5 6 |
Top |
Related drugs of malignant transformation related genes |
| Identification of chemicals and drugs interact with genes involved in malignant transfromation |
| (DGIdb 4.0) |
| Entrez ID | Symbol | Category | Interaction Types | Drug Claim Name | Drug Name | PMIDs |
| 624 | BDKRB2 | DRUGGABLE GENOME, G PROTEIN COUPLED RECEPTOR | ICATIBANT | ICATIBANT | ||
| 624 | BDKRB2 | DRUGGABLE GENOME, G PROTEIN COUPLED RECEPTOR | antagonist | 135652339 | ||
| 624 | BDKRB2 | DRUGGABLE GENOME, G PROTEIN COUPLED RECEPTOR | agonist | 381744937 | ||
| 624 | BDKRB2 | DRUGGABLE GENOME, G PROTEIN COUPLED RECEPTOR | Fasitibant chloride | |||
| 624 | BDKRB2 | DRUGGABLE GENOME, G PROTEIN COUPLED RECEPTOR | antagonist | 135651328 | ||
| 624 | BDKRB2 | DRUGGABLE GENOME, G PROTEIN COUPLED RECEPTOR | lisinopril | LISINOPRIL | 12522467 | |
| 624 | BDKRB2 | DRUGGABLE GENOME, G PROTEIN COUPLED RECEPTOR | agonist | 178100615 | ||
| 624 | BDKRB2 | DRUGGABLE GENOME, G PROTEIN COUPLED RECEPTOR | antagonist | 135652220 | ||
| 624 | BDKRB2 | DRUGGABLE GENOME, G PROTEIN COUPLED RECEPTOR | antagonist | 135650286 | ||
| 624 | BDKRB2 | DRUGGABLE GENOME, G PROTEIN COUPLED RECEPTOR | agonist | 135651794 |
| Page: 1 2 3 4 5 |

Copyright 2023-Present -The University of Texas Health Science Center at Houston |