
|
|||||
|
 | |
| |
| |
| |
| |
| |
|
Gene: BDH2 |
Gene summary for BDH2 |
| Gene information | Species | Human | Gene symbol | BDH2 | Gene ID | 56898 |
| Gene name | 3-hydroxybutyrate dehydrogenase 2 | |
| Gene Alias | DHRS6 | |
| Cytomap | 4q24 | |
| Gene Type | protein-coding | GO ID | GO:0006082 | UniProtAcc | A0A024RDG9 |
Top |
Malignant transformation analysis |
| Identification of the aberrant gene expression in precancerous and cancerous lesions by comparing the gene expression of stem-like cells in diseased tissues with normal stem cells |
| Entrez ID | Symbol | Replicates | Species | Organ | Tissue | Adj P-value | Log2FC | Malignancy |
| 56898 | BDH2 | LZE3D | Human | Esophagus | HGIN | 6.81e-03 | 6.87e-01 | 0.0668 |
| 56898 | BDH2 | LZE4T | Human | Esophagus | ESCC | 7.27e-03 | -5.06e-02 | 0.0811 |
| 56898 | BDH2 | LZE7T | Human | Esophagus | ESCC | 7.63e-03 | 1.61e-02 | 0.0667 |
| 56898 | BDH2 | LZE8T | Human | Esophagus | ESCC | 1.50e-09 | 1.86e-01 | 0.067 |
| 56898 | BDH2 | LZE24T | Human | Esophagus | ESCC | 6.42e-15 | 3.62e-01 | 0.0596 |
| 56898 | BDH2 | LZE21T | Human | Esophagus | ESCC | 1.40e-02 | 4.56e-02 | 0.0655 |
| 56898 | BDH2 | LZE6T | Human | Esophagus | ESCC | 2.59e-02 | 5.90e-02 | 0.0845 |
| 56898 | BDH2 | P1T-E | Human | Esophagus | ESCC | 9.85e-06 | 2.21e-01 | 0.0875 |
| 56898 | BDH2 | P2T-E | Human | Esophagus | ESCC | 7.73e-36 | 5.94e-01 | 0.1177 |
| 56898 | BDH2 | P4T-E | Human | Esophagus | ESCC | 2.59e-27 | 7.22e-01 | 0.1323 |
| 56898 | BDH2 | P5T-E | Human | Esophagus | ESCC | 1.00e-04 | -1.46e-02 | 0.1327 |
| 56898 | BDH2 | P8T-E | Human | Esophagus | ESCC | 2.83e-16 | 3.73e-01 | 0.0889 |
| 56898 | BDH2 | P9T-E | Human | Esophagus | ESCC | 1.28e-02 | 2.35e-01 | 0.1131 |
| 56898 | BDH2 | P10T-E | Human | Esophagus | ESCC | 9.85e-16 | 8.80e-02 | 0.116 |
| 56898 | BDH2 | P11T-E | Human | Esophagus | ESCC | 1.19e-13 | 2.41e-01 | 0.1426 |
| 56898 | BDH2 | P12T-E | Human | Esophagus | ESCC | 2.90e-24 | 5.36e-01 | 0.1122 |
| 56898 | BDH2 | P15T-E | Human | Esophagus | ESCC | 3.86e-16 | 2.49e-01 | 0.1149 |
| 56898 | BDH2 | P16T-E | Human | Esophagus | ESCC | 1.59e-23 | 4.28e-01 | 0.1153 |
| 56898 | BDH2 | P19T-E | Human | Esophagus | ESCC | 1.27e-03 | 4.63e-01 | 0.1662 |
| 56898 | BDH2 | P20T-E | Human | Esophagus | ESCC | 4.50e-18 | 1.41e-01 | 0.1124 |
| Page: 1 2 3 4 |
| Tissue | Expression Dynamics | Abbreviation |
| Esophagus | 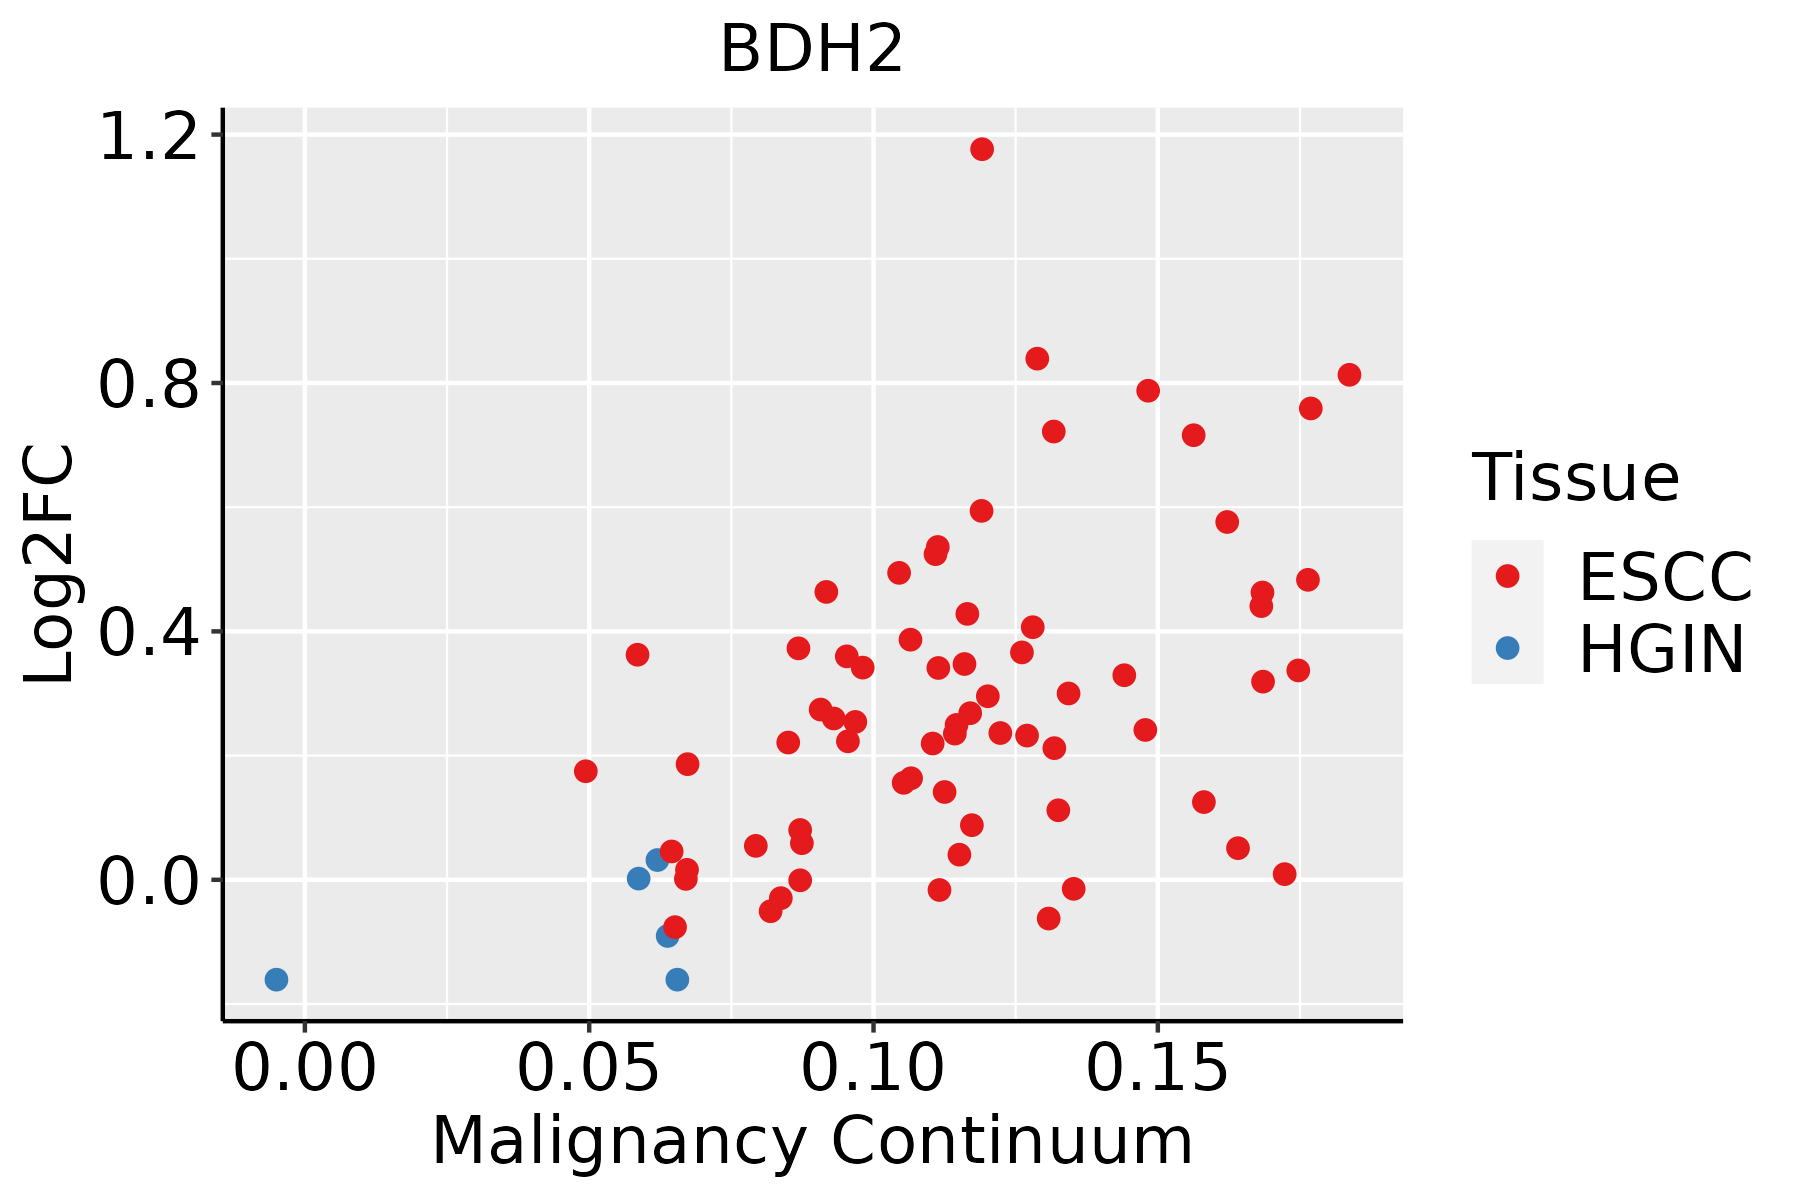 | ESCC: Esophageal squamous cell carcinoma |
| HGIN: High-grade intraepithelial neoplasias | ||
| LGIN: Low-grade intraepithelial neoplasias | ||
| Thyroid | 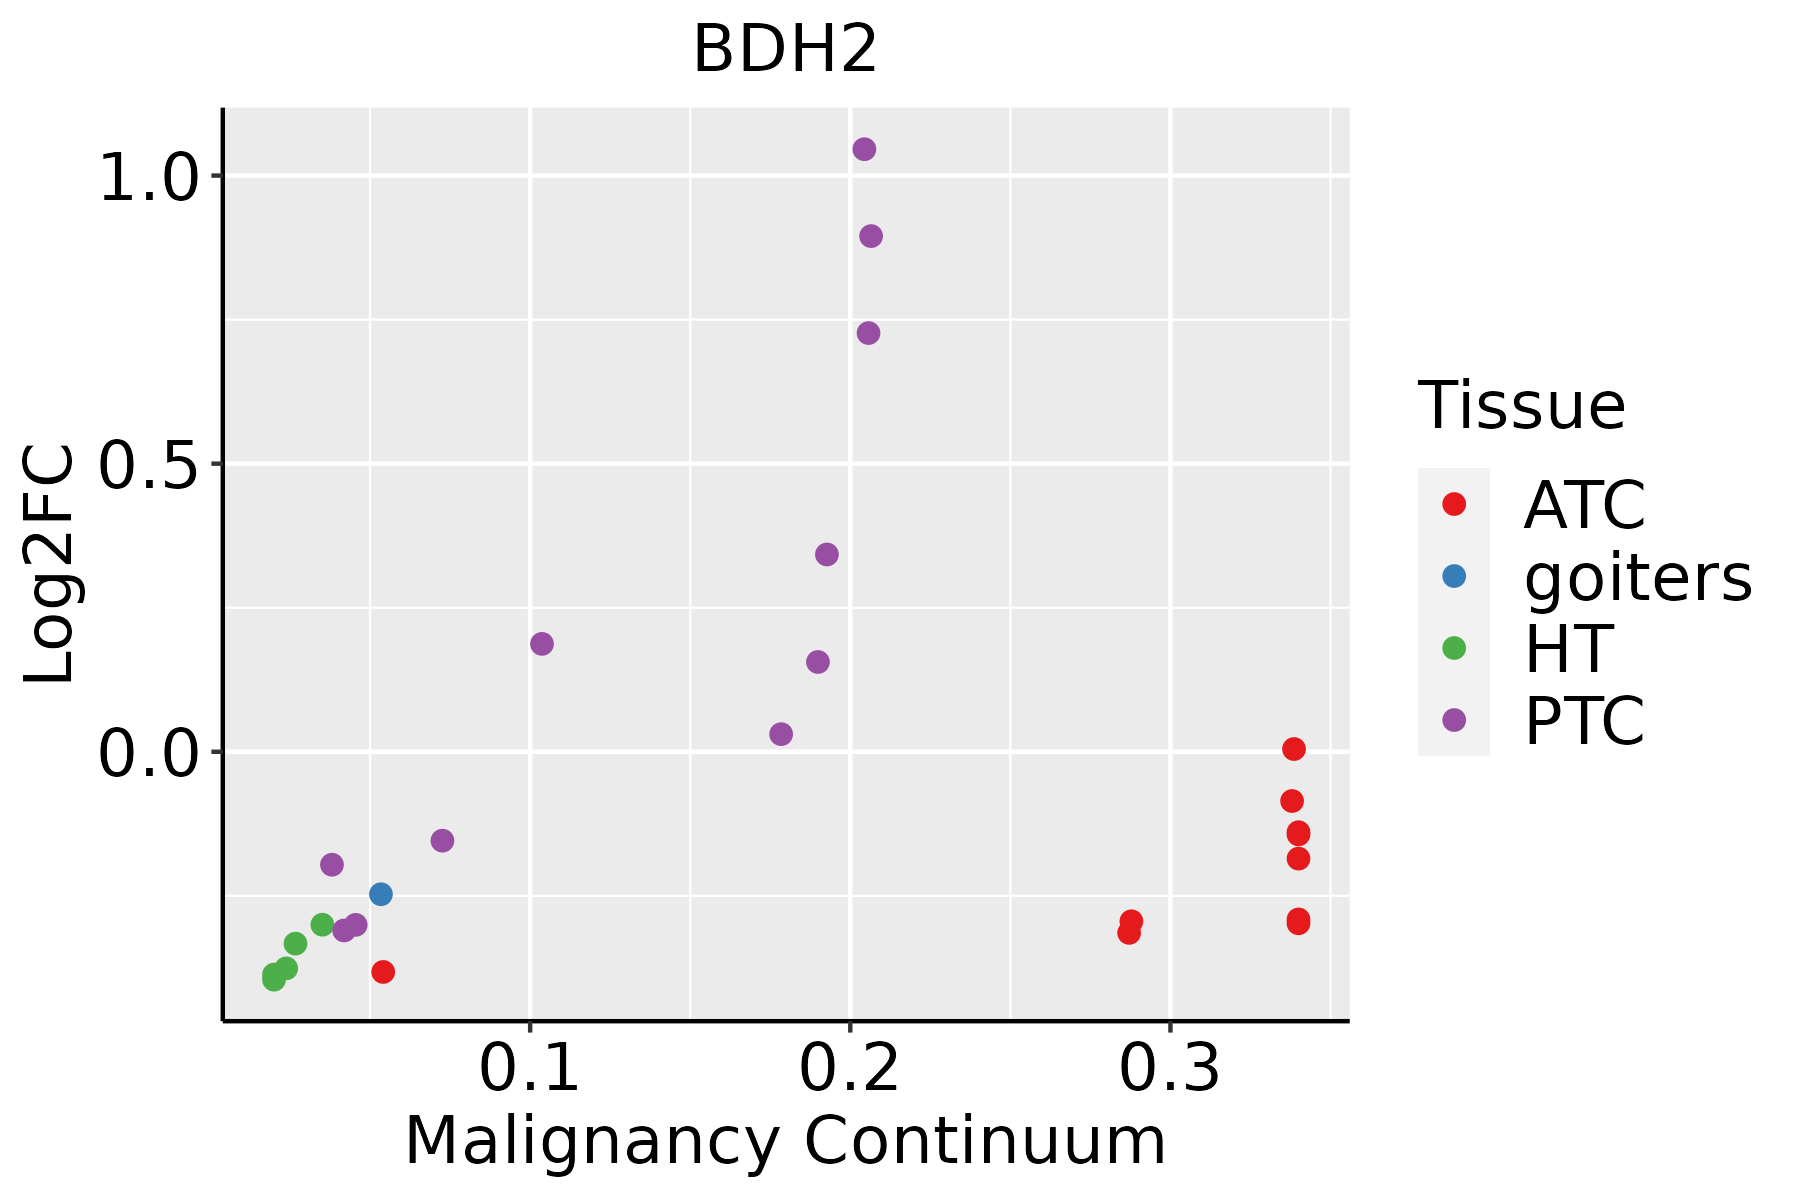 | ATC: Anaplastic thyroid cancer |
| HT: Hashimoto's thyroiditis | ||
| PTC: Papillary thyroid cancer |
| ∗log2FC in expression of this searched gene in stem-like cells from each diseased tissue sample relative to stem-like cells in normal samples in each tissue plotted against the malignancy continuum. Samples are colored based on if they are from different disease stage. |
Top |
Malignant transformation related pathway analysis |
| Find out the enriched GO biological processes and KEGG pathways involved in transition from healthy to precancer to cancer |
| Tissue | Disease Stage | Enriched GO biological Processes |
| Colorectum | AD |  |
| Colorectum | SER |  |
| Colorectum | MSS |  |
| Colorectum | MSI-H |  |
| Colorectum | FAP |  |
| ∗Top 15 enriched GO BP terms are showed in the bar plot of each disease state in each tissue. Each row represents a significant GO biological process which is colored according to the -log10(p.adjust). |
| Page: 1 2 3 4 5 6 7 8 9 |
| GO ID | Tissue | Disease Stage | Description | Gene Ratio | Bg Ratio | pvalue | p.adjust | Count |
| GO:00193958 | Esophagus | ESCC | fatty acid oxidation | 69/8552 | 103/18723 | 9.95e-06 | 9.44e-05 | 69 |
| GO:00344407 | Esophagus | ESCC | lipid oxidation | 71/8552 | 108/18723 | 2.00e-05 | 1.74e-04 | 71 |
| GO:005507617 | Esophagus | ESCC | transition metal ion homeostasis | 87/8552 | 138/18723 | 2.85e-05 | 2.37e-04 | 87 |
| GO:00090628 | Esophagus | ESCC | fatty acid catabolic process | 66/8552 | 100/18723 | 3.21e-05 | 2.66e-04 | 66 |
| GO:00066318 | Esophagus | ESCC | fatty acid metabolic process | 217/8552 | 390/18723 | 4.21e-05 | 3.39e-04 | 217 |
| GO:00066358 | Esophagus | ESCC | fatty acid beta-oxidation | 50/8552 | 74/18723 | 1.16e-04 | 8.04e-04 | 50 |
| GO:00723297 | Esophagus | ESCC | monocarboxylic acid catabolic process | 74/8552 | 122/18723 | 6.03e-04 | 3.27e-03 | 74 |
| GO:00442427 | Esophagus | ESCC | cellular lipid catabolic process | 121/8552 | 214/18723 | 8.63e-04 | 4.43e-03 | 121 |
| GO:00442827 | Esophagus | ESCC | small molecule catabolic process | 201/8552 | 376/18723 | 1.35e-03 | 6.41e-03 | 201 |
| GO:00550729 | Esophagus | ESCC | iron ion homeostasis | 52/8552 | 85/18723 | 2.86e-03 | 1.21e-02 | 52 |
| GO:00302586 | Esophagus | ESCC | lipid modification | 116/8552 | 212/18723 | 4.90e-03 | 1.89e-02 | 116 |
| GO:00330132 | Esophagus | ESCC | tetrapyrrole metabolic process | 37/8552 | 59/18723 | 6.23e-03 | 2.29e-02 | 37 |
| GO:00424401 | Esophagus | ESCC | pigment metabolic process | 50/8552 | 84/18723 | 7.34e-03 | 2.64e-02 | 50 |
| GO:00160427 | Esophagus | ESCC | lipid catabolic process | 168/8552 | 320/18723 | 7.97e-03 | 2.84e-02 | 168 |
| GO:00421681 | Esophagus | ESCC | heme metabolic process | 27/8552 | 42/18723 | 1.16e-02 | 3.90e-02 | 27 |
| GO:005507619 | Thyroid | HT | transition metal ion homeostasis | 18/1272 | 138/18723 | 5.75e-03 | 3.72e-02 | 18 |
| GO:0055076110 | Thyroid | PTC | transition metal ion homeostasis | 62/5968 | 138/18723 | 8.66e-04 | 5.30e-03 | 62 |
| GO:005507210 | Thyroid | PTC | iron ion homeostasis | 39/5968 | 85/18723 | 4.71e-03 | 2.21e-02 | 39 |
| GO:005507632 | Thyroid | ATC | transition metal ion homeostasis | 66/6293 | 138/18723 | 3.64e-04 | 2.25e-03 | 66 |
| GO:005507214 | Thyroid | ATC | iron ion homeostasis | 41/6293 | 85/18723 | 3.62e-03 | 1.58e-02 | 41 |
| Page: 1 2 |
| Pathway ID | Tissue | Disease Stage | Description | Gene Ratio | Bg Ratio | pvalue | p.adjust | qvalue | Count |
| Page: 1 |
Top |
Cell-cell communication analysis |
| Identification of potential cell-cell interactions between two cell types and their ligand-receptor pairs for different disease states |
| Ligand | Receptor | LRpair | Pathway | Tissue | Disease Stage |
| Page: 1 |
Top |
Single-cell gene regulatory network inference analysis |
| Find out the significant the regulons (TFs) and the target genes of each regulon across cell types for different disease states |
| TF | Cell Type | Tissue | Disease Stage | Target Gene | RSS | Regulon Activity |
| ∗The dot plots of a searched regulon are shown for all cell subpopulations in each disease state of each tissue based on the regulon specific score inferred using pySCENIC and by calculating the average expression. |
| Page: 1 |
Top |
Somatic mutation of malignant transformation related genes |
| Annotation of somatic variants for genes involved in malignant transformation |
| Hugo Symbol | Variant Class | Variant Classification | dbSNP RS | HGVSc | HGVSp | HGVSp Short | SWISSPROT | BIOTYPE | SIFT | PolyPhen | Tumor Sample Barcode | Tissue | Histology | Sex | Age | Stage | Therapy Types | Drugs | Outcome |
| BDH2 | SNV | Missense_Mutation | novel | c.490G>T | p.Asp164Tyr | p.D164Y | Q9BUT1 | protein_coding | deleterious(0) | probably_damaging(1) | TCGA-A5-A0G2-01 | Endometrium | uterine corpus endometrioid carcinoma | Female | <65 | III/IV | Unknown | Unknown | SD |
| BDH2 | SNV | Missense_Mutation | novel | c.223N>A | p.Leu75Ile | p.L75I | Q9BUT1 | protein_coding | tolerated(0.81) | benign(0.003) | TCGA-AP-A059-01 | Endometrium | uterine corpus endometrioid carcinoma | Female | >=65 | I/II | Unknown | Unknown | SD |
| BDH2 | SNV | Missense_Mutation | c.551N>A | p.Ser184Tyr | p.S184Y | Q9BUT1 | protein_coding | deleterious(0) | probably_damaging(1) | TCGA-B5-A3FA-01 | Endometrium | uterine corpus endometrioid carcinoma | Female | >=65 | I/II | Unknown | Unknown | SD | |
| BDH2 | SNV | Missense_Mutation | c.689C>A | p.Ala230Asp | p.A230D | Q9BUT1 | protein_coding | tolerated(0.05) | benign(0.182) | TCGA-BS-A0UF-01 | Endometrium | uterine corpus endometrioid carcinoma | Female | >=65 | I/II | Unknown | Unknown | SD | |
| BDH2 | SNV | Missense_Mutation | c.551C>A | p.Ser184Tyr | p.S184Y | Q9BUT1 | protein_coding | deleterious(0) | probably_damaging(1) | TCGA-D1-A17Q-01 | Endometrium | uterine corpus endometrioid carcinoma | Female | <65 | I/II | Unknown | Unknown | SD | |
| BDH2 | SNV | Missense_Mutation | c.533G>T | p.Gly178Val | p.G178V | Q9BUT1 | protein_coding | deleterious(0) | probably_damaging(0.957) | TCGA-38-4632-01 | Lung | lung adenocarcinoma | Male | <65 | III/IV | Chemotherapy | gemcitabine | PD | |
| BDH2 | SNV | Missense_Mutation | c.512N>T | p.Arg171Met | p.R171M | Q9BUT1 | protein_coding | deleterious(0) | probably_damaging(1) | TCGA-97-8547-01 | Lung | lung adenocarcinoma | Female | >=65 | III/IV | Chemotherapy | taxol | CR | |
| BDH2 | SNV | Missense_Mutation | novel | c.89G>T | p.Gly30Val | p.G30V | Q9BUT1 | protein_coding | deleterious(0) | probably_damaging(1) | TCGA-CN-6024-01 | Oral cavity | head & neck squamous cell carcinoma | Male | >=65 | I/II | Unknown | Unknown | PD |
| Page: 1 |
Top |
Related drugs of malignant transformation related genes |
| Identification of chemicals and drugs interact with genes involved in malignant transfromation |
| (DGIdb 4.0) |
| Entrez ID | Symbol | Category | Interaction Types | Drug Claim Name | Drug Name | PMIDs |
| Page: 1 |

Copyright 2023-Present -The University of Texas Health Science Center at Houston |