
|
|||||
|
 | |
| |
| |
| |
| |
| |
|
Gene: BDH1 |
Gene summary for BDH1 |
| Gene information | Species | Human | Gene symbol | BDH1 | Gene ID | 622 |
| Gene name | 3-hydroxybutyrate dehydrogenase 1 | |
| Gene Alias | BDH | |
| Cytomap | 3q29 | |
| Gene Type | protein-coding | GO ID | GO:0008150 | UniProtAcc | Q02338 |
Top |
Malignant transformation analysis |
| Identification of the aberrant gene expression in precancerous and cancerous lesions by comparing the gene expression of stem-like cells in diseased tissues with normal stem cells |
| Entrez ID | Symbol | Replicates | Species | Organ | Tissue | Adj P-value | Log2FC | Malignancy |
| 622 | BDH1 | LZE2T | Human | Esophagus | ESCC | 1.11e-02 | 5.45e-01 | 0.082 |
| 622 | BDH1 | LZE4T | Human | Esophagus | ESCC | 1.56e-10 | 1.64e-01 | 0.0811 |
| 622 | BDH1 | LZE7T | Human | Esophagus | ESCC | 1.75e-05 | 4.28e-01 | 0.0667 |
| 622 | BDH1 | LZE21D1 | Human | Esophagus | HGIN | 1.22e-03 | 2.87e-01 | 0.0632 |
| 622 | BDH1 | LZE22D1 | Human | Esophagus | HGIN | 3.56e-09 | 2.02e-01 | 0.0595 |
| 622 | BDH1 | LZE24T | Human | Esophagus | ESCC | 1.07e-15 | 5.17e-01 | 0.0596 |
| 622 | BDH1 | LZE21T | Human | Esophagus | ESCC | 5.04e-09 | 6.84e-01 | 0.0655 |
| 622 | BDH1 | P1T-E | Human | Esophagus | ESCC | 1.57e-06 | 4.78e-01 | 0.0875 |
| 622 | BDH1 | P2T-E | Human | Esophagus | ESCC | 1.73e-46 | 9.65e-01 | 0.1177 |
| 622 | BDH1 | P4T-E | Human | Esophagus | ESCC | 5.56e-40 | 1.03e+00 | 0.1323 |
| 622 | BDH1 | P5T-E | Human | Esophagus | ESCC | 2.09e-10 | 3.13e-03 | 0.1327 |
| 622 | BDH1 | P8T-E | Human | Esophagus | ESCC | 5.42e-21 | 3.50e-01 | 0.0889 |
| 622 | BDH1 | P9T-E | Human | Esophagus | ESCC | 3.54e-24 | 5.95e-01 | 0.1131 |
| 622 | BDH1 | P10T-E | Human | Esophagus | ESCC | 5.84e-31 | 6.75e-01 | 0.116 |
| 622 | BDH1 | P11T-E | Human | Esophagus | ESCC | 3.36e-06 | 3.46e-01 | 0.1426 |
| 622 | BDH1 | P12T-E | Human | Esophagus | ESCC | 5.37e-15 | 3.25e-01 | 0.1122 |
| 622 | BDH1 | P15T-E | Human | Esophagus | ESCC | 1.01e-17 | 2.93e-01 | 0.1149 |
| 622 | BDH1 | P16T-E | Human | Esophagus | ESCC | 1.44e-30 | 6.22e-01 | 0.1153 |
| 622 | BDH1 | P17T-E | Human | Esophagus | ESCC | 7.05e-07 | 2.07e-01 | 0.1278 |
| 622 | BDH1 | P19T-E | Human | Esophagus | ESCC | 2.33e-02 | 7.06e-01 | 0.1662 |
| Page: 1 2 3 4 5 |
| Tissue | Expression Dynamics | Abbreviation |
| Esophagus | 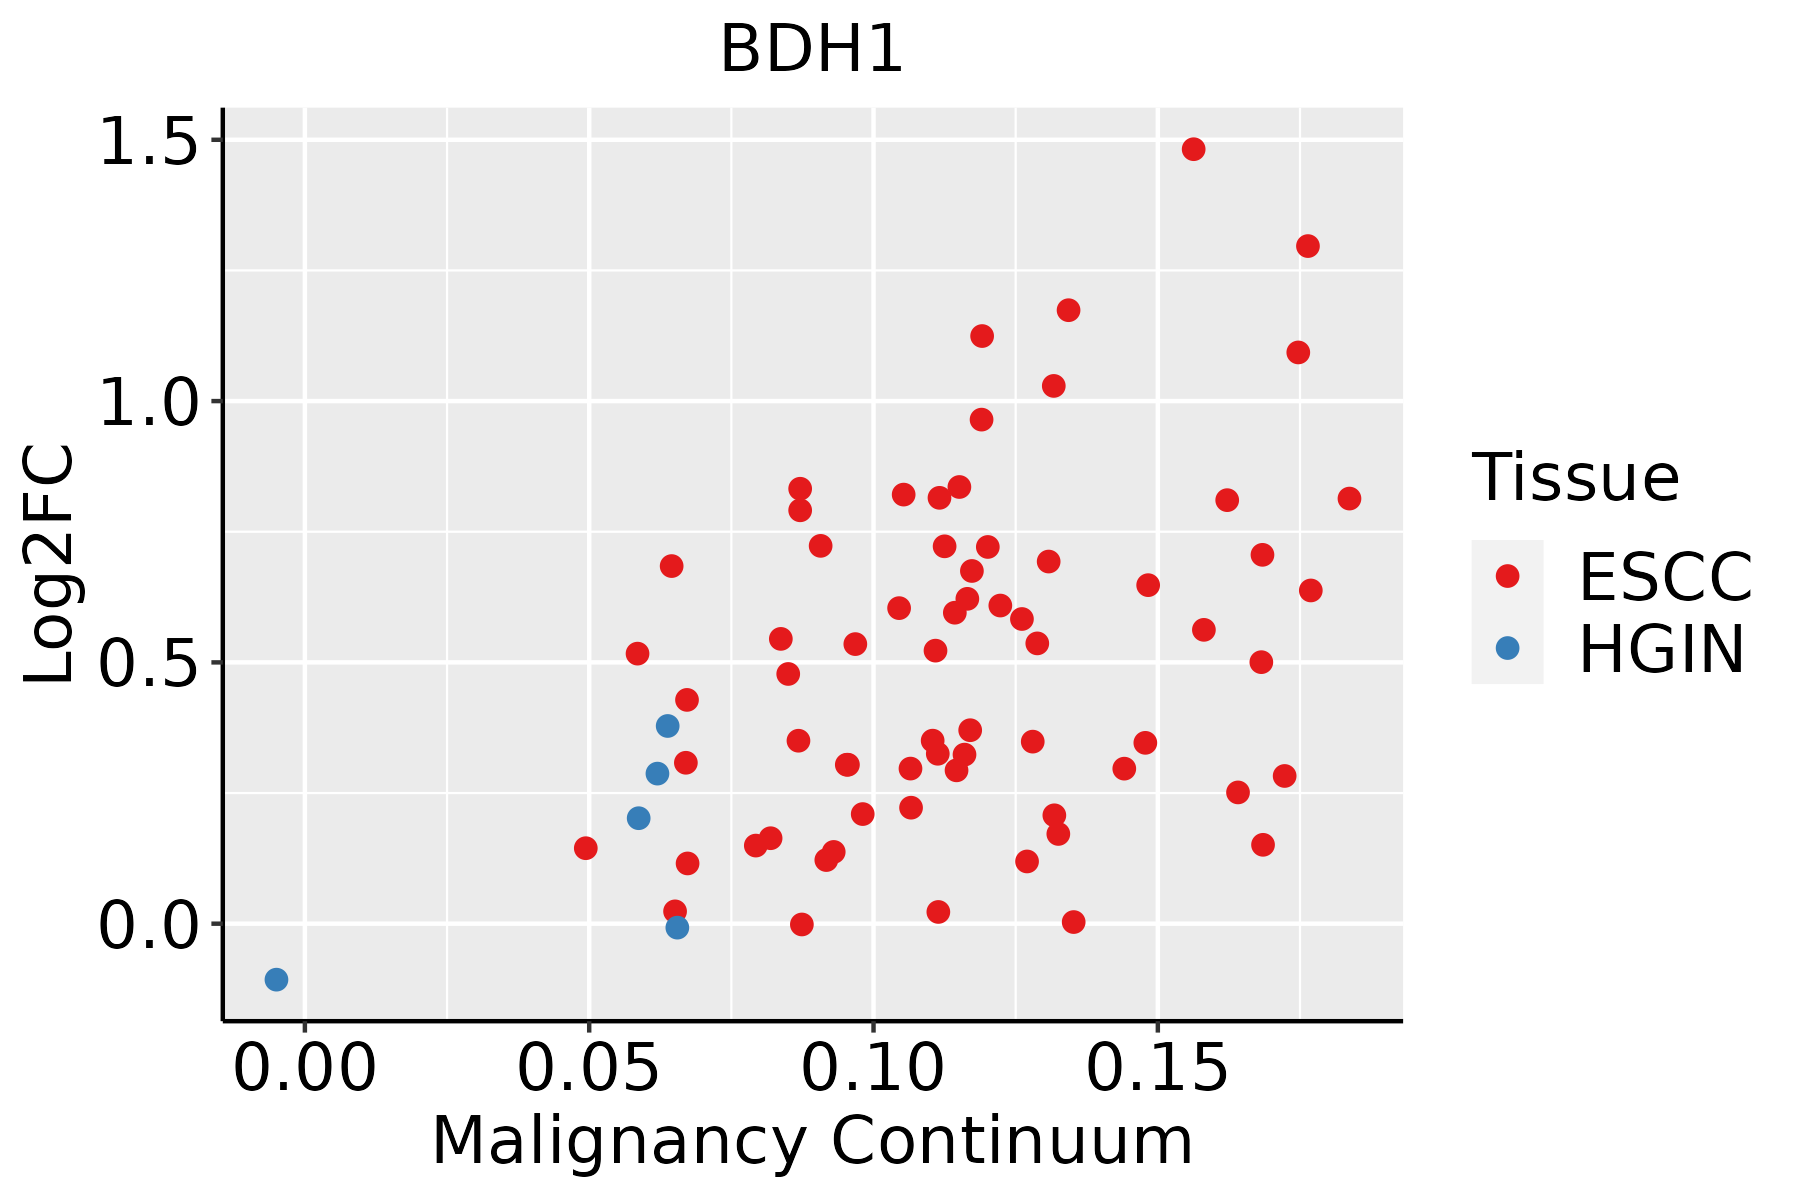 | ESCC: Esophageal squamous cell carcinoma |
| HGIN: High-grade intraepithelial neoplasias | ||
| LGIN: Low-grade intraepithelial neoplasias | ||
| Liver |  | HCC: Hepatocellular carcinoma |
| NAFLD: Non-alcoholic fatty liver disease | ||
| Oral Cavity | 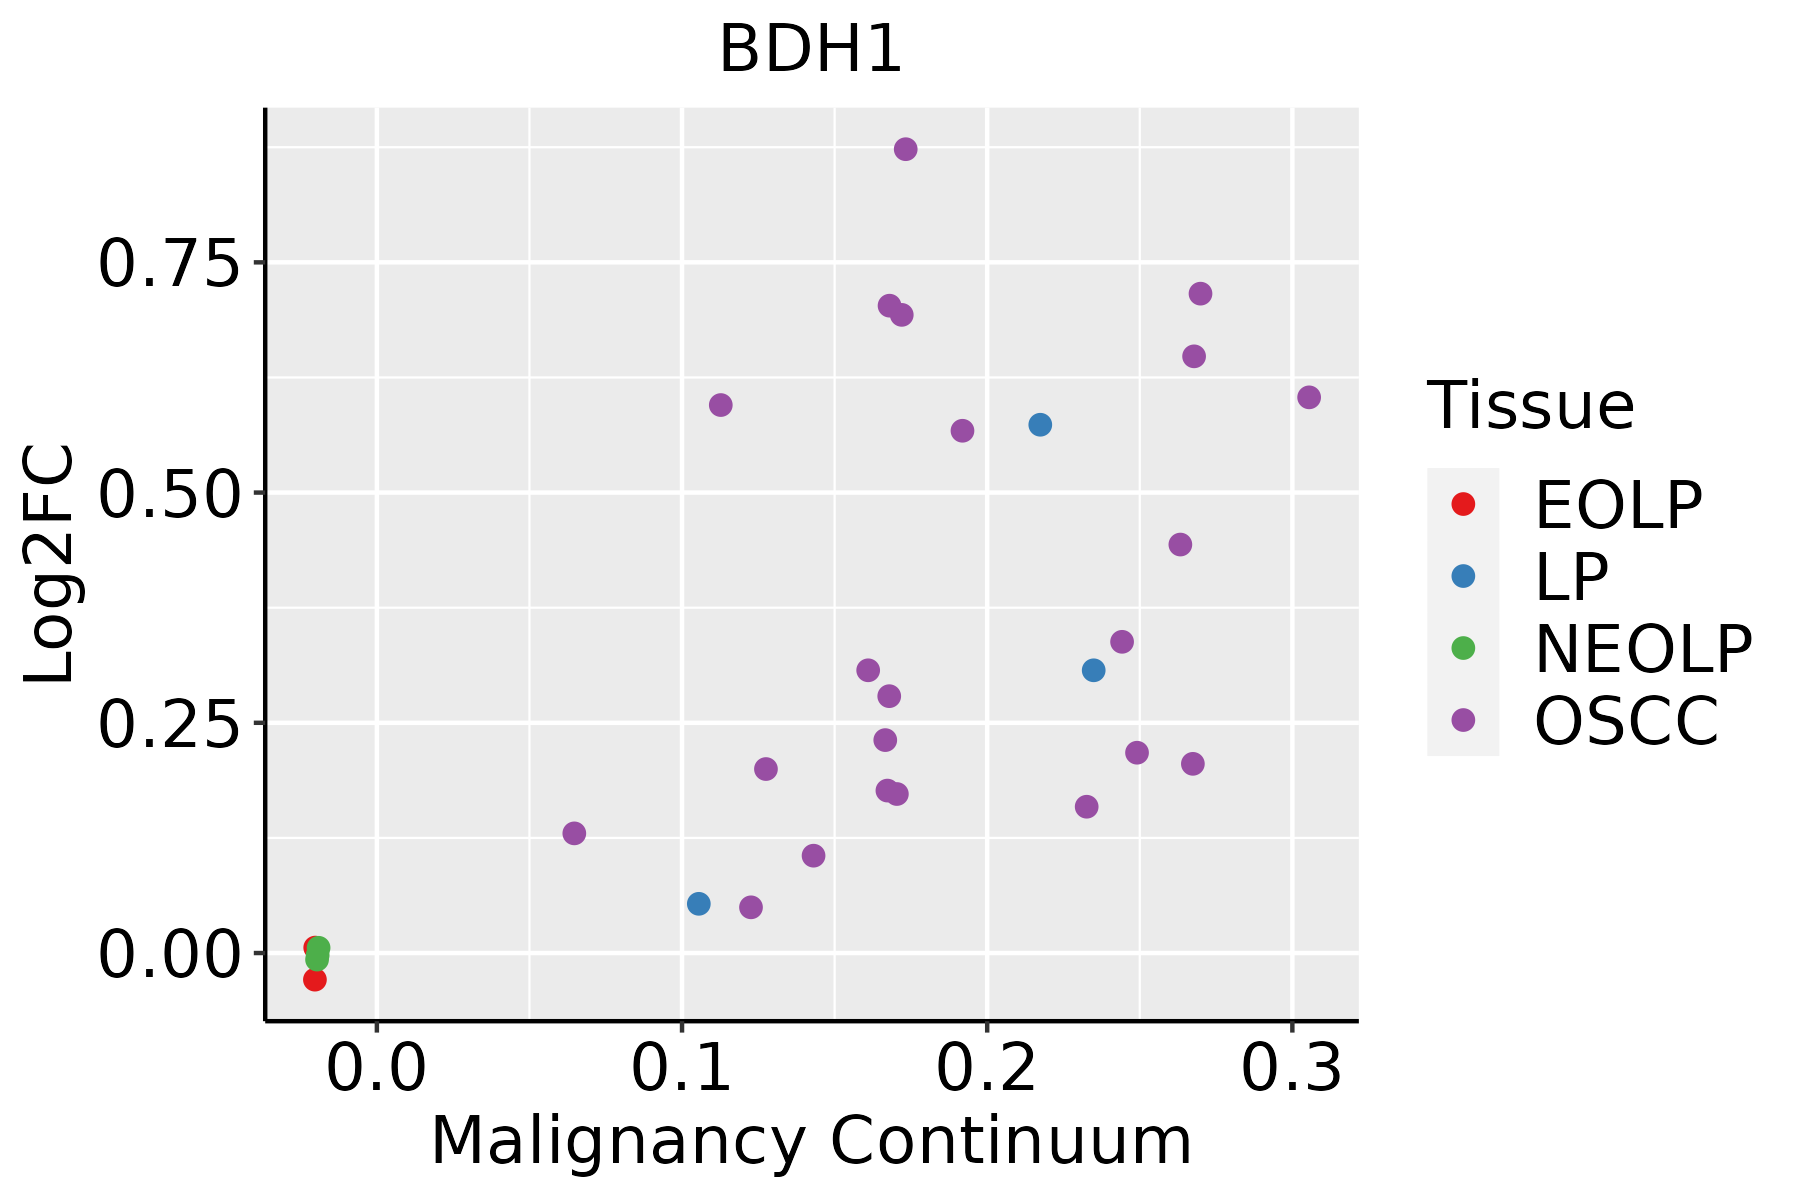 | EOLP: Erosive Oral lichen planus |
| LP: leukoplakia | ||
| NEOLP: Non-erosive oral lichen planus | ||
| OSCC: Oral squamous cell carcinoma |
| ∗log2FC in expression of this searched gene in stem-like cells from each diseased tissue sample relative to stem-like cells in normal samples in each tissue plotted against the malignancy continuum. Samples are colored based on if they are from different disease stage. |
Top |
Malignant transformation related pathway analysis |
| Find out the enriched GO biological processes and KEGG pathways involved in transition from healthy to precancer to cancer |
| Tissue | Disease Stage | Enriched GO biological Processes |
| Colorectum | AD |  |
| Colorectum | SER |  |
| Colorectum | MSS |  |
| Colorectum | MSI-H |  |
| Colorectum | FAP |  |
| ∗Top 15 enriched GO BP terms are showed in the bar plot of each disease state in each tissue. Each row represents a significant GO biological process which is colored according to the -log10(p.adjust). |
| Page: 1 2 3 4 5 6 7 8 9 |
| GO ID | Tissue | Disease Stage | Description | Gene Ratio | Bg Ratio | pvalue | p.adjust | Count |
| Page: 1 |
| Pathway ID | Tissue | Disease Stage | Description | Gene Ratio | Bg Ratio | pvalue | p.adjust | qvalue | Count |
| hsa00650 | Liver | NAFLD | Butanoate metabolism | 11/1043 | 27/8465 | 1.88e-04 | 3.62e-03 | 2.92e-03 | 11 |
| hsa006501 | Liver | NAFLD | Butanoate metabolism | 11/1043 | 27/8465 | 1.88e-04 | 3.62e-03 | 2.92e-03 | 11 |
| hsa006502 | Liver | Cirrhotic | Butanoate metabolism | 15/2530 | 27/8465 | 4.71e-03 | 1.74e-02 | 1.07e-02 | 15 |
| hsa006503 | Liver | Cirrhotic | Butanoate metabolism | 15/2530 | 27/8465 | 4.71e-03 | 1.74e-02 | 1.07e-02 | 15 |
| hsa006504 | Liver | HCC | Butanoate metabolism | 19/4020 | 27/8465 | 1.37e-02 | 3.33e-02 | 1.85e-02 | 19 |
| hsa006505 | Liver | HCC | Butanoate metabolism | 19/4020 | 27/8465 | 1.37e-02 | 3.33e-02 | 1.85e-02 | 19 |
| Page: 1 |
Top |
Cell-cell communication analysis |
| Identification of potential cell-cell interactions between two cell types and their ligand-receptor pairs for different disease states |
| Ligand | Receptor | LRpair | Pathway | Tissue | Disease Stage |
| Page: 1 |
Top |
Single-cell gene regulatory network inference analysis |
| Find out the significant the regulons (TFs) and the target genes of each regulon across cell types for different disease states |
| TF | Cell Type | Tissue | Disease Stage | Target Gene | RSS | Regulon Activity |
| ∗The dot plots of a searched regulon are shown for all cell subpopulations in each disease state of each tissue based on the regulon specific score inferred using pySCENIC and by calculating the average expression. |
| Page: 1 |
Top |
Somatic mutation of malignant transformation related genes |
| Annotation of somatic variants for genes involved in malignant transformation |
| Hugo Symbol | Variant Class | Variant Classification | dbSNP RS | HGVSc | HGVSp | HGVSp Short | SWISSPROT | BIOTYPE | SIFT | PolyPhen | Tumor Sample Barcode | Tissue | Histology | Sex | Age | Stage | Therapy Types | Drugs | Outcome |
| BDH1 | SNV | Missense_Mutation | c.890N>A | p.Pro297His | p.P297H | Q02338 | protein_coding | deleterious(0) | possibly_damaging(0.572) | TCGA-A7-A0DB-01 | Breast | breast invasive carcinoma | Female | <65 | I/II | Hormone Therapy | arimidex | SD | |
| BDH1 | SNV | Missense_Mutation | c.751N>A | p.Glu251Lys | p.E251K | Q02338 | protein_coding | deleterious(0.03) | possibly_damaging(0.542) | TCGA-A7-A56D-01 | Breast | breast invasive carcinoma | Female | >=65 | I/II | Hormone Therapy | arimidex | SD | |
| BDH1 | SNV | Missense_Mutation | c.14N>A | p.Arg5His | p.R5H | Q02338 | protein_coding | deleterious_low_confidence(0.03) | benign(0) | TCGA-AO-A128-01 | Breast | breast invasive carcinoma | Female | <65 | I/II | Chemotherapy | doxorubicin | SD | |
| BDH1 | SNV | Missense_Mutation | c.298N>A | p.Asp100Asn | p.D100N | Q02338 | protein_coding | tolerated(0.09) | benign(0.179) | TCGA-E9-A1NA-01 | Breast | breast invasive carcinoma | Female | <65 | I/II | Chemotherapy | cyclophosphamide | SD | |
| BDH1 | SNV | Missense_Mutation | rs201775401 | c.551G>A | p.Arg184Gln | p.R184Q | Q02338 | protein_coding | deleterious(0.04) | probably_damaging(0.998) | TCGA-GM-A2D9-01 | Breast | breast invasive carcinoma | Female | >=65 | I/II | Hormone Therapy | arimidex | SD |
| BDH1 | SNV | Missense_Mutation | novel | c.617C>T | p.Ser206Phe | p.S206F | Q02338 | protein_coding | deleterious(0) | probably_damaging(0.99) | TCGA-2W-A8YY-01 | Cervix | cervical & endocervical cancer | Female | <65 | I/II | Chemotherapy | cisplatin | CR |
| BDH1 | SNV | Missense_Mutation | c.751N>A | p.Glu251Lys | p.E251K | Q02338 | protein_coding | deleterious(0.03) | possibly_damaging(0.542) | TCGA-JW-A5VL-01 | Cervix | cervical & endocervical cancer | Female | <65 | I/II | Unknown | Unknown | SD | |
| BDH1 | SNV | Missense_Mutation | c.469N>G | p.Ser157Gly | p.S157G | Q02338 | protein_coding | deleterious(0.03) | probably_damaging(0.964) | TCGA-AD-6964-01 | Colorectum | colon adenocarcinoma | Male | <65 | III/IV | Chemotherapy | folfox | PD | |
| BDH1 | SNV | Missense_Mutation | c.16N>A | p.Leu6Ile | p.L6I | Q02338 | protein_coding | tolerated_low_confidence(0.13) | benign(0.115) | TCGA-CM-5861-01 | Colorectum | colon adenocarcinoma | Female | <65 | I/II | Unknown | Unknown | PD | |
| BDH1 | SNV | Missense_Mutation | rs778493168 | c.395N>G | p.Lys132Arg | p.K132R | Q02338 | protein_coding | tolerated(0.17) | benign(0.02) | TCGA-AG-A00Y-01 | Colorectum | rectum adenocarcinoma | Male | >=65 | I/II | Unknown | Unknown | PD |
| Page: 1 2 3 4 |
Top |
Related drugs of malignant transformation related genes |
| Identification of chemicals and drugs interact with genes involved in malignant transfromation |
| (DGIdb 4.0) |
| Entrez ID | Symbol | Category | Interaction Types | Drug Claim Name | Drug Name | PMIDs |
| Page: 1 |

Copyright 2023-Present -The University of Texas Health Science Center at Houston |