
|
|||||
|
 | |
| |
| |
| |
| |
| |
|
Gene: BCS1L |
Gene summary for BCS1L |
| Gene information | Species | Human | Gene symbol | BCS1L | Gene ID | 617 |
| Gene name | BCS1 homolog, ubiquinol-cytochrome c reductase complex chaperone | |
| Gene Alias | BCS | |
| Cytomap | 2q35 | |
| Gene Type | protein-coding | GO ID | GO:0006810 | UniProtAcc | A0A024R467 |
Top |
Malignant transformation analysis |
| Identification of the aberrant gene expression in precancerous and cancerous lesions by comparing the gene expression of stem-like cells in diseased tissues with normal stem cells |
| Entrez ID | Symbol | Replicates | Species | Organ | Tissue | Adj P-value | Log2FC | Malignancy |
| 617 | BCS1L | LZE4T | Human | Esophagus | ESCC | 2.55e-10 | 2.33e-01 | 0.0811 |
| 617 | BCS1L | LZE24T | Human | Esophagus | ESCC | 2.90e-10 | 1.76e-01 | 0.0596 |
| 617 | BCS1L | P2T-E | Human | Esophagus | ESCC | 8.46e-14 | 2.37e-01 | 0.1177 |
| 617 | BCS1L | P4T-E | Human | Esophagus | ESCC | 2.81e-08 | 1.98e-01 | 0.1323 |
| 617 | BCS1L | P5T-E | Human | Esophagus | ESCC | 1.30e-13 | 3.36e-01 | 0.1327 |
| 617 | BCS1L | P8T-E | Human | Esophagus | ESCC | 3.14e-15 | 1.99e-01 | 0.0889 |
| 617 | BCS1L | P9T-E | Human | Esophagus | ESCC | 4.95e-09 | 1.84e-01 | 0.1131 |
| 617 | BCS1L | P10T-E | Human | Esophagus | ESCC | 2.55e-11 | 1.84e-01 | 0.116 |
| 617 | BCS1L | P11T-E | Human | Esophagus | ESCC | 1.58e-09 | 3.20e-01 | 0.1426 |
| 617 | BCS1L | P12T-E | Human | Esophagus | ESCC | 3.06e-12 | 2.07e-01 | 0.1122 |
| 617 | BCS1L | P15T-E | Human | Esophagus | ESCC | 1.76e-16 | 3.20e-01 | 0.1149 |
| 617 | BCS1L | P16T-E | Human | Esophagus | ESCC | 1.10e-14 | 3.16e-01 | 0.1153 |
| 617 | BCS1L | P17T-E | Human | Esophagus | ESCC | 3.41e-07 | 3.31e-01 | 0.1278 |
| 617 | BCS1L | P19T-E | Human | Esophagus | ESCC | 1.25e-05 | 4.07e-01 | 0.1662 |
| 617 | BCS1L | P20T-E | Human | Esophagus | ESCC | 5.38e-20 | 3.92e-01 | 0.1124 |
| 617 | BCS1L | P21T-E | Human | Esophagus | ESCC | 4.16e-26 | 4.91e-01 | 0.1617 |
| 617 | BCS1L | P22T-E | Human | Esophagus | ESCC | 1.53e-16 | 2.20e-01 | 0.1236 |
| 617 | BCS1L | P23T-E | Human | Esophagus | ESCC | 2.04e-16 | 2.80e-01 | 0.108 |
| 617 | BCS1L | P24T-E | Human | Esophagus | ESCC | 5.21e-19 | 3.96e-01 | 0.1287 |
| 617 | BCS1L | P26T-E | Human | Esophagus | ESCC | 2.65e-07 | 1.61e-01 | 0.1276 |
| Page: 1 2 3 4 |
| Tissue | Expression Dynamics | Abbreviation |
| Esophagus | 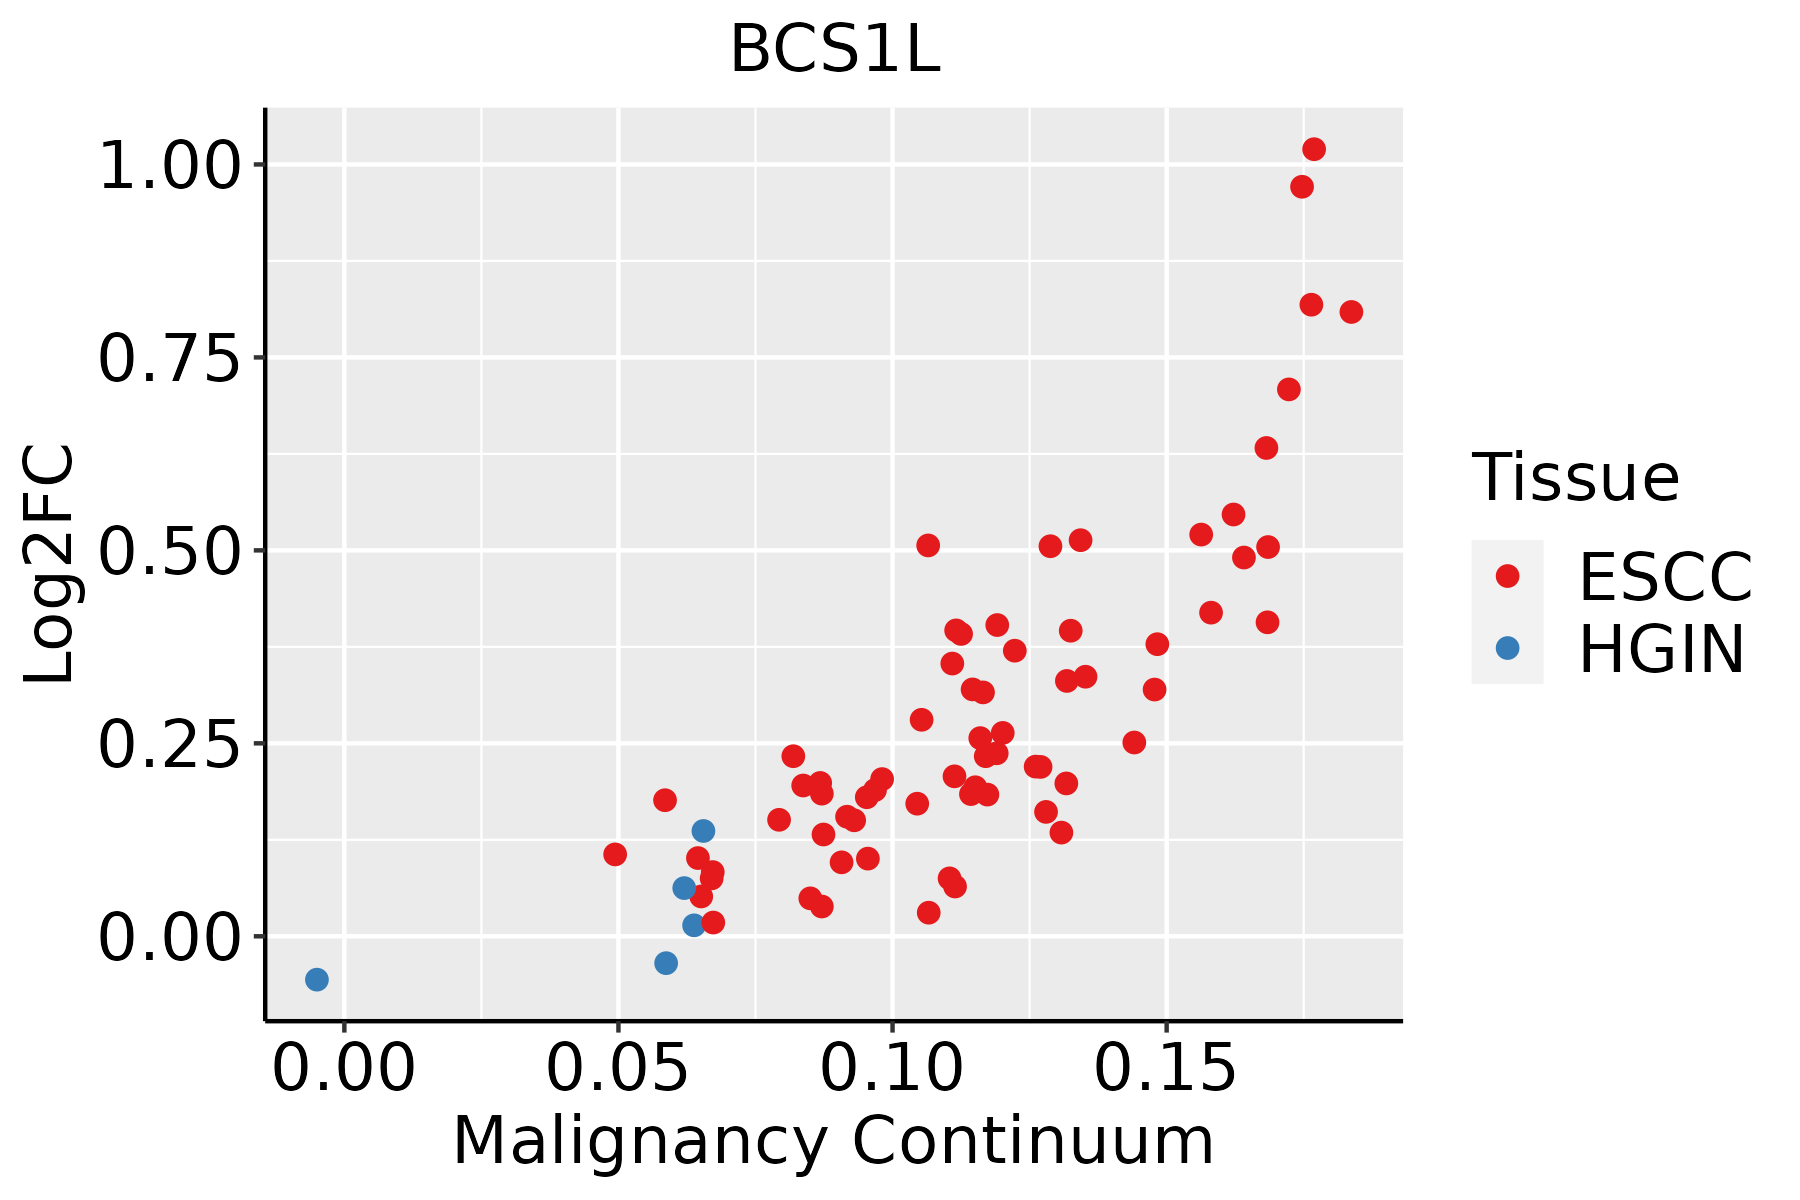 | ESCC: Esophageal squamous cell carcinoma |
| HGIN: High-grade intraepithelial neoplasias | ||
| LGIN: Low-grade intraepithelial neoplasias | ||
| Liver |  | HCC: Hepatocellular carcinoma |
| NAFLD: Non-alcoholic fatty liver disease | ||
| Oral Cavity | 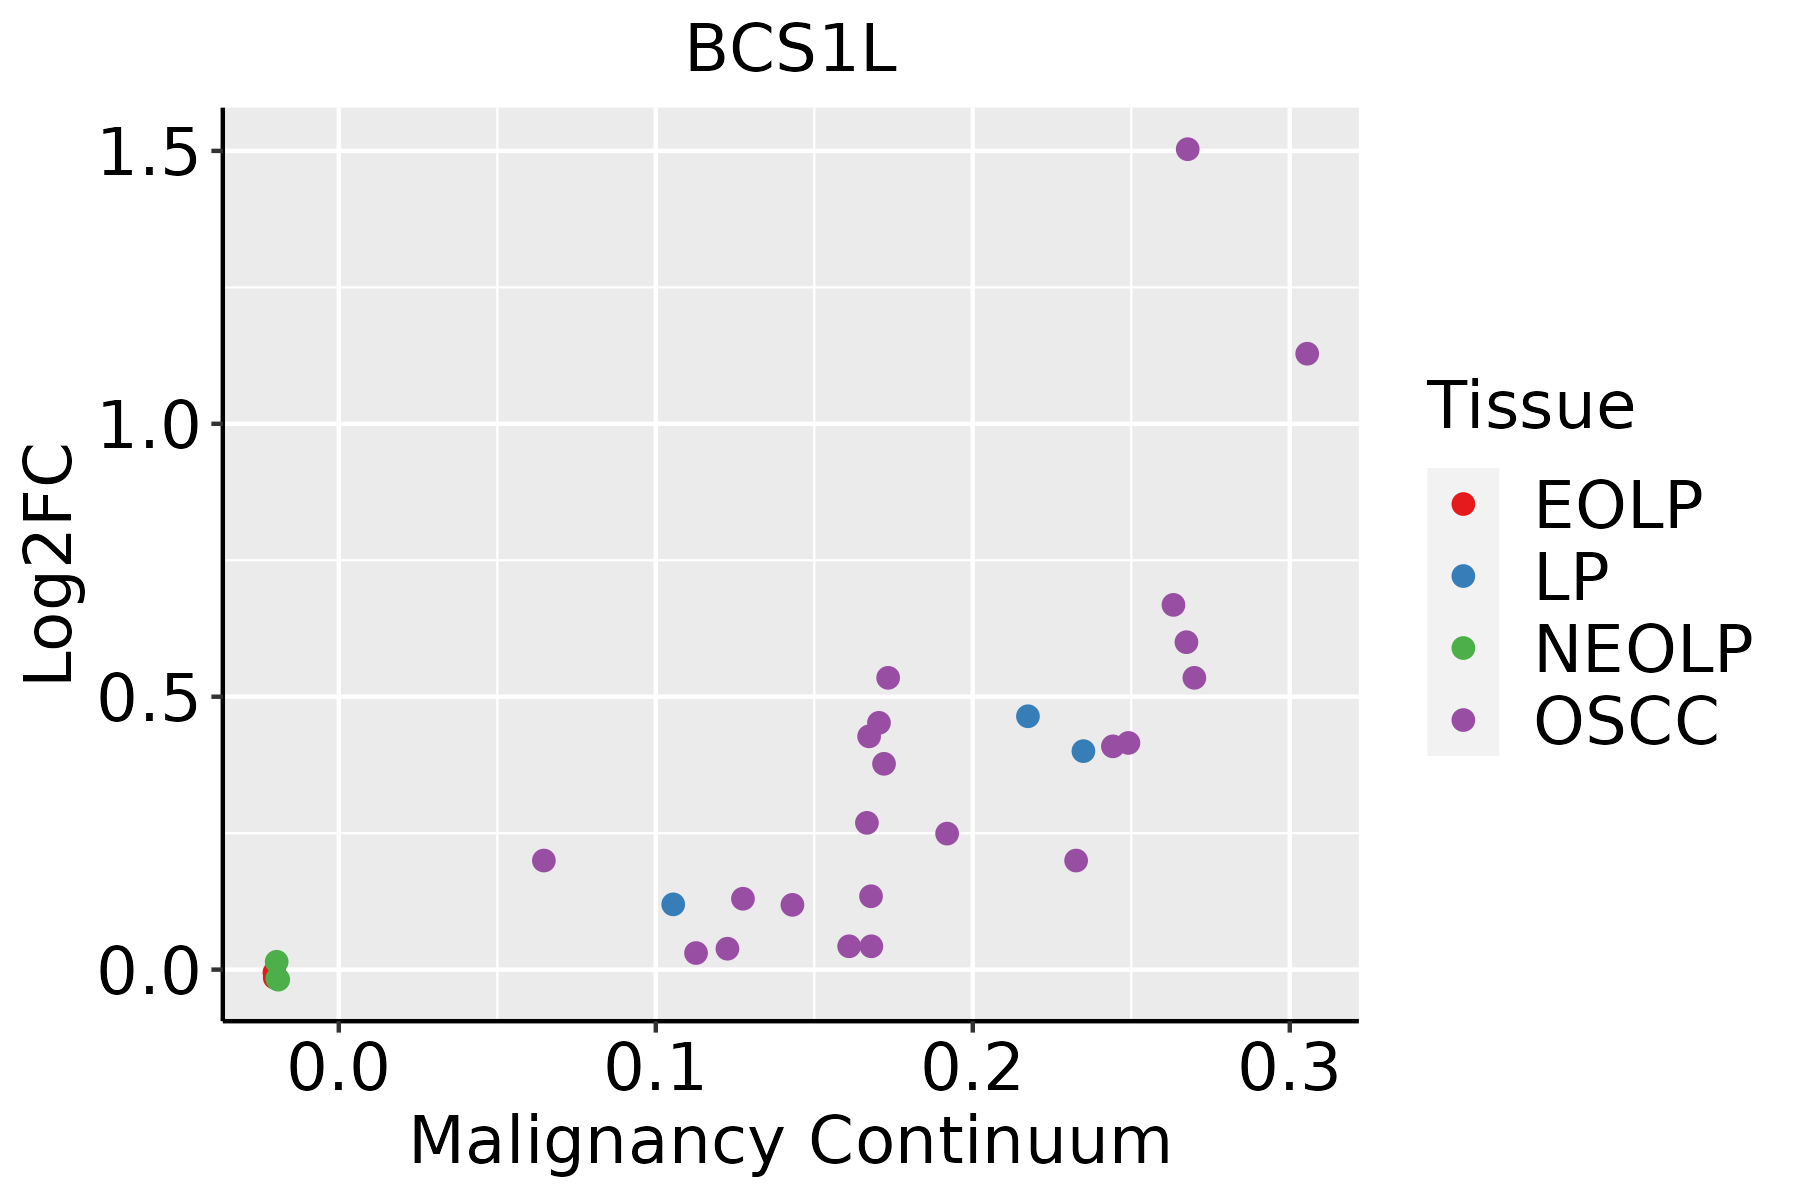 | EOLP: Erosive Oral lichen planus |
| LP: leukoplakia | ||
| NEOLP: Non-erosive oral lichen planus | ||
| OSCC: Oral squamous cell carcinoma |
| ∗log2FC in expression of this searched gene in stem-like cells from each diseased tissue sample relative to stem-like cells in normal samples in each tissue plotted against the malignancy continuum. Samples are colored based on if they are from different disease stage. |
Top |
Malignant transformation related pathway analysis |
| Find out the enriched GO biological processes and KEGG pathways involved in transition from healthy to precancer to cancer |
| Tissue | Disease Stage | Enriched GO biological Processes |
| Colorectum | AD |  |
| Colorectum | SER |  |
| Colorectum | MSS |  |
| Colorectum | MSI-H |  |
| Colorectum | FAP |  |
| ∗Top 15 enriched GO BP terms are showed in the bar plot of each disease state in each tissue. Each row represents a significant GO biological process which is colored according to the -log10(p.adjust). |
| Page: 1 2 3 4 5 6 7 8 9 |
| GO ID | Tissue | Disease Stage | Description | Gene Ratio | Bg Ratio | pvalue | p.adjust | Count |
| GO:0072594110 | Esophagus | ESCC | establishment of protein localization to organelle | 311/8552 | 422/18723 | 3.02e-32 | 2.13e-29 | 311 |
| GO:0006839110 | Esophagus | ESCC | mitochondrial transport | 187/8552 | 254/18723 | 8.35e-20 | 9.81e-18 | 187 |
| GO:0033108110 | Esophagus | ESCC | mitochondrial respiratory chain complex assembly | 83/8552 | 93/18723 | 9.56e-19 | 1.05e-16 | 83 |
| GO:0090150110 | Esophagus | ESCC | establishment of protein localization to membrane | 182/8552 | 260/18723 | 1.27e-15 | 8.19e-14 | 182 |
| GO:0072655110 | Esophagus | ESCC | establishment of protein localization to mitochondrion | 97/8552 | 120/18723 | 2.17e-15 | 1.33e-13 | 97 |
| GO:0070585110 | Esophagus | ESCC | protein localization to mitochondrion | 100/8552 | 125/18723 | 2.96e-15 | 1.77e-13 | 100 |
| GO:000700619 | Esophagus | ESCC | mitochondrial membrane organization | 93/8552 | 116/18723 | 2.16e-14 | 1.11e-12 | 93 |
| GO:0010257110 | Esophagus | ESCC | NADH dehydrogenase complex assembly | 50/8552 | 57/18723 | 3.78e-11 | 1.24e-09 | 50 |
| GO:0032981110 | Esophagus | ESCC | mitochondrial respiratory chain complex I assembly | 50/8552 | 57/18723 | 3.78e-11 | 1.24e-09 | 50 |
| GO:001700413 | Esophagus | ESCC | cytochrome complex assembly | 34/8552 | 36/18723 | 5.08e-10 | 1.31e-08 | 34 |
| GO:005120515 | Esophagus | ESCC | protein insertion into membrane | 46/8552 | 57/18723 | 5.90e-08 | 1.04e-06 | 46 |
| GO:000853512 | Esophagus | ESCC | respiratory chain complex IV assembly | 24/8552 | 26/18723 | 6.87e-07 | 8.99e-06 | 24 |
| GO:003361712 | Esophagus | ESCC | mitochondrial cytochrome c oxidase assembly | 21/8552 | 22/18723 | 8.75e-07 | 1.13e-05 | 21 |
| GO:009015118 | Esophagus | ESCC | establishment of protein localization to mitochondrial membrane | 26/8552 | 30/18723 | 3.79e-06 | 4.12e-05 | 26 |
| GO:007259422 | Liver | HCC | establishment of protein localization to organelle | 299/7958 | 422/18723 | 1.06e-32 | 6.10e-30 | 299 |
| GO:000683912 | Liver | HCC | mitochondrial transport | 184/7958 | 254/18723 | 2.30e-22 | 3.83e-20 | 184 |
| GO:007265512 | Liver | HCC | establishment of protein localization to mitochondrion | 98/7958 | 120/18723 | 1.18e-18 | 1.46e-16 | 98 |
| GO:007058512 | Liver | HCC | protein localization to mitochondrion | 101/7958 | 125/18723 | 1.53e-18 | 1.86e-16 | 101 |
| GO:003310812 | Liver | HCC | mitochondrial respiratory chain complex assembly | 80/7958 | 93/18723 | 3.47e-18 | 4.15e-16 | 80 |
| GO:009015012 | Liver | HCC | establishment of protein localization to membrane | 168/7958 | 260/18723 | 4.07e-13 | 2.13e-11 | 168 |
| Page: 1 2 3 |
| Pathway ID | Tissue | Disease Stage | Description | Gene Ratio | Bg Ratio | pvalue | p.adjust | qvalue | Count |
| Page: 1 |
Top |
Cell-cell communication analysis |
| Identification of potential cell-cell interactions between two cell types and their ligand-receptor pairs for different disease states |
| Ligand | Receptor | LRpair | Pathway | Tissue | Disease Stage |
| Page: 1 |
Top |
Single-cell gene regulatory network inference analysis |
| Find out the significant the regulons (TFs) and the target genes of each regulon across cell types for different disease states |
| TF | Cell Type | Tissue | Disease Stage | Target Gene | RSS | Regulon Activity |
| ∗The dot plots of a searched regulon are shown for all cell subpopulations in each disease state of each tissue based on the regulon specific score inferred using pySCENIC and by calculating the average expression. |
| Page: 1 |
Top |
Somatic mutation of malignant transformation related genes |
| Annotation of somatic variants for genes involved in malignant transformation |
| Hugo Symbol | Variant Class | Variant Classification | dbSNP RS | HGVSc | HGVSp | HGVSp Short | SWISSPROT | BIOTYPE | SIFT | PolyPhen | Tumor Sample Barcode | Tissue | Histology | Sex | Age | Stage | Therapy Types | Drugs | Outcome |
| BCS1L | SNV | Missense_Mutation | novel | c.930N>A | p.Ser310Arg | p.S310R | Q9Y276 | protein_coding | deleterious(0) | probably_damaging(0.999) | TCGA-A2-A0EM-01 | Breast | breast invasive carcinoma | Female | >=65 | I/II | Hormone Therapy | tamoxiphen | SD |
| BCS1L | SNV | Missense_Mutation | c.785N>T | p.Ser262Phe | p.S262F | Q9Y276 | protein_coding | deleterious(0) | probably_damaging(0.971) | TCGA-AC-A23C-01 | Breast | breast invasive carcinoma | Female | <65 | I/II | Chemotherapy | chemo | CR | |
| BCS1L | SNV | Missense_Mutation | c.1142N>G | p.Ala381Gly | p.A381G | Q9Y276 | protein_coding | tolerated(0.17) | benign(0.019) | TCGA-AC-A23H-01 | Breast | breast invasive carcinoma | Female | >=65 | I/II | Unknown | Unknown | PD | |
| BCS1L | insertion | Nonsense_Mutation | novel | c.932_933insCTTTCTTTTATGATAATGTTCAGAACAAA | p.Leu312PhefsTer4 | p.L312Ffs*4 | Q9Y276 | protein_coding | TCGA-A2-A0EM-01 | Breast | breast invasive carcinoma | Female | >=65 | I/II | Hormone Therapy | tamoxiphen | SD | ||
| BCS1L | insertion | Frame_Shift_Ins | novel | c.458_459insTTCC | p.Glu153AspfsTer24 | p.E153Dfs*24 | Q9Y276 | protein_coding | TCGA-A8-A0A1-01 | Breast | breast invasive carcinoma | Female | >=65 | I/II | Hormone Therapy | tamoxiphen | SD | ||
| BCS1L | insertion | Frame_Shift_Ins | novel | c.459_460insATACCACCCTTACCCCACAAAAGGAG | p.Ala154IlefsTer13 | p.A154Ifs*13 | Q9Y276 | protein_coding | TCGA-A8-A0A1-01 | Breast | breast invasive carcinoma | Female | >=65 | I/II | Hormone Therapy | tamoxiphen | SD | ||
| BCS1L | insertion | Nonsense_Mutation | novel | c.281_282insAAATTTCAAACTCATTAACTGACTAT | p.Phe95AsnfsTer7 | p.F95Nfs*7 | Q9Y276 | protein_coding | TCGA-AO-A0JB-01 | Breast | breast invasive carcinoma | Female | <65 | III/IV | Chemotherapy | cyclophosphamide | SD | ||
| BCS1L | deletion | Frame_Shift_Del | novel | c.152delT | p.Leu51ArgfsTer65 | p.L51Rfs*65 | Q9Y276 | protein_coding | TCGA-D8-A27V-01 | Breast | breast invasive carcinoma | Female | <65 | I/II | Hormone Therapy | tamoxiphen | SD | ||
| BCS1L | SNV | Missense_Mutation | novel | c.444N>G | p.Phe148Leu | p.F148L | Q9Y276 | protein_coding | tolerated(0.45) | benign(0.103) | TCGA-EA-A3HU-01 | Cervix | cervical & endocervical cancer | Female | <65 | I/II | Unknown | Unknown | SD |
| BCS1L | SNV | Missense_Mutation | rs753443327 | c.671N>A | p.Arg224His | p.R224H | Q9Y276 | protein_coding | deleterious(0) | probably_damaging(0.999) | TCGA-EA-A410-01 | Cervix | cervical & endocervical cancer | Female | <65 | I/II | Unknown | Unknown | SD |
| Page: 1 2 3 4 |
Top |
Related drugs of malignant transformation related genes |
| Identification of chemicals and drugs interact with genes involved in malignant transfromation |
| (DGIdb 4.0) |
| Entrez ID | Symbol | Category | Interaction Types | Drug Claim Name | Drug Name | PMIDs |
| Page: 1 |

Copyright 2023-Present -The University of Texas Health Science Center at Houston |