Schematic overview of the cellular and molecular mechanisms involved in the cancer progression, including the proposed cellular and molecular mechanisms in cancer cells trajectory. AT1: alveolar type 1 cells; AT2: alveolar type 2 cells; AAH: atypical adenomatous hyperplasia; AIS: adenocarcinoma in situ; MIA: minimally invasive adenocarcinoma; IA: invasive adenocarcinoma; EMT: epithelial-mesenchymal transition

Home

Download

Statistics

Help

Contact

Center for Computational Systems Medicine
leaf

Gene summary

leaf

Malignant transformation analysis

leaf

Malignant transformation related pathway analysis

leaf

Cell-cell communication analysis

leaf

Single-cell gene regulatory network inference analysis

leaf

Somatic mutation of malignant transformation related genes

leaf

Related drugs of malignant transformation related genes

Gene: BCLAF1

Gene summary for BCLAF1

check button Gene summary.

Gene informationSpeciesHuman
Gene symbol

BCLAF1

Gene ID

9774

Gene nameBCL2 associated transcription factor 1
Gene AliasBTF
Cytomap6q23.3
Gene Typeprotein-coding
GO ID

GO:0006139

UniProtAcc

Q9NYF8


Top

Malignant transformation analysis

check button Identification of the aberrant gene expression in precancerous and cancerous lesions by comparing the gene expression of stem-like cells in diseased tissues with normal stem cells
check button Malignant transformation involving gene list.
Entrez IDSymbolReplicatesSpeciesOrganTissueAdj P-valueLog2FCMalignancy
9774BCLAF1HTA11_3410_2000001011HumanColorectumAD2.24e-16-6.36e-010.0155
9774BCLAF1HTA11_2487_2000001011HumanColorectumSER3.17e-05-5.50e-01-0.1808
9774BCLAF1HTA11_3361_2000001011HumanColorectumAD5.98e-07-6.38e-01-0.1207
9774BCLAF1HTA11_696_2000001011HumanColorectumAD4.81e-16-4.51e-01-0.1464
9774BCLAF1HTA11_866_2000001011HumanColorectumAD7.98e-16-5.08e-01-0.1001
9774BCLAF1HTA11_866_3004761011HumanColorectumAD3.00e-09-5.58e-010.096
9774BCLAF1HTA11_9408_2000001011HumanColorectumAD2.54e-02-7.12e-010.0451
9774BCLAF1HTA11_10711_2000001011HumanColorectumAD4.81e-07-5.88e-010.0338
9774BCLAF1HTA11_6818_2000001021HumanColorectumAD5.12e-04-5.67e-010.0588
9774BCLAF1HTA11_99999970781_79442HumanColorectumMSS2.67e-10-3.24e-010.294
9774BCLAF1HTA11_99999965062_69753HumanColorectumMSI-H1.31e-029.20e-010.3487
9774BCLAF1HTA11_99999971662_82457HumanColorectumMSS5.25e-06-3.65e-010.3859
9774BCLAF1HTA11_99999974143_84620HumanColorectumMSS7.53e-14-4.57e-010.3005
9774BCLAF1A015-C-203HumanColorectumFAP4.27e-24-1.70e-01-0.1294
9774BCLAF1A002-C-201HumanColorectumFAP3.33e-08-2.91e-010.0324
9774BCLAF1A002-C-203HumanColorectumFAP3.19e-03-1.10e-010.2786
9774BCLAF1A001-C-119HumanColorectumFAP3.51e-027.08e-02-0.1557
9774BCLAF1A001-C-108HumanColorectumFAP2.26e-121.32e-01-0.0272
9774BCLAF1A002-C-205HumanColorectumFAP2.86e-15-1.78e-03-0.1236
9774BCLAF1A001-C-104HumanColorectumFAP1.56e-027.36e-020.0184
Page: 1 2 3 4 5 6 7 8 9 10 

check button Transcriptomic changes along malignancy continuum.
TissueExpression DynamicsAbbreviation
Colorectum (GSE201348)The image shows the transcriptomic changes along malignancy continuum.log2FC in expression of this searched gene in stem-like cells from each diseased tissue sample relative to stem-like cells in normal samples in each tissue plotted against the malignancy continuum. Samples are colored based on if they are from different disease stage.FAP: Familial adenomatous polyposis
CRC: Colorectal cancer
Colorectum (HTA11)The image shows the transcriptomic changes along malignancy continuum.log2FC in expression of this searched gene in stem-like cells from each diseased tissue sample relative to stem-like cells in normal samples in each tissue plotted against the malignancy continuum. Samples are colored based on if they are from different disease stage.AD: Adenomas
SER: Sessile serrated lesions
MSI-H: Microsatellite-high colorectal cancer
MSS: Microsatellite stable colorectal cancer
EndometriumThe image shows the transcriptomic changes along malignancy continuum.log2FC in expression of this searched gene in stem-like cells from each diseased tissue sample relative to stem-like cells in normal samples in each tissue plotted against the malignancy continuum. Samples are colored based on if they are from different disease stage.
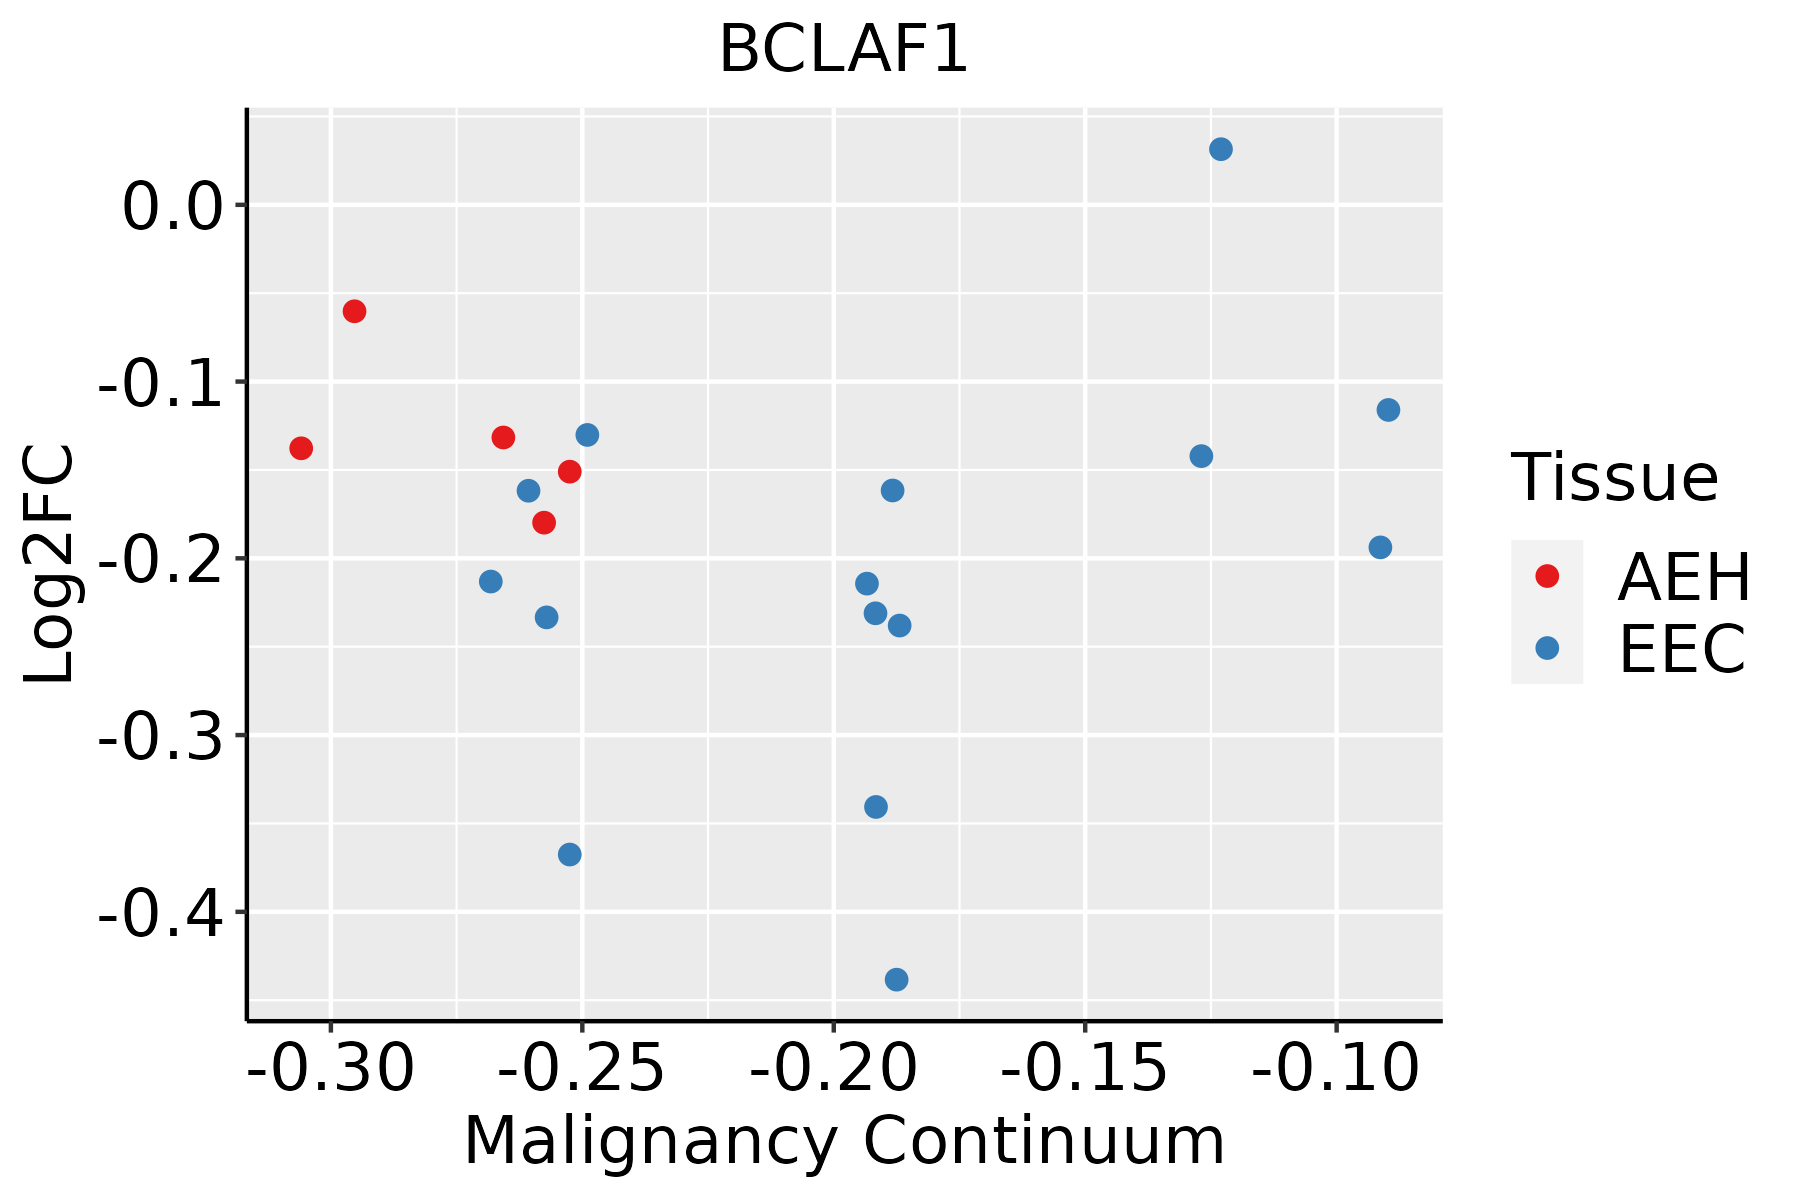
AEH: Atypical endometrial hyperplasia
EEC: Endometrioid Cancer
EsophagusThe image shows the transcriptomic changes along malignancy continuum.log2FC in expression of this searched gene in stem-like cells from each diseased tissue sample relative to stem-like cells in normal samples in each tissue plotted against the malignancy continuum. Samples are colored based on if they are from different disease stage.
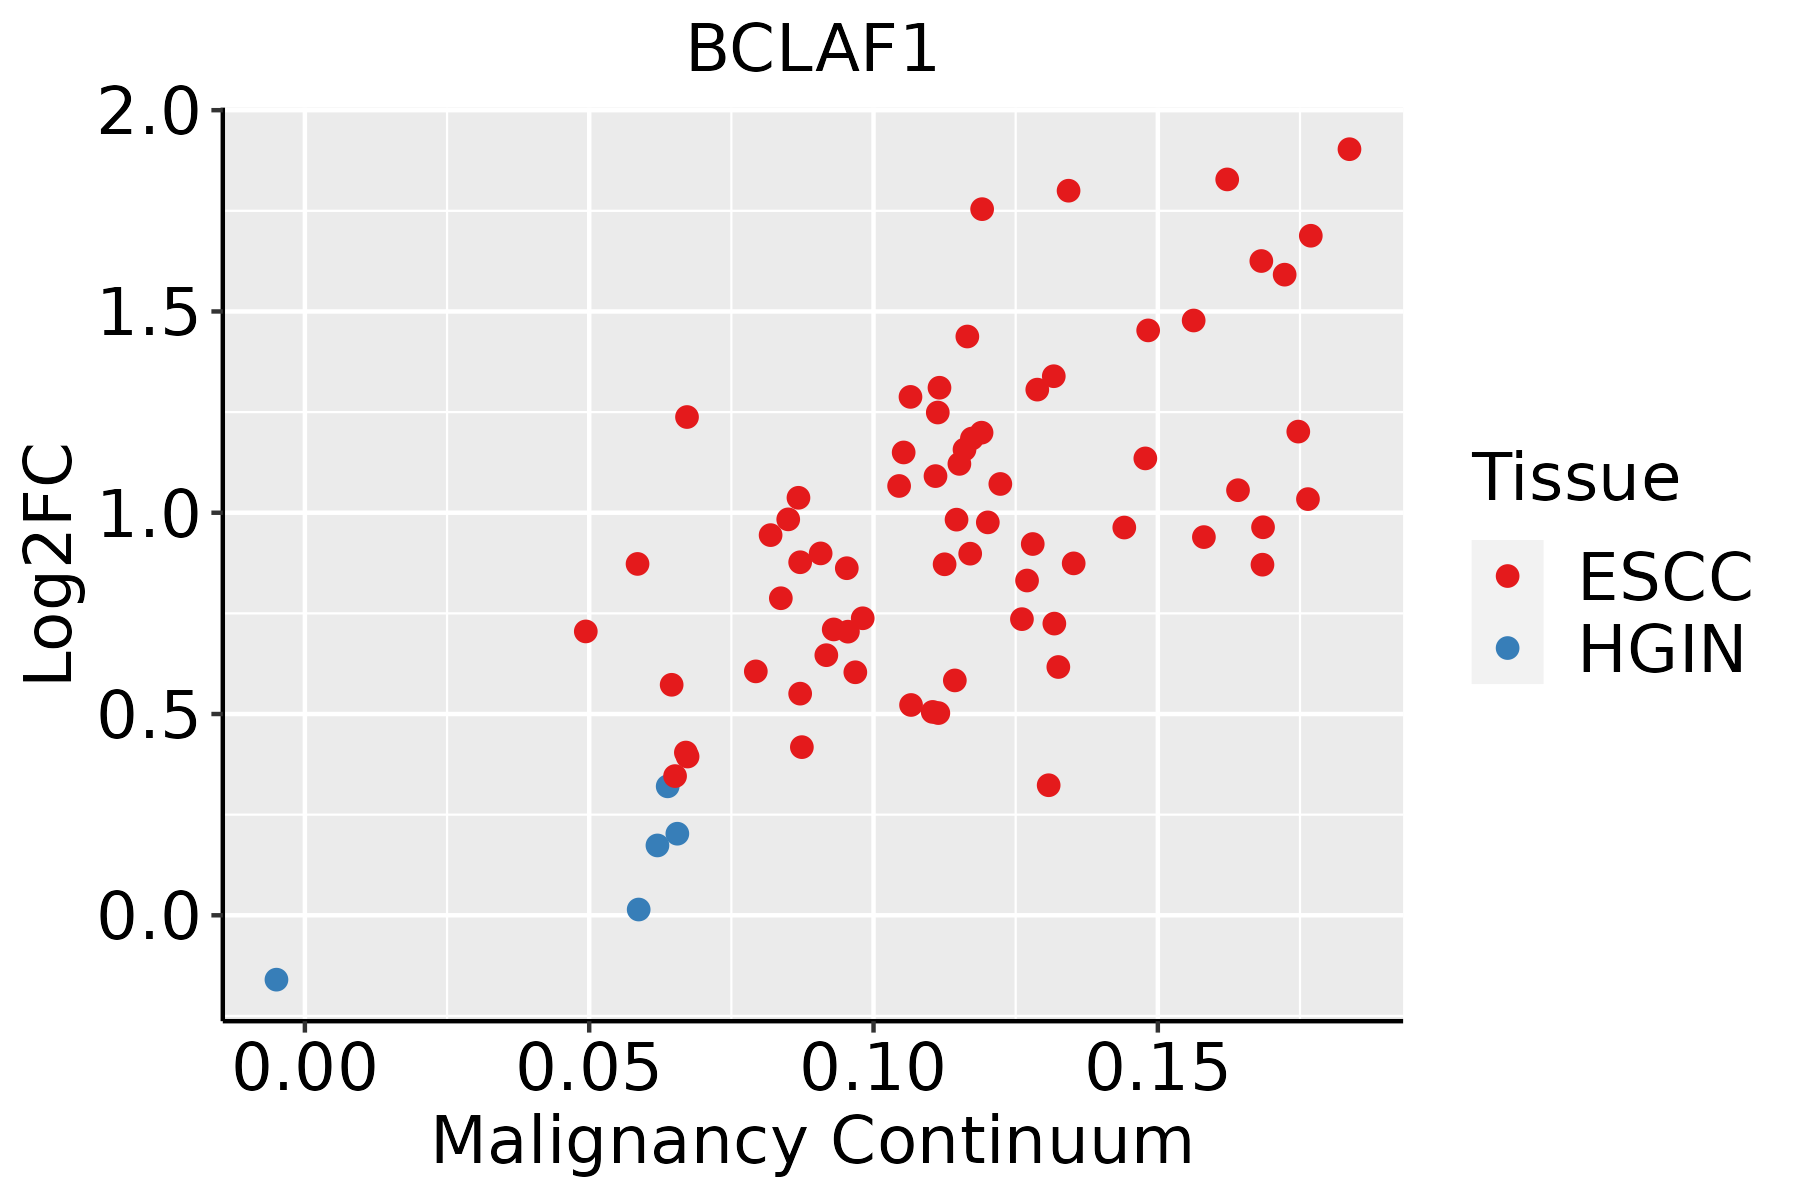
ESCC: Esophageal squamous cell carcinoma
HGIN: High-grade intraepithelial neoplasias
LGIN: Low-grade intraepithelial neoplasias
LiverThe image shows the transcriptomic changes along malignancy continuum.log2FC in expression of this searched gene in stem-like cells from each diseased tissue sample relative to stem-like cells in normal samples in each tissue plotted against the malignancy continuum. Samples are colored based on if they are from different disease stage.
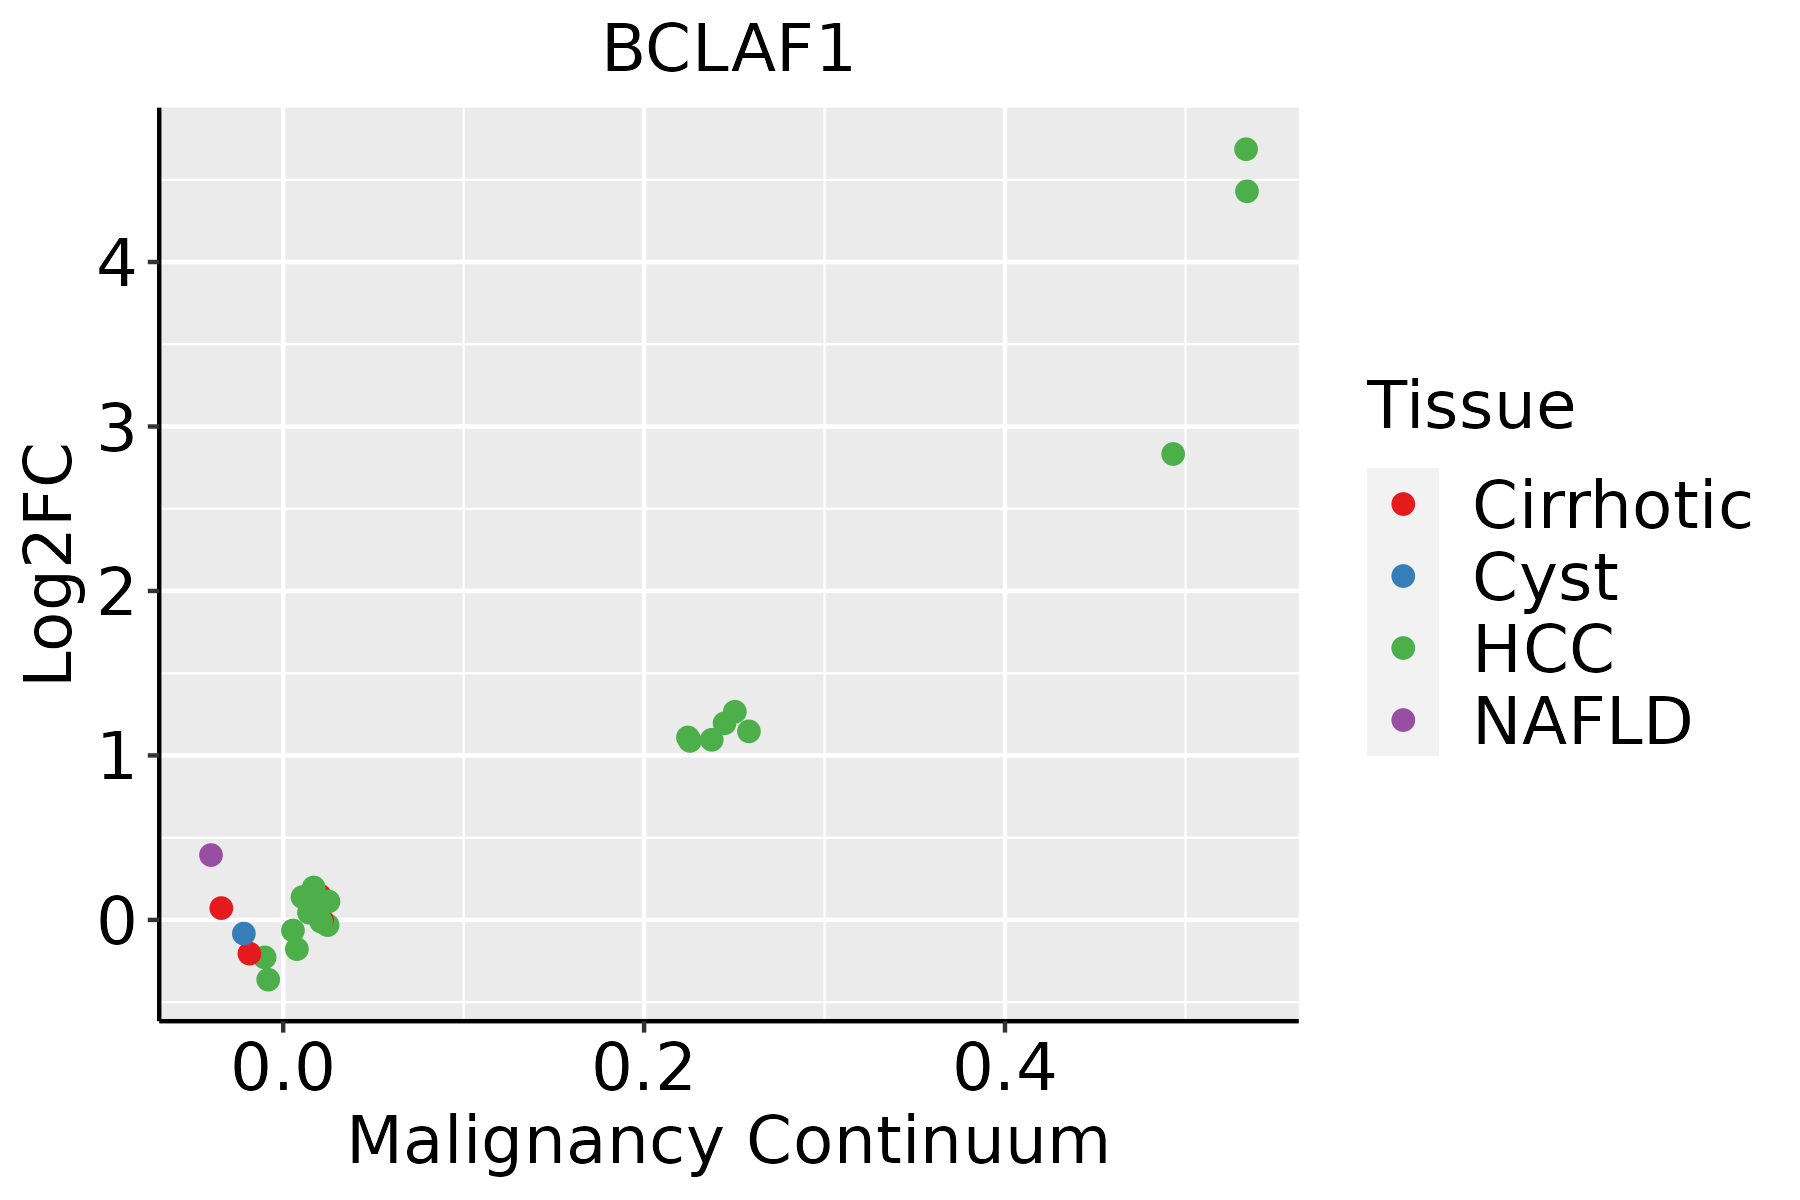
HCC: Hepatocellular carcinoma
NAFLD: Non-alcoholic fatty liver disease
Oral CavityThe image shows the transcriptomic changes along malignancy continuum.log2FC in expression of this searched gene in stem-like cells from each diseased tissue sample relative to stem-like cells in normal samples in each tissue plotted against the malignancy continuum. Samples are colored based on if they are from different disease stage.EOLP: Erosive Oral lichen planus
LP: leukoplakia
NEOLP: Non-erosive oral lichen planus
OSCC: Oral squamous cell carcinoma
ProstateThe image shows the transcriptomic changes along malignancy continuum.log2FC in expression of this searched gene in stem-like cells from each diseased tissue sample relative to stem-like cells in normal samples in each tissue plotted against the malignancy continuum. Samples are colored based on if they are from different disease stage.
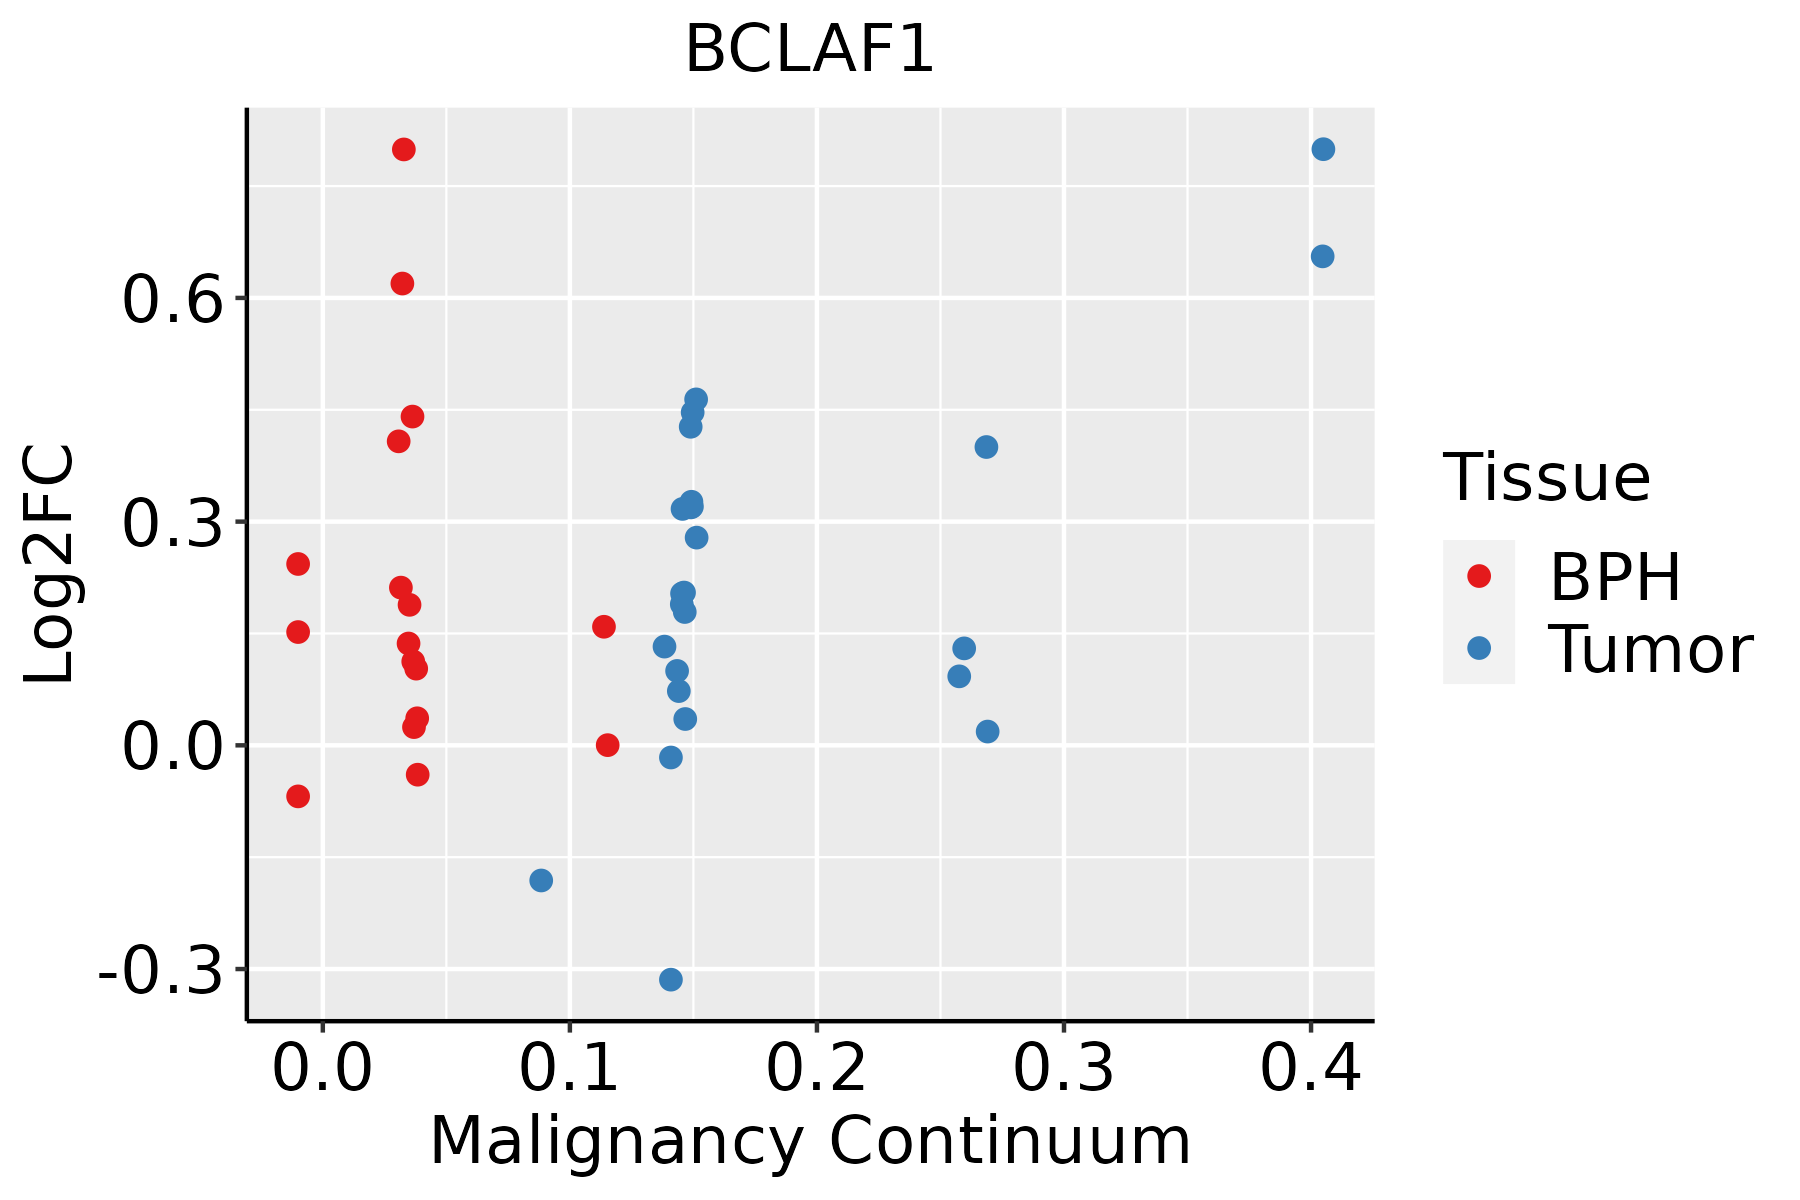
BPH: Benign Prostatic Hyperplasia
SkinThe image shows the transcriptomic changes along malignancy continuum.log2FC in expression of this searched gene in stem-like cells from each diseased tissue sample relative to stem-like cells in normal samples in each tissue plotted against the malignancy continuum. Samples are colored based on if they are from different disease stage.
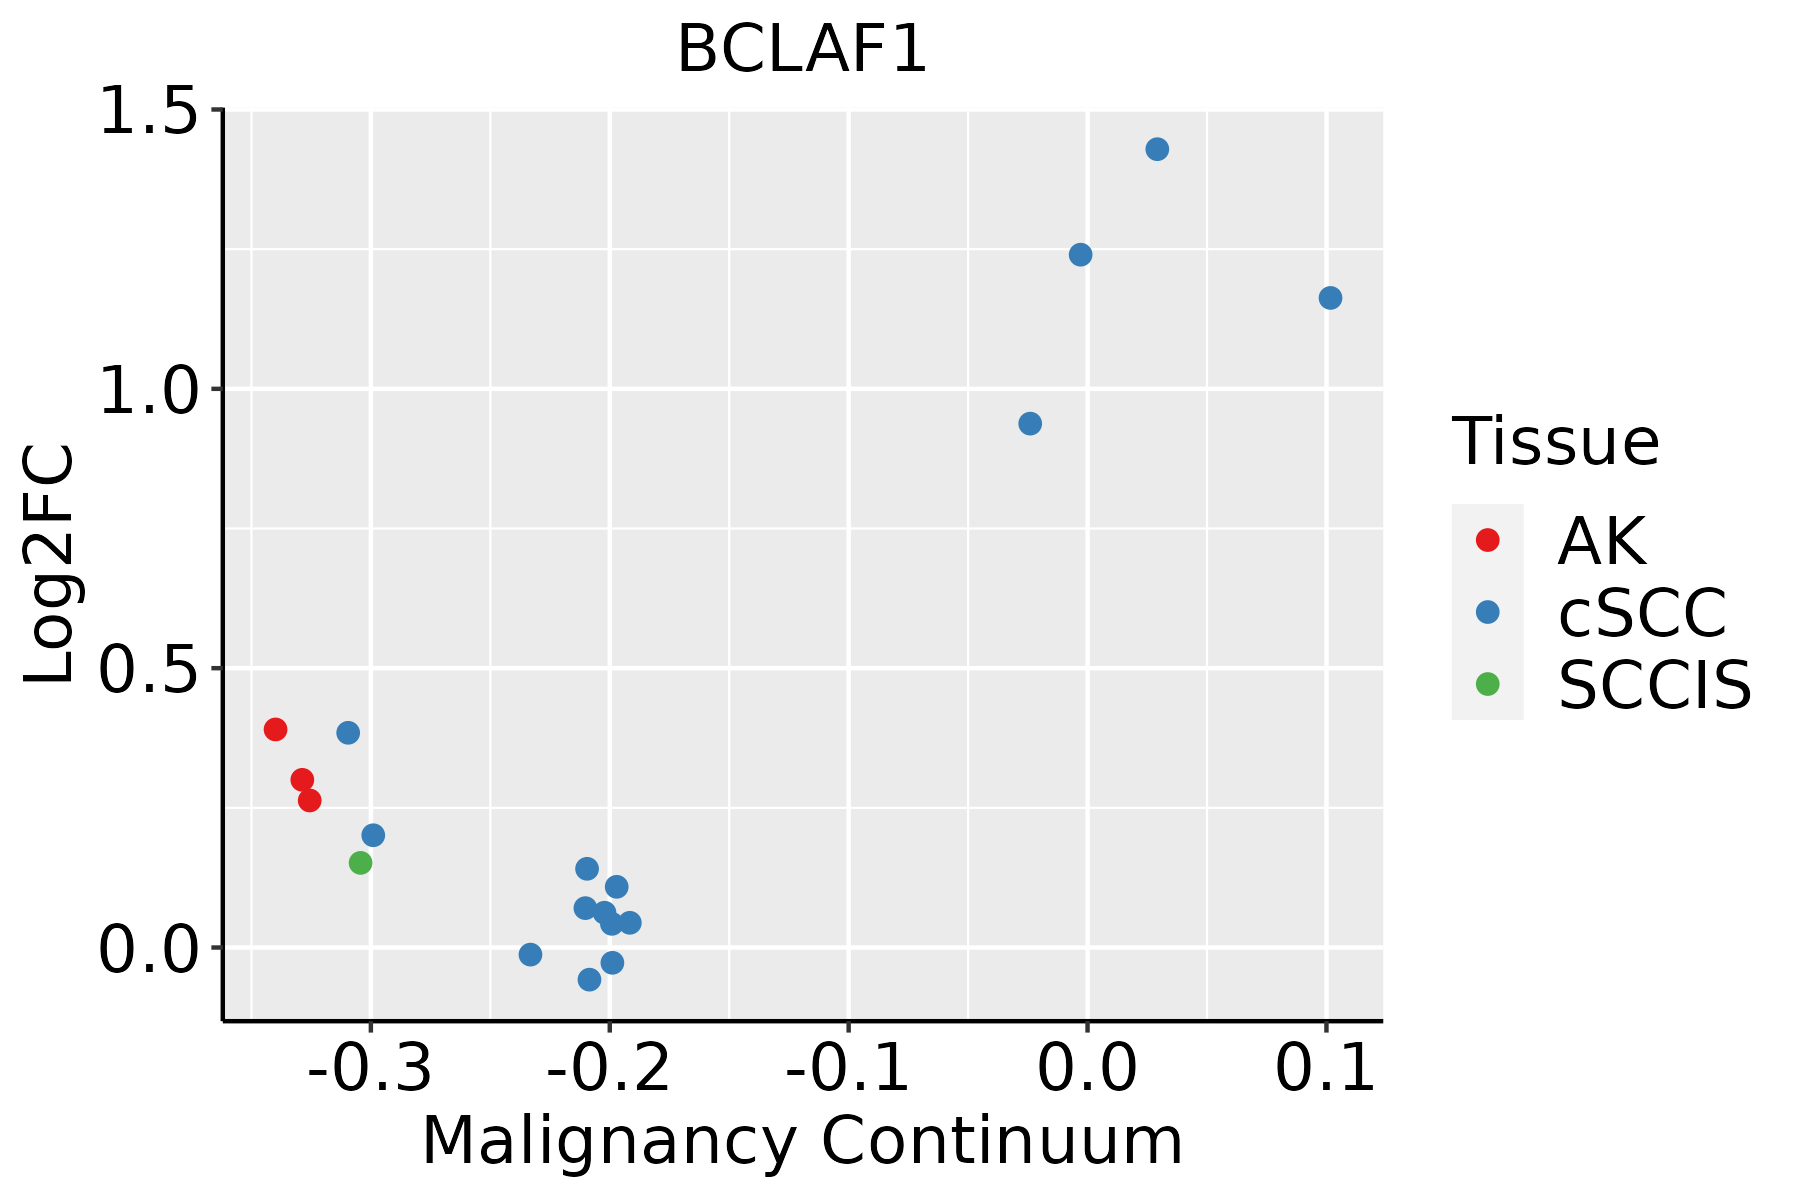
AK: Actinic keratosis
cSCC: Cutaneous squamous cell carcinoma
SCCIS:squamous cell carcinoma in situ
ThyroidThe image shows the transcriptomic changes along malignancy continuum.log2FC in expression of this searched gene in stem-like cells from each diseased tissue sample relative to stem-like cells in normal samples in each tissue plotted against the malignancy continuum. Samples are colored based on if they are from different disease stage.
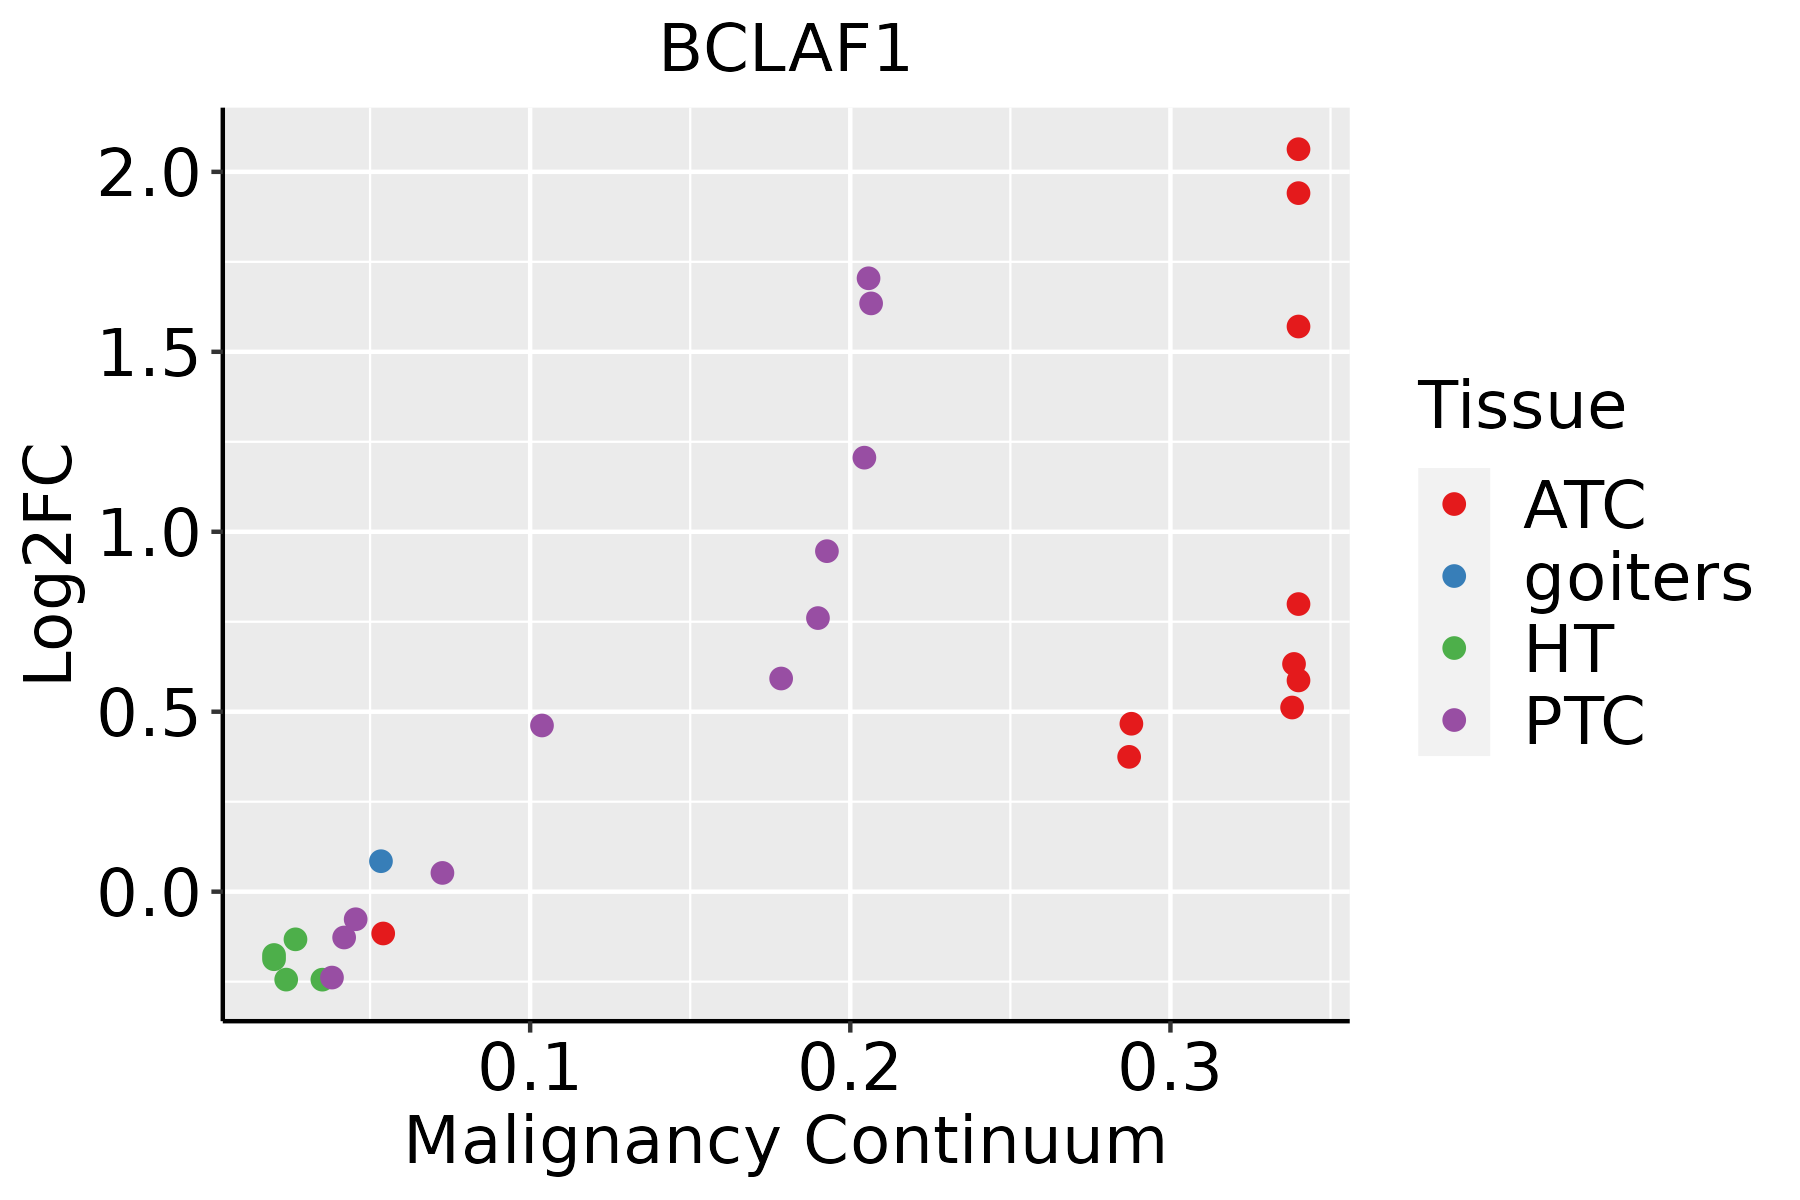
ATC: Anaplastic thyroid cancer
HT: Hashimoto's thyroiditis
PTC: Papillary thyroid cancer
∗log2FC in expression of this searched gene in stem-like cells from each diseased tissue sample relative to stem-like cells in normal samples in each tissue plotted against the malignancy continuum. Samples are colored based on if they are from different disease stage.

Top

Malignant transformation related pathway analysis

check buttonFind out the enriched GO biological processes and KEGG pathways involved in transition from healthy to precancer to cancer
check button Figure of enriched GO biological processes.
TissueDisease StageEnriched GO biological Processes
ColorectumADGO analysis - Figure of enriched GO biological processes: Top 15 enriched GO BP terms are showed in the bar plot of each disease state in each tissue. Each row represents a significant GO biological process which is colored according to the -log10(p.adjust).
ColorectumSERGO analysis - Figure of enriched GO biological processes: Top 15 enriched GO BP terms are showed in the bar plot of each disease state in each tissue. Each row represents a significant GO biological process which is colored according to the -log10(p.adjust).
ColorectumMSSGO analysis - Figure of enriched GO biological processes: Top 15 enriched GO BP terms are showed in the bar plot of each disease state in each tissue. Each row represents a significant GO biological process which is colored according to the -log10(p.adjust).
ColorectumMSI-HGO analysis - Figure of enriched GO biological processes: Top 15 enriched GO BP terms are showed in the bar plot of each disease state in each tissue. Each row represents a significant GO biological process which is colored according to the -log10(p.adjust).
ColorectumFAPGO analysis - Figure of enriched GO biological processes: Top 15 enriched GO BP terms are showed in the bar plot of each disease state in each tissue. Each row represents a significant GO biological process which is colored according to the -log10(p.adjust).
∗Top 15 enriched GO BP terms are showed in the bar plot of each disease state in each tissue. Each row represents a significant GO biological process which is colored according to the -log10(p.adjust).
Page: 1 2 3 4 5 6 7 8 9 

check button Enriched GO biological processes.
GO IDTissueDisease StageDescriptionGene RatioBg Ratiopvaluep.adjustCount
GO:0097193ColorectumADintrinsic apoptotic signaling pathway108/3918288/187236.25e-116.41e-09108
GO:2001242ColorectumADregulation of intrinsic apoptotic signaling pathway67/3918164/187234.94e-093.16e-0767
GO:2001233ColorectumADregulation of apoptotic signaling pathway119/3918356/187232.14e-081.21e-06119
GO:2001020ColorectumADregulation of response to DNA damage stimulus71/3918219/187234.38e-057.65e-0471
GO:0043620ColorectumADregulation of DNA-templated transcription in response to stress23/391853/187231.86e-042.49e-0323
GO:2001235ColorectumADpositive regulation of apoptotic signaling pathway42/3918126/187237.85e-047.84e-0342
GO:2001244ColorectumADpositive regulation of intrinsic apoptotic signaling pathway23/391858/187238.82e-048.53e-0323
GO:2001022ColorectumADpositive regulation of response to DNA damage stimulus36/3918105/187231.02e-039.47e-0336
GO:20012421ColorectumSERregulation of intrinsic apoptotic signaling pathway59/2897164/187238.42e-111.20e-0859
GO:00971931ColorectumSERintrinsic apoptotic signaling pathway87/2897288/187231.67e-102.32e-0887
GO:20012331ColorectumSERregulation of apoptotic signaling pathway101/2897356/187233.05e-104.07e-08101
GO:20012351ColorectumSERpositive regulation of apoptotic signaling pathway36/2897126/187231.29e-042.63e-0336
GO:20012441ColorectumSERpositive regulation of intrinsic apoptotic signaling pathway20/289758/187232.76e-044.59e-0320
GO:00436201ColorectumSERregulation of DNA-templated transcription in response to stress17/289753/187231.93e-031.94e-0217
GO:20010201ColorectumSERregulation of response to DNA damage stimulus49/2897219/187234.24e-033.45e-0249
GO:00971932ColorectumMSSintrinsic apoptotic signaling pathway102/3467288/187236.06e-129.82e-10102
GO:20012422ColorectumMSSregulation of intrinsic apoptotic signaling pathway66/3467164/187236.70e-117.47e-0966
GO:20012332ColorectumMSSregulation of apoptotic signaling pathway116/3467356/187231.02e-101.06e-08116
GO:20012352ColorectumMSSpositive regulation of apoptotic signaling pathway42/3467126/187234.95e-058.97e-0442
GO:20010202ColorectumMSSregulation of response to DNA damage stimulus64/3467219/187237.20e-051.21e-0364
Page: 1 2 3 4 5 6 7 8 9 10 

check button Enriched KEGG pathways.
Pathway IDTissueDisease StageDescriptionGene RatioBg Ratiopvaluep.adjustqvalueCount
Page: 1 

Top

Cell-cell communication analysis

check buttonIdentification of potential cell-cell interactions between two cell types and their ligand-receptor pairs for different disease states
LigandReceptorLRpairPathwayTissueDisease Stage
Page: 1 

Top

Single-cell gene regulatory network inference analysis

check buttonFind out the significant the regulons (TFs) and the target genes of each regulon across cell types for different disease states
TFCell TypeTissueDisease StageTarget GeneRSSRegulon Activity
BCLAF1DUCT1PancreasHealthyFTX,PNISR,SNHG14, etc.4.20e-01The dot plots of a searched regulon are shown for all cell subpopulations in each disease state of each tissue based on the regulon specific score inferred using pySCENIC and by calculating the average expression.
BCLAF1STMThyroidHTFUS,SFPQ,MT-ATP6, etc.6.93e-01The dot plots of a searched regulon are shown for all cell subpopulations in each disease state of each tissue based on the regulon specific score inferred using pySCENIC and by calculating the average expression.
∗The dot plots of a searched regulon are shown for all cell subpopulations in each disease state of each tissue based on the regulon specific score inferred using pySCENIC and by calculating the average expression.
Page: 1 

Top

Somatic mutation of malignant transformation related genes

check buttonAnnotation of somatic variants for genes involved in malignant transformation
Hugo SymbolVariant ClassVariant ClassificationdbSNP RSHGVScHGVSpHGVSp ShortSWISSPROTBIOTYPESIFTPolyPhenTumor Sample BarcodeTissueHistologySexAgeStageTherapy TypesDrugsOutcome
BCLAF1SNVMissense_Mutationc.1967N>Tp.Asp656Valp.D656VQ9NYF8protein_codingdeleterious(0)possibly_damaging(0.591)TCGA-A8-A09Z-01Breastbreast invasive carcinomaFemale>=65I/IIUnknownUnknownSD
BCLAF1SNVMissense_Mutationrs140335385c.893G>Ap.Arg298Glnp.R298QQ9NYF8protein_codingtolerated(0.11)possibly_damaging(0.492)TCGA-AC-A23H-01Breastbreast invasive carcinomaFemale>=65I/IIUnknownUnknownPD
BCLAF1SNVMissense_Mutationnovelc.265C>Tp.His89Tyrp.H89YQ9NYF8protein_codingtolerated_low_confidence(0.28)benign(0.003)TCGA-AC-A23H-01Breastbreast invasive carcinomaFemale>=65I/IIUnknownUnknownPD
BCLAF1SNVMissense_Mutationrs771321542c.704C>Ap.Pro235Glnp.P235QQ9NYF8protein_codingdeleterious_low_confidence(0)probably_damaging(0.994)TCGA-D8-A27M-01Breastbreast invasive carcinomaFemale<65I/IIChemotherapymethotrexate+5SD
BCLAF1SNVMissense_Mutationc.511N>Ap.Gly171Argp.G171RQ9NYF8protein_codingdeleterious_low_confidence(0)benign(0.001)TCGA-GM-A2DF-01Breastbreast invasive carcinomaFemale<65I/IIChemotherapytaxolCR
BCLAF1SNVMissense_Mutationnovelc.1464N>Gp.Ile488Metp.I488MQ9NYF8protein_codingtolerated(0.22)benign(0.169)TCGA-OL-A66P-01Breastbreast invasive carcinomaFemale>=65I/IIChemotherapycytoxanCR
BCLAF1insertionFrame_Shift_Insnovelc.172_173insTGTTGGAAATGGATCTAGTCGATACAp.Arg58LeufsTer19p.R58Lfs*19Q9NYF8protein_codingTCGA-A8-A08H-01Breastbreast invasive carcinomaFemale>=65I/IIUnknownUnknownSD
BCLAF1insertionFrame_Shift_Insnovelc.260_261insGCCAAp.Tyr88ProfsTer94p.Y88Pfs*94Q9NYF8protein_codingTCGA-AQ-A04H-01Breastbreast invasive carcinomaFemale<65III/IVChemotherapytaxotereSD
BCLAF1deletionFrame_Shift_Delnovelc.2056_2057delNNp.Leu686LysfsTer3p.L686Kfs*3Q9NYF8protein_codingTCGA-GM-A2DO-01Breastbreast invasive carcinomaFemale<65I/IIHormone TherapytamoxiphenCR
BCLAF1insertionFrame_Shift_Insnovelc.2055_2056insCGGCCp.Leu686ArgfsTer3p.L686Rfs*3Q9NYF8protein_codingTCGA-GM-A2DO-01Breastbreast invasive carcinomaFemale<65I/IIHormone TherapytamoxiphenCR
Page: 1 2 3 4 5 6 7 8 9 10 11 12 13 14 

Top

Related drugs of malignant transformation related genes

check buttonIdentification of chemicals and drugs interact with genes involved in malignant transfromation
(DGIdb 4.0)
Entrez IDSymbolCategoryInteraction TypesDrug Claim NameDrug NamePMIDs
Page: 1