Schematic overview of the cellular and molecular mechanisms involved in the cancer progression, including the proposed cellular and molecular mechanisms in cancer cells trajectory. AT1: alveolar type 1 cells; AT2: alveolar type 2 cells; AAH: atypical adenomatous hyperplasia; AIS: adenocarcinoma in situ; MIA: minimally invasive adenocarcinoma; IA: invasive adenocarcinoma; EMT: epithelial-mesenchymal transition

Home

Download

Statistics

Help

Contact

Center for Computational Systems Medicine
leaf

Gene summary

leaf

Malignant transformation analysis

leaf

Malignant transformation related pathway analysis

leaf

Cell-cell communication analysis

leaf

Single-cell gene regulatory network inference analysis

leaf

Somatic mutation of malignant transformation related genes

leaf

Related drugs of malignant transformation related genes

Gene: BCL9L

Gene summary for BCL9L

check button Gene summary.

Gene informationSpeciesHuman
Gene symbol

BCL9L

Gene ID

283149

Gene nameBCL9 like
Gene AliasB9L
Cytomap11q23.3
Gene Typeprotein-coding
GO ID

GO:0000902

UniProtAcc

Q86UU0


Top

Malignant transformation analysis

check button Identification of the aberrant gene expression in precancerous and cancerous lesions by comparing the gene expression of stem-like cells in diseased tissues with normal stem cells
check button Malignant transformation involving gene list.
Entrez IDSymbolReplicatesSpeciesOrganTissueAdj P-valueLog2FCMalignancy
283149BCL9LLZE4THumanEsophagusESCC2.72e-026.16e-020.0811
283149BCL9LLZE20THumanEsophagusESCC2.29e-029.41e-020.0662
283149BCL9LLZE22D1HumanEsophagusHGIN8.29e-032.67e-010.0595
283149BCL9LLZE22THumanEsophagusESCC2.37e-189.06e-010.068
283149BCL9LLZE24THumanEsophagusESCC1.73e-091.73e-010.0596
283149BCL9LP1T-EHumanEsophagusESCC3.27e-033.23e-010.0875
283149BCL9LP2T-EHumanEsophagusESCC1.17e-071.49e-010.1177
283149BCL9LP4T-EHumanEsophagusESCC1.35e-091.04e-010.1323
283149BCL9LP5T-EHumanEsophagusESCC5.74e-079.68e-020.1327
283149BCL9LP8T-EHumanEsophagusESCC1.72e-082.95e-010.0889
283149BCL9LP9T-EHumanEsophagusESCC4.95e-101.56e-010.1131
283149BCL9LP10T-EHumanEsophagusESCC4.34e-141.76e-010.116
283149BCL9LP11T-EHumanEsophagusESCC2.84e-073.17e-010.1426
283149BCL9LP12T-EHumanEsophagusESCC1.62e-131.16e-010.1122
283149BCL9LP15T-EHumanEsophagusESCC2.02e-041.33e-010.1149
283149BCL9LP16T-EHumanEsophagusESCC4.49e-055.84e-020.1153
283149BCL9LP17T-EHumanEsophagusESCC5.35e-041.63e-010.1278
283149BCL9LP21T-EHumanEsophagusESCC1.78e-132.42e-010.1617
283149BCL9LP23T-EHumanEsophagusESCC2.05e-061.04e-010.108
283149BCL9LP24T-EHumanEsophagusESCC6.72e-069.36e-020.1287
Page: 1 2 3 4 5 

check button Transcriptomic changes along malignancy continuum.
TissueExpression DynamicsAbbreviation
EsophagusThe image shows the transcriptomic changes along malignancy continuum.log2FC in expression of this searched gene in stem-like cells from each diseased tissue sample relative to stem-like cells in normal samples in each tissue plotted against the malignancy continuum. Samples are colored based on if they are from different disease stage.ESCC: Esophageal squamous cell carcinoma
HGIN: High-grade intraepithelial neoplasias
LGIN: Low-grade intraepithelial neoplasias
LiverThe image shows the transcriptomic changes along malignancy continuum.log2FC in expression of this searched gene in stem-like cells from each diseased tissue sample relative to stem-like cells in normal samples in each tissue plotted against the malignancy continuum. Samples are colored based on if they are from different disease stage.
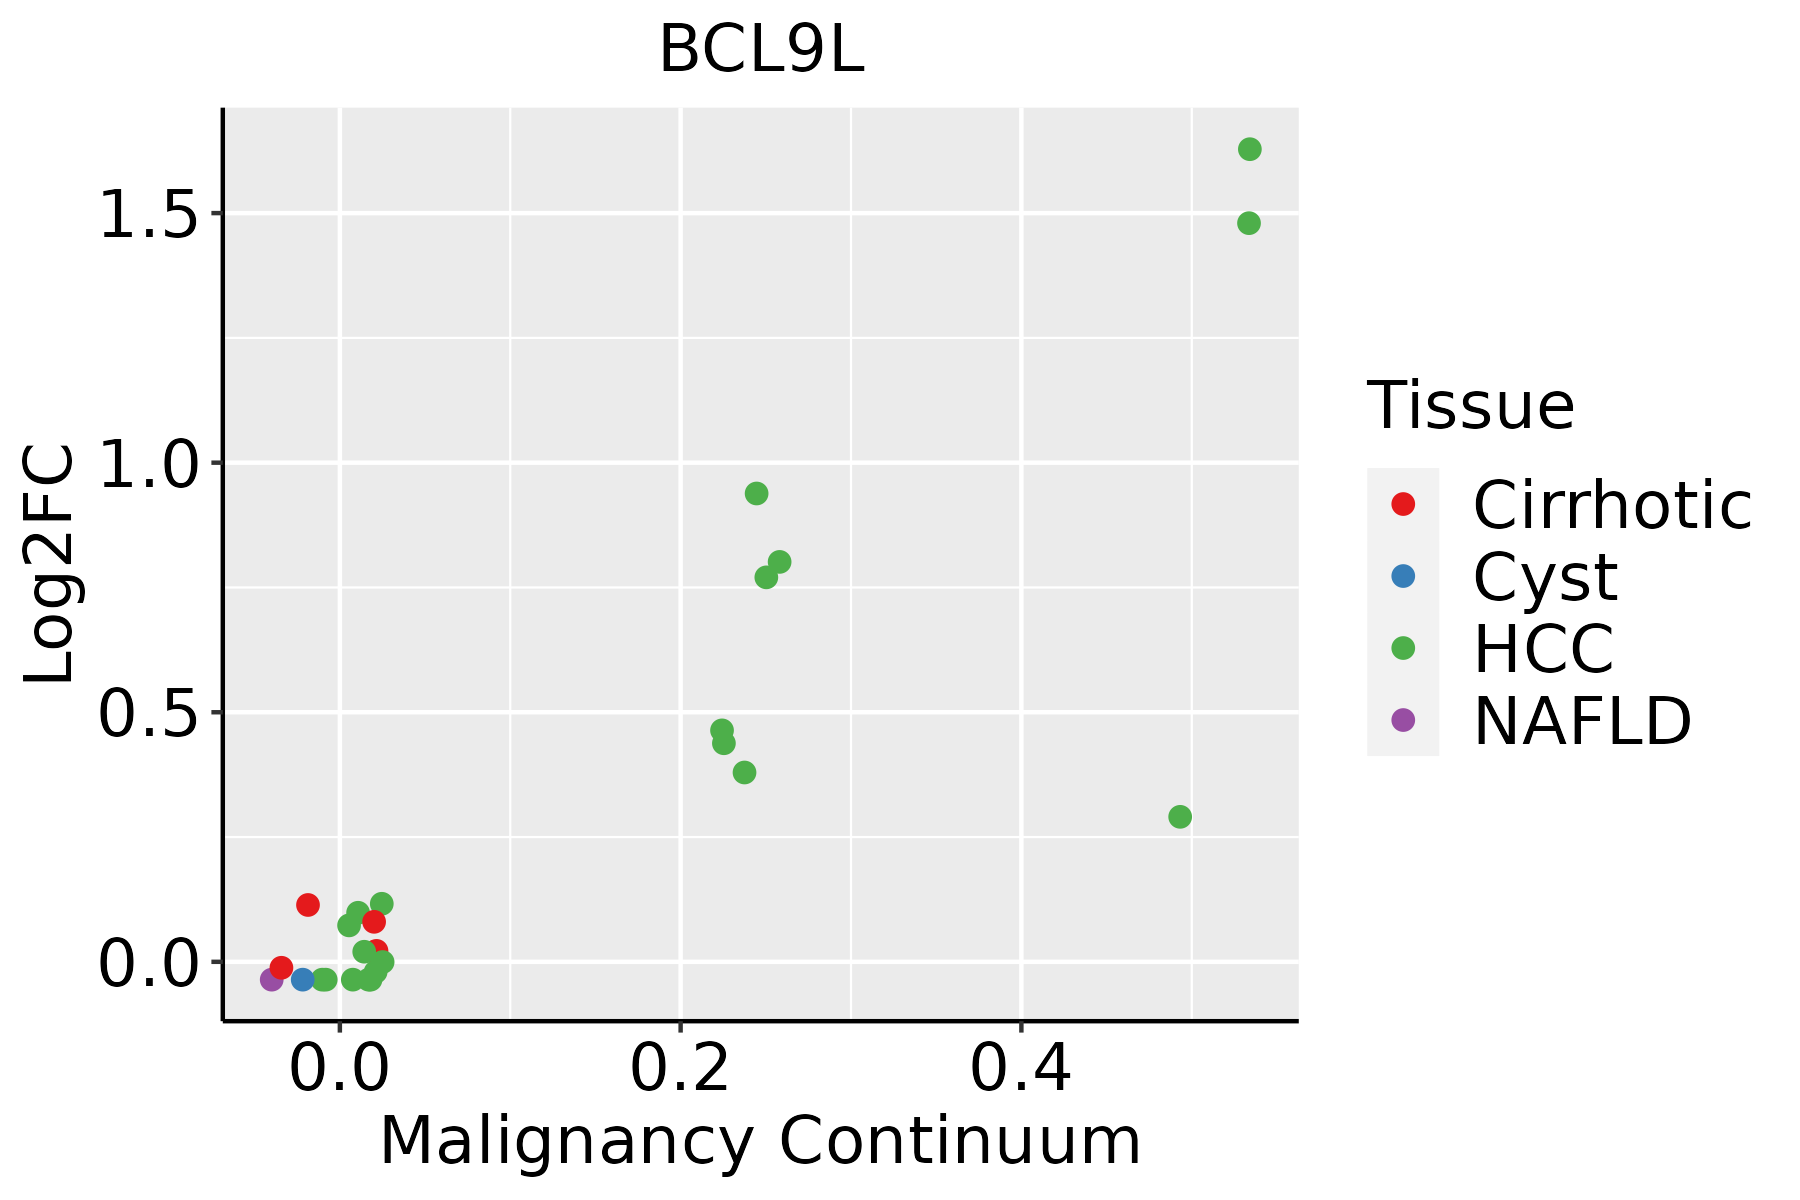
HCC: Hepatocellular carcinoma
NAFLD: Non-alcoholic fatty liver disease
Oral CavityThe image shows the transcriptomic changes along malignancy continuum.log2FC in expression of this searched gene in stem-like cells from each diseased tissue sample relative to stem-like cells in normal samples in each tissue plotted against the malignancy continuum. Samples are colored based on if they are from different disease stage.
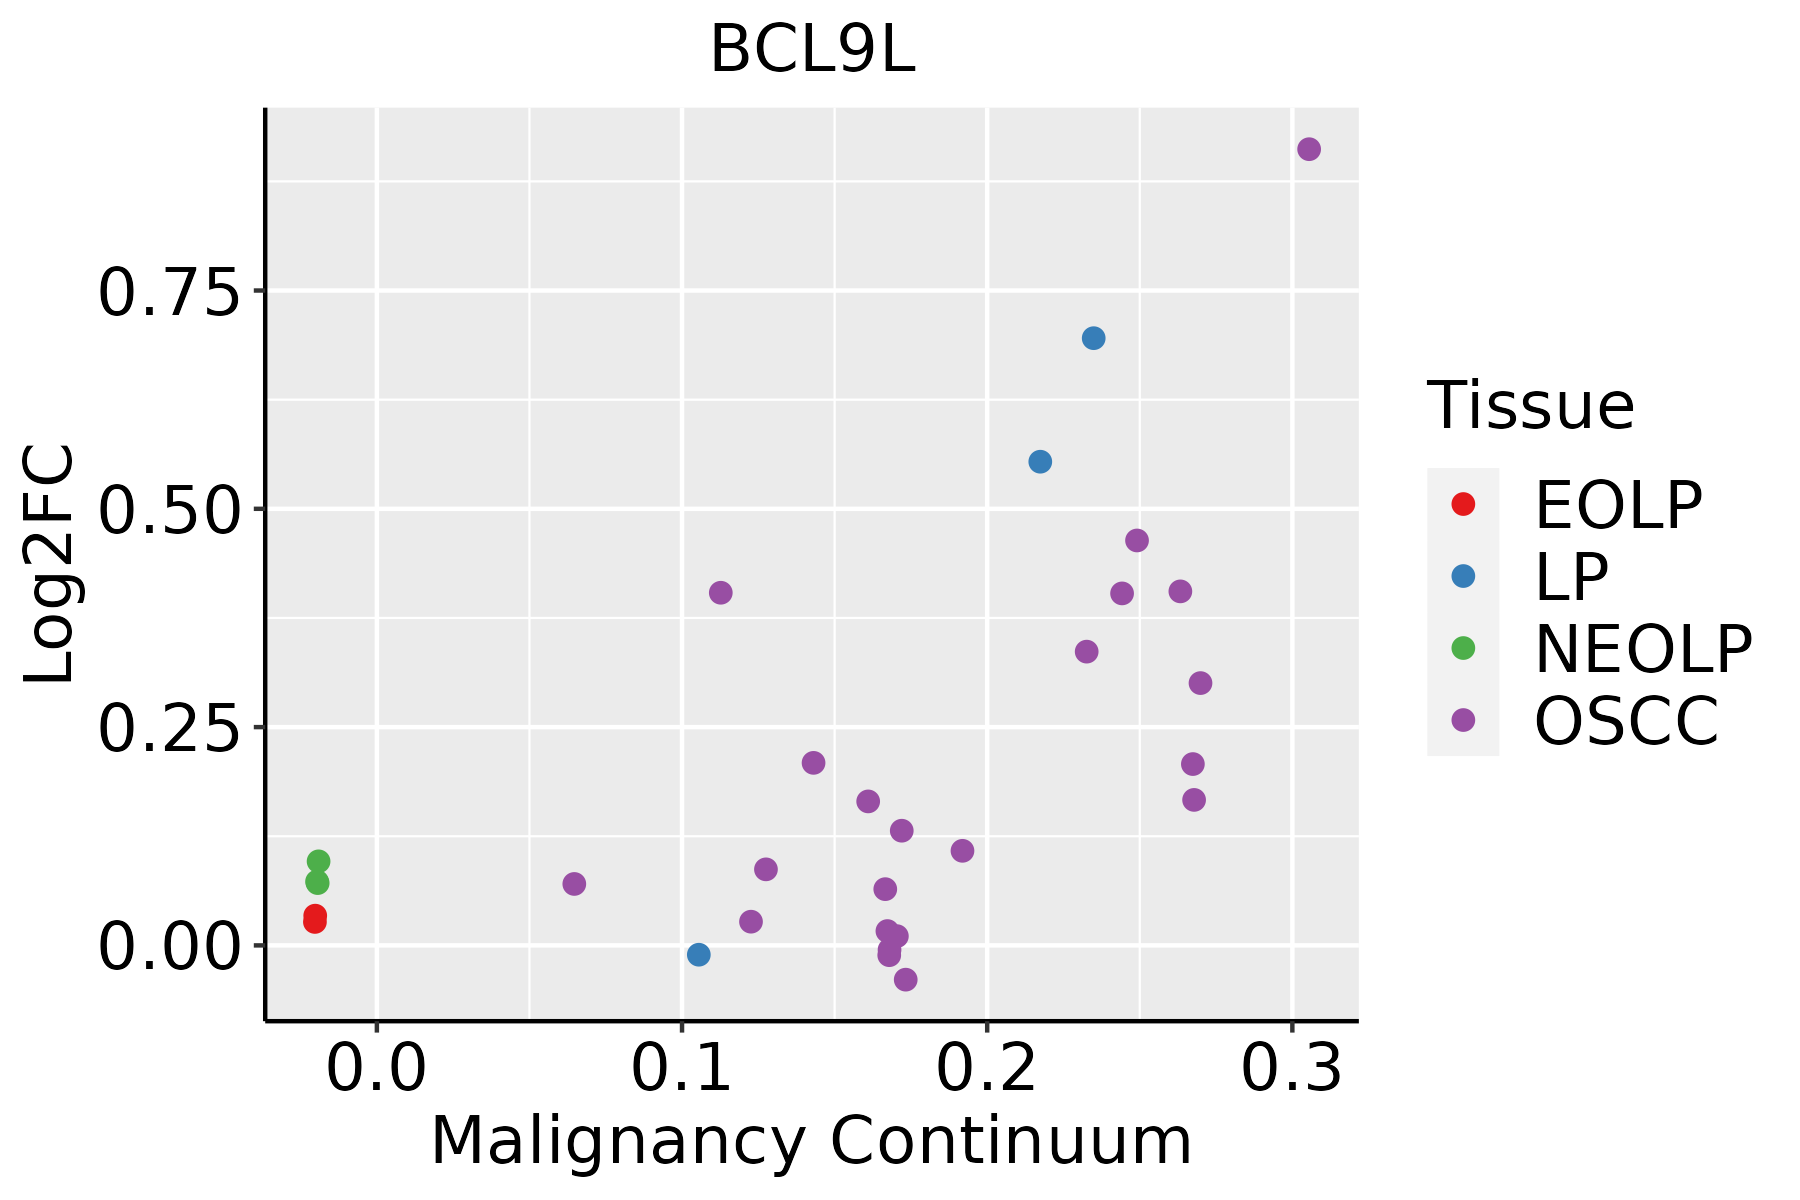
EOLP: Erosive Oral lichen planus
LP: leukoplakia
NEOLP: Non-erosive oral lichen planus
OSCC: Oral squamous cell carcinoma
ThyroidThe image shows the transcriptomic changes along malignancy continuum.log2FC in expression of this searched gene in stem-like cells from each diseased tissue sample relative to stem-like cells in normal samples in each tissue plotted against the malignancy continuum. Samples are colored based on if they are from different disease stage.
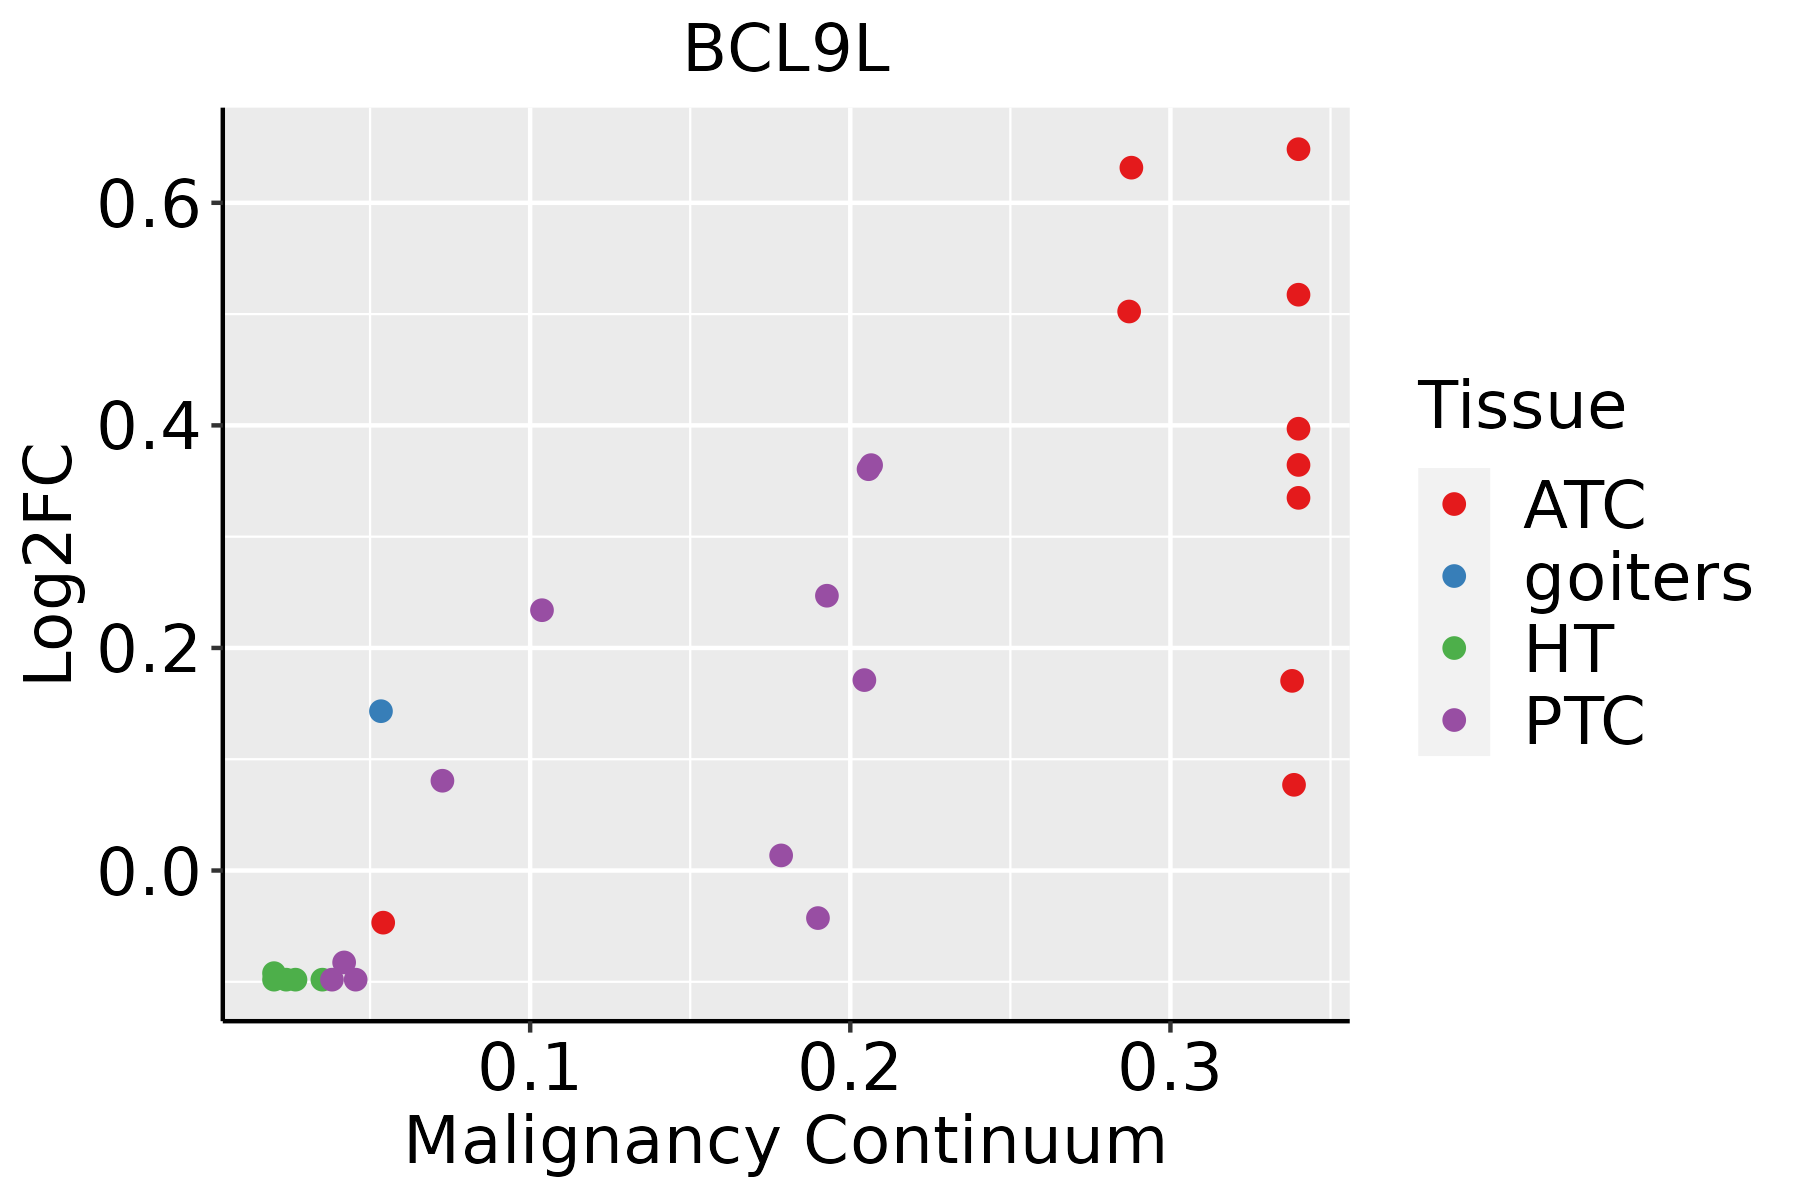
ATC: Anaplastic thyroid cancer
HT: Hashimoto's thyroiditis
PTC: Papillary thyroid cancer
∗log2FC in expression of this searched gene in stem-like cells from each diseased tissue sample relative to stem-like cells in normal samples in each tissue plotted against the malignancy continuum. Samples are colored based on if they are from different disease stage.

Top

Malignant transformation related pathway analysis

check buttonFind out the enriched GO biological processes and KEGG pathways involved in transition from healthy to precancer to cancer
check button Figure of enriched GO biological processes.
TissueDisease StageEnriched GO biological Processes
ColorectumADGO analysis - Figure of enriched GO biological processes: Top 15 enriched GO BP terms are showed in the bar plot of each disease state in each tissue. Each row represents a significant GO biological process which is colored according to the -log10(p.adjust).
ColorectumSERGO analysis - Figure of enriched GO biological processes: Top 15 enriched GO BP terms are showed in the bar plot of each disease state in each tissue. Each row represents a significant GO biological process which is colored according to the -log10(p.adjust).
ColorectumMSSGO analysis - Figure of enriched GO biological processes: Top 15 enriched GO BP terms are showed in the bar plot of each disease state in each tissue. Each row represents a significant GO biological process which is colored according to the -log10(p.adjust).
ColorectumMSI-HGO analysis - Figure of enriched GO biological processes: Top 15 enriched GO BP terms are showed in the bar plot of each disease state in each tissue. Each row represents a significant GO biological process which is colored according to the -log10(p.adjust).
ColorectumFAPGO analysis - Figure of enriched GO biological processes: Top 15 enriched GO BP terms are showed in the bar plot of each disease state in each tissue. Each row represents a significant GO biological process which is colored according to the -log10(p.adjust).
∗Top 15 enriched GO BP terms are showed in the bar plot of each disease state in each tissue. Each row represents a significant GO biological process which is colored according to the -log10(p.adjust).
Page: 1 2 3 4 5 6 7 8 9 

check button Enriched GO biological processes.
GO IDTissueDisease StageDescriptionGene RatioBg Ratiopvaluep.adjustCount
GO:001605516EsophagusHGINWnt signaling pathway83/2587444/187232.27e-032.33e-0283
GO:019873816EsophagusHGINcell-cell signaling by wnt83/2587446/187232.58e-032.55e-0283
GO:001605517EsophagusESCCWnt signaling pathway268/8552444/187232.32e-106.58e-09268
GO:019873817EsophagusESCCcell-cell signaling by wnt269/8552446/187232.41e-106.79e-09269
GO:00715599EsophagusESCCresponse to transforming growth factor beta157/8552256/187232.95e-074.23e-06157
GO:006007016EsophagusESCCcanonical Wnt signaling pathway180/8552303/187239.15e-071.17e-05180
GO:00715609EsophagusESCCcellular response to transforming growth factor beta stimulus151/8552250/187231.78e-062.10e-05151
GO:00107184EsophagusESCCpositive regulation of epithelial to mesenchymal transition40/855252/187234.25e-064.56e-0540
GO:002260420EsophagusESCCregulation of cell morphogenesis180/8552309/187235.19e-065.45e-05180
GO:00071799EsophagusESCCtransforming growth factor beta receptor signaling pathway121/8552198/187238.26e-068.03e-05121
GO:00018378EsophagusESCCepithelial to mesenchymal transition95/8552157/187231.25e-048.56e-0495
GO:000717810EsophagusESCCtransmembrane receptor protein serine/threonine kinase signaling pathway195/8552355/187232.58e-041.58e-03195
GO:00487628EsophagusESCCmesenchymal cell differentiation133/8552236/187235.94e-043.22e-03133
GO:00107174EsophagusESCCregulation of epithelial to mesenchymal transition61/855299/187231.01e-035.09e-0361
GO:00170156EsophagusESCCregulation of transforming growth factor beta receptor signaling pathway75/8552128/187232.19e-039.71e-0375
GO:19038447EsophagusESCCregulation of cellular response to transforming growth factor beta stimulus76/8552131/187232.96e-031.24e-0276
GO:00604856EsophagusESCCmesenchyme development156/8552291/187233.76e-031.53e-02156
GO:002260422LiverHCCregulation of cell morphogenesis188/7958309/187234.84e-111.82e-09188
GO:019873821LiverHCCcell-cell signaling by wnt247/7958446/187232.11e-084.96e-07247
GO:001605521LiverHCCWnt signaling pathway245/7958444/187233.68e-088.09e-07245
Page: 1 2 3 4 5 

check button Enriched KEGG pathways.
Pathway IDTissueDisease StageDescriptionGene RatioBg Ratiopvaluep.adjustqvalueCount
Page: 1 

Top

Cell-cell communication analysis

check buttonIdentification of potential cell-cell interactions between two cell types and their ligand-receptor pairs for different disease states
LigandReceptorLRpairPathwayTissueDisease Stage
Page: 1 

Top

Single-cell gene regulatory network inference analysis

check buttonFind out the significant the regulons (TFs) and the target genes of each regulon across cell types for different disease states
TFCell TypeTissueDisease StageTarget GeneRSSRegulon Activity
∗The dot plots of a searched regulon are shown for all cell subpopulations in each disease state of each tissue based on the regulon specific score inferred using pySCENIC and by calculating the average expression.
Page: 1 

Top

Somatic mutation of malignant transformation related genes

check buttonAnnotation of somatic variants for genes involved in malignant transformation
Hugo SymbolVariant ClassVariant ClassificationdbSNP RSHGVScHGVSpHGVSp ShortSWISSPROTBIOTYPESIFTPolyPhenTumor Sample BarcodeTissueHistologySexAgeStageTherapy TypesDrugsOutcome
BCL9LSNVMissense_Mutationrs200863037c.296N>Tp.Ala99Valp.A99VQ86UU0protein_codingtolerated(0.29)benign(0)TCGA-A2-A4S2-01Breastbreast invasive carcinomaFemale<65III/IVChemotherapyadriamycinCR
BCL9LSNVMissense_Mutationnovelc.2680N>Ap.Pro894Thrp.P894TQ86UU0protein_codingtolerated(0.09)benign(0)TCGA-A7-A0DB-01Breastbreast invasive carcinomaFemale<65I/IIHormone TherapyarimidexSD
BCL9LSNVMissense_Mutationnovelc.197N>Ap.Pro66Hisp.P66HQ86UU0protein_codingdeleterious(0)probably_damaging(0.972)TCGA-AR-A2LJ-01Breastbreast invasive carcinomaFemale<65III/IVChemotherapyadriamycinSD
BCL9LSNVMissense_Mutationc.3290C>Gp.Pro1097Argp.P1097RQ86UU0protein_codingdeleterious(0)probably_damaging(0.997)TCGA-BH-A0C0-01Breastbreast invasive carcinomaFemale<65I/IIChemotherapycarboplatinSD
BCL9LSNVMissense_Mutationc.524C>Ap.Ala175Aspp.A175DQ86UU0protein_codingdeleterious(0.03)possibly_damaging(0.64)TCGA-BH-A0DE-01Breastbreast invasive carcinomaFemale<65I/IIUnknownUnknownSD
BCL9LSNVMissense_Mutationc.325G>Ap.Gly109Serp.G109SQ86UU0protein_codingtolerated(0.14)possibly_damaging(0.622)TCGA-BH-A1FL-01Breastbreast invasive carcinomaFemale>=65I/IIUnknownUnknownPD
BCL9LinsertionIn_Frame_Insnovelc.3332_3343dupCCACCTCAGACGp.Ala1111_Asp1114dupp.A1111_D1114dupQ86UU0protein_codingTCGA-A7-A13D-01Breastbreast invasive carcinomaFemale<65I/IIChemotherapycytoxanSD
BCL9LinsertionIn_Frame_Insnovelc.4160_4161insTTGp.Leu1387_Asn1388insCysp.L1387_N1388insCQ86UU0protein_codingTCGA-A8-A09N-01Breastbreast invasive carcinomaFemale<65III/IVUnknownUnknownSD
BCL9LdeletionFrame_Shift_Delnovelc.472delNp.Asp158ThrfsTer24p.D158Tfs*24Q86UU0protein_codingTCGA-D8-A27V-01Breastbreast invasive carcinomaFemale<65I/IIHormone TherapytamoxiphenSD
BCL9LSNVMissense_Mutationrs34337307c.1897N>Ap.Val633Metp.V633MQ86UU0protein_codingdeleterious(0.05)possibly_damaging(0.511)TCGA-DG-A2KL-01Cervixcervical & endocervical cancerFemale<65I/IIChemotherapycisplatinSD
Page: 1 2 3 4 5 6 7 8 9 10 11 12 13 14 15 16 17 18 19 

Top

Related drugs of malignant transformation related genes

check buttonIdentification of chemicals and drugs interact with genes involved in malignant transfromation
(DGIdb 4.0)
Entrez IDSymbolCategoryInteraction TypesDrug Claim NameDrug NamePMIDs
Page: 1