
|
|||||
|
 | |
| |
| |
| |
| |
| |
|
Gene: BCL7C |
Gene summary for BCL7C |
| Gene information | Species | Human | Gene symbol | BCL7C | Gene ID | 9274 |
| Gene name | BAF chromatin remodeling complex subunit BCL7C | |
| Gene Alias | SMARCJ3 | |
| Cytomap | 16p11.2 | |
| Gene Type | protein-coding | GO ID | GO:0006915 | UniProtAcc | Q8WUZ0 |
Top |
Malignant transformation analysis |
| Identification of the aberrant gene expression in precancerous and cancerous lesions by comparing the gene expression of stem-like cells in diseased tissues with normal stem cells |
| Entrez ID | Symbol | Replicates | Species | Organ | Tissue | Adj P-value | Log2FC | Malignancy |
| 9274 | BCL7C | GSM4909281 | Human | Breast | IDC | 1.83e-25 | 6.44e-01 | 0.21 |
| 9274 | BCL7C | GSM4909282 | Human | Breast | IDC | 2.30e-09 | 4.40e-01 | -0.0288 |
| 9274 | BCL7C | GSM4909286 | Human | Breast | IDC | 4.29e-23 | 4.96e-01 | 0.1081 |
| 9274 | BCL7C | GSM4909291 | Human | Breast | IDC | 6.47e-04 | 3.53e-01 | 0.1753 |
| 9274 | BCL7C | GSM4909295 | Human | Breast | IDC | 4.53e-08 | 4.79e-01 | 0.0898 |
| 9274 | BCL7C | GSM4909298 | Human | Breast | IDC | 1.43e-13 | 4.28e-01 | 0.1551 |
| 9274 | BCL7C | GSM4909306 | Human | Breast | IDC | 1.20e-16 | 5.43e-01 | 0.1564 |
| 9274 | BCL7C | GSM4909311 | Human | Breast | IDC | 1.10e-07 | -1.21e-01 | 0.1534 |
| 9274 | BCL7C | GSM4909317 | Human | Breast | IDC | 4.53e-06 | 2.72e-01 | 0.1355 |
| 9274 | BCL7C | GSM4909319 | Human | Breast | IDC | 2.23e-13 | 1.02e-01 | 0.1563 |
| 9274 | BCL7C | GSM4909321 | Human | Breast | IDC | 1.66e-03 | 1.76e-01 | 0.1559 |
| 9274 | BCL7C | DCIS2 | Human | Breast | DCIS | 8.57e-67 | 3.06e-01 | 0.0085 |
| 9274 | BCL7C | LZE20T | Human | Esophagus | ESCC | 6.34e-07 | 3.46e-01 | 0.0662 |
| 9274 | BCL7C | LZE22D1 | Human | Esophagus | HGIN | 4.27e-03 | 9.13e-02 | 0.0595 |
| 9274 | BCL7C | LZE22T | Human | Esophagus | ESCC | 2.01e-03 | 2.45e-01 | 0.068 |
| 9274 | BCL7C | LZE24T | Human | Esophagus | ESCC | 2.31e-12 | 5.13e-01 | 0.0596 |
| 9274 | BCL7C | LZE21T | Human | Esophagus | ESCC | 9.78e-03 | 3.79e-01 | 0.0655 |
| 9274 | BCL7C | P1T-E | Human | Esophagus | ESCC | 5.68e-13 | 6.60e-01 | 0.0875 |
| 9274 | BCL7C | P2T-E | Human | Esophagus | ESCC | 5.30e-48 | 9.27e-01 | 0.1177 |
| 9274 | BCL7C | P4T-E | Human | Esophagus | ESCC | 3.08e-35 | 8.16e-01 | 0.1323 |
| Page: 1 2 3 4 5 6 7 |
| Tissue | Expression Dynamics | Abbreviation |
| Breast | 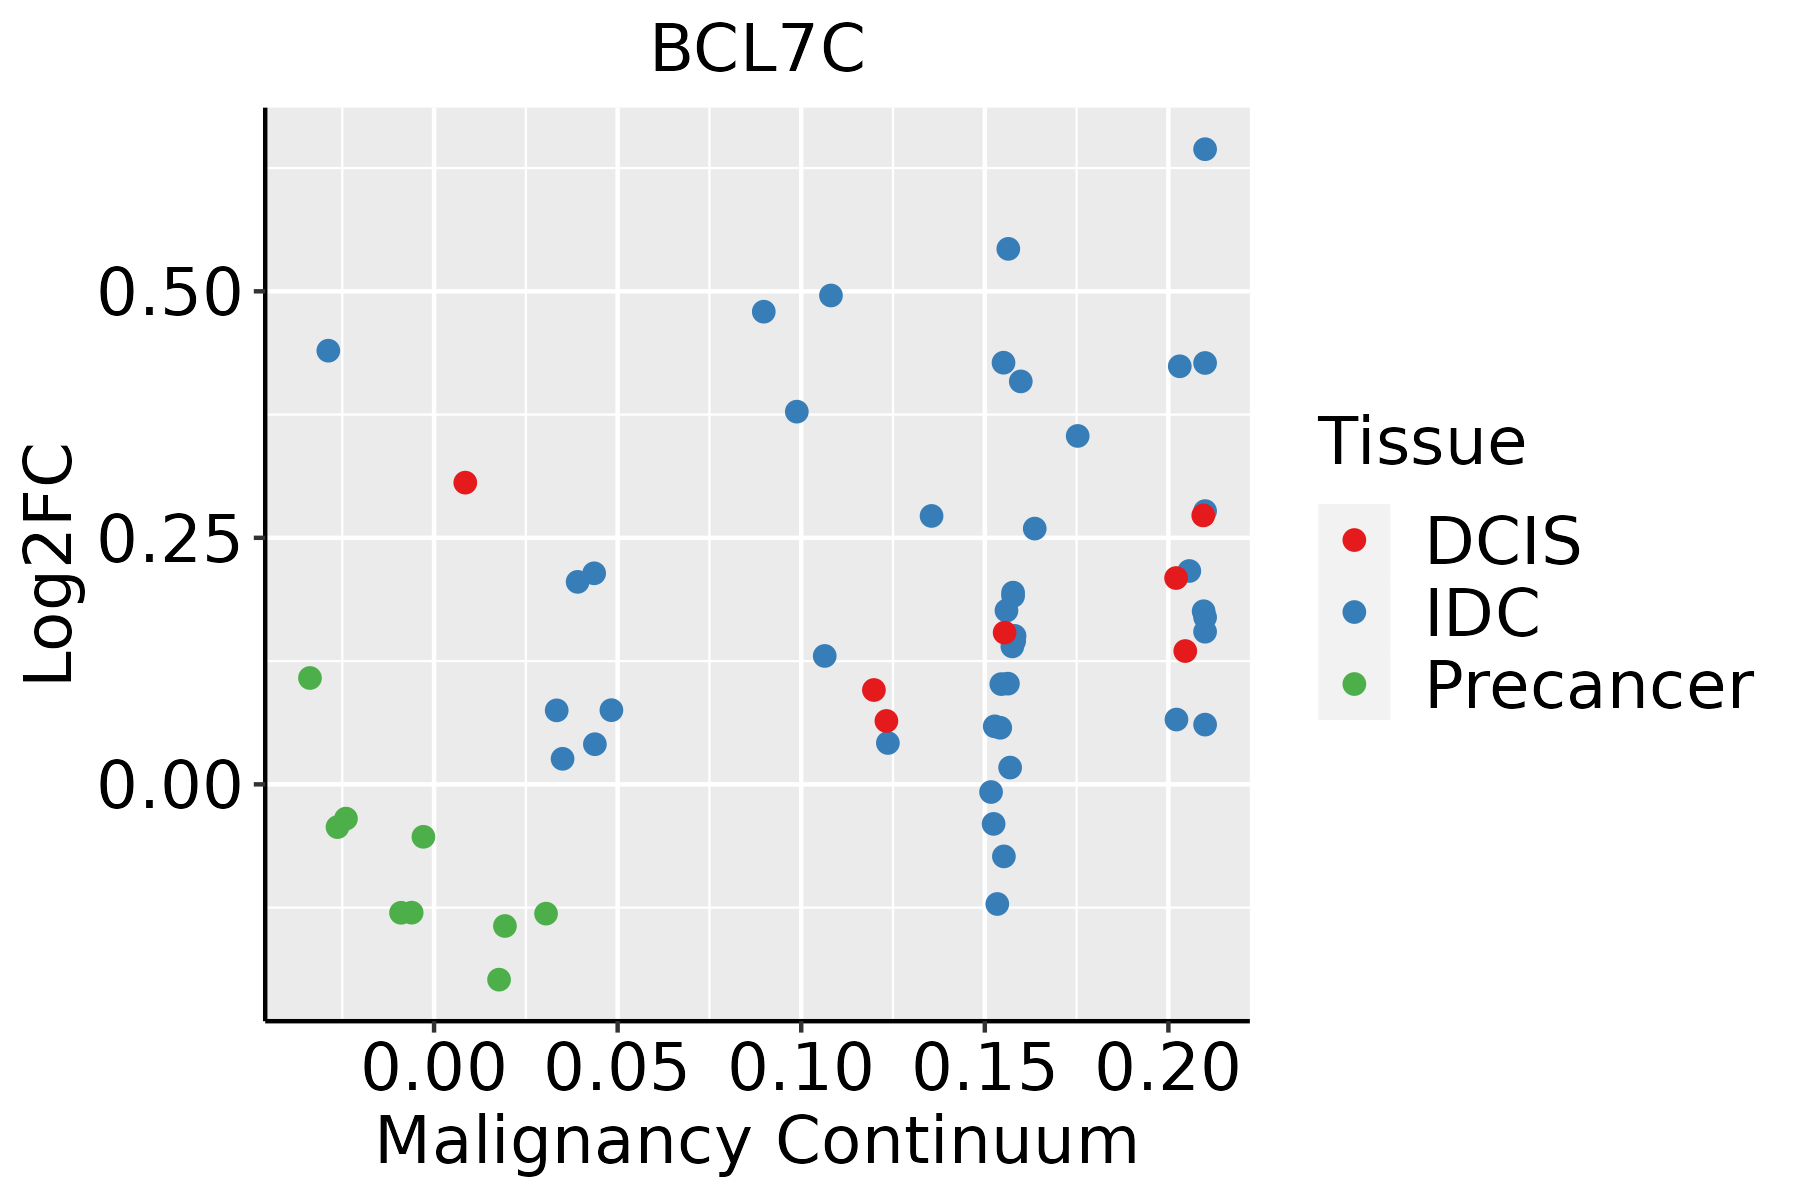 | IDC: Invasive ductal carcinoma |
| DCIS: Ductal carcinoma in situ | ||
| Precancer(BRCA1-mut): Precancerous lesion from BRCA1 mutation carriers | ||
| Esophagus | 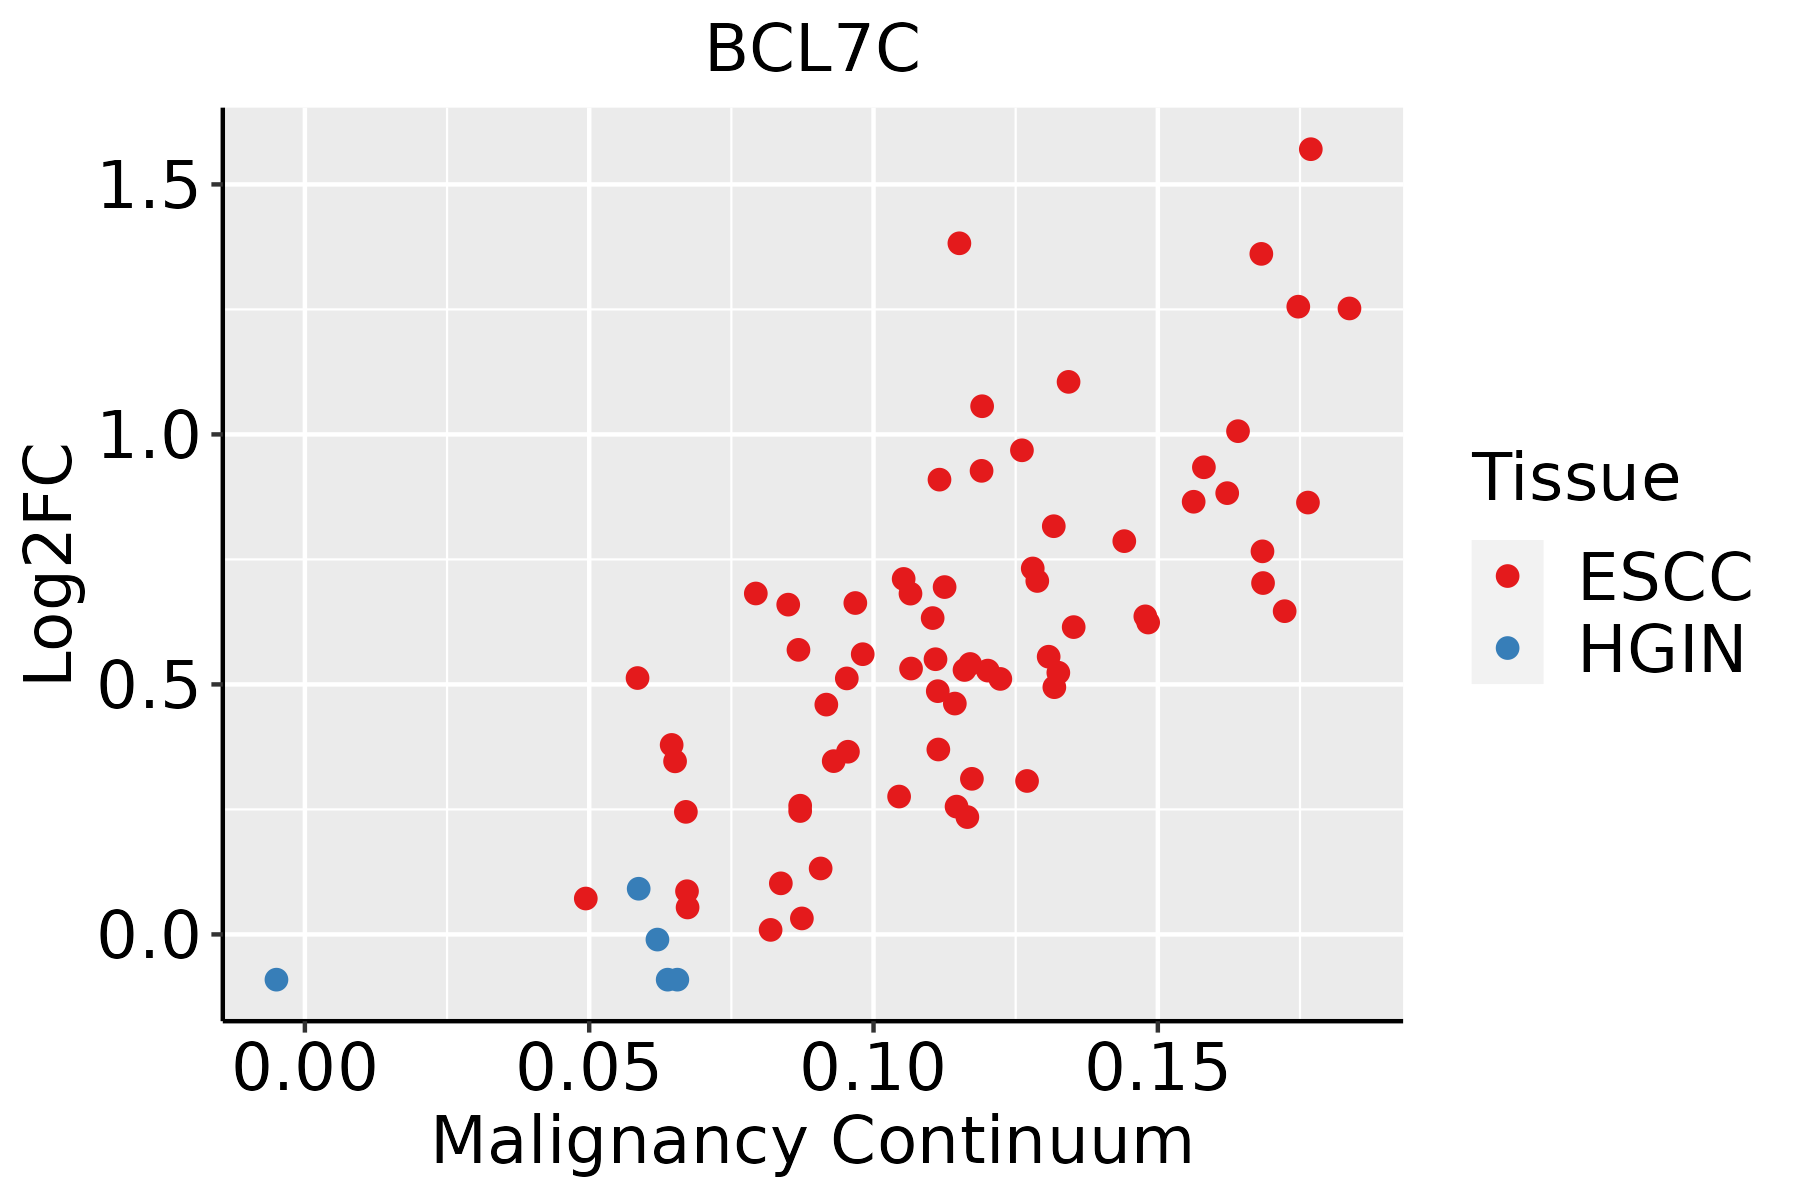 | ESCC: Esophageal squamous cell carcinoma |
| HGIN: High-grade intraepithelial neoplasias | ||
| LGIN: Low-grade intraepithelial neoplasias | ||
| Liver | 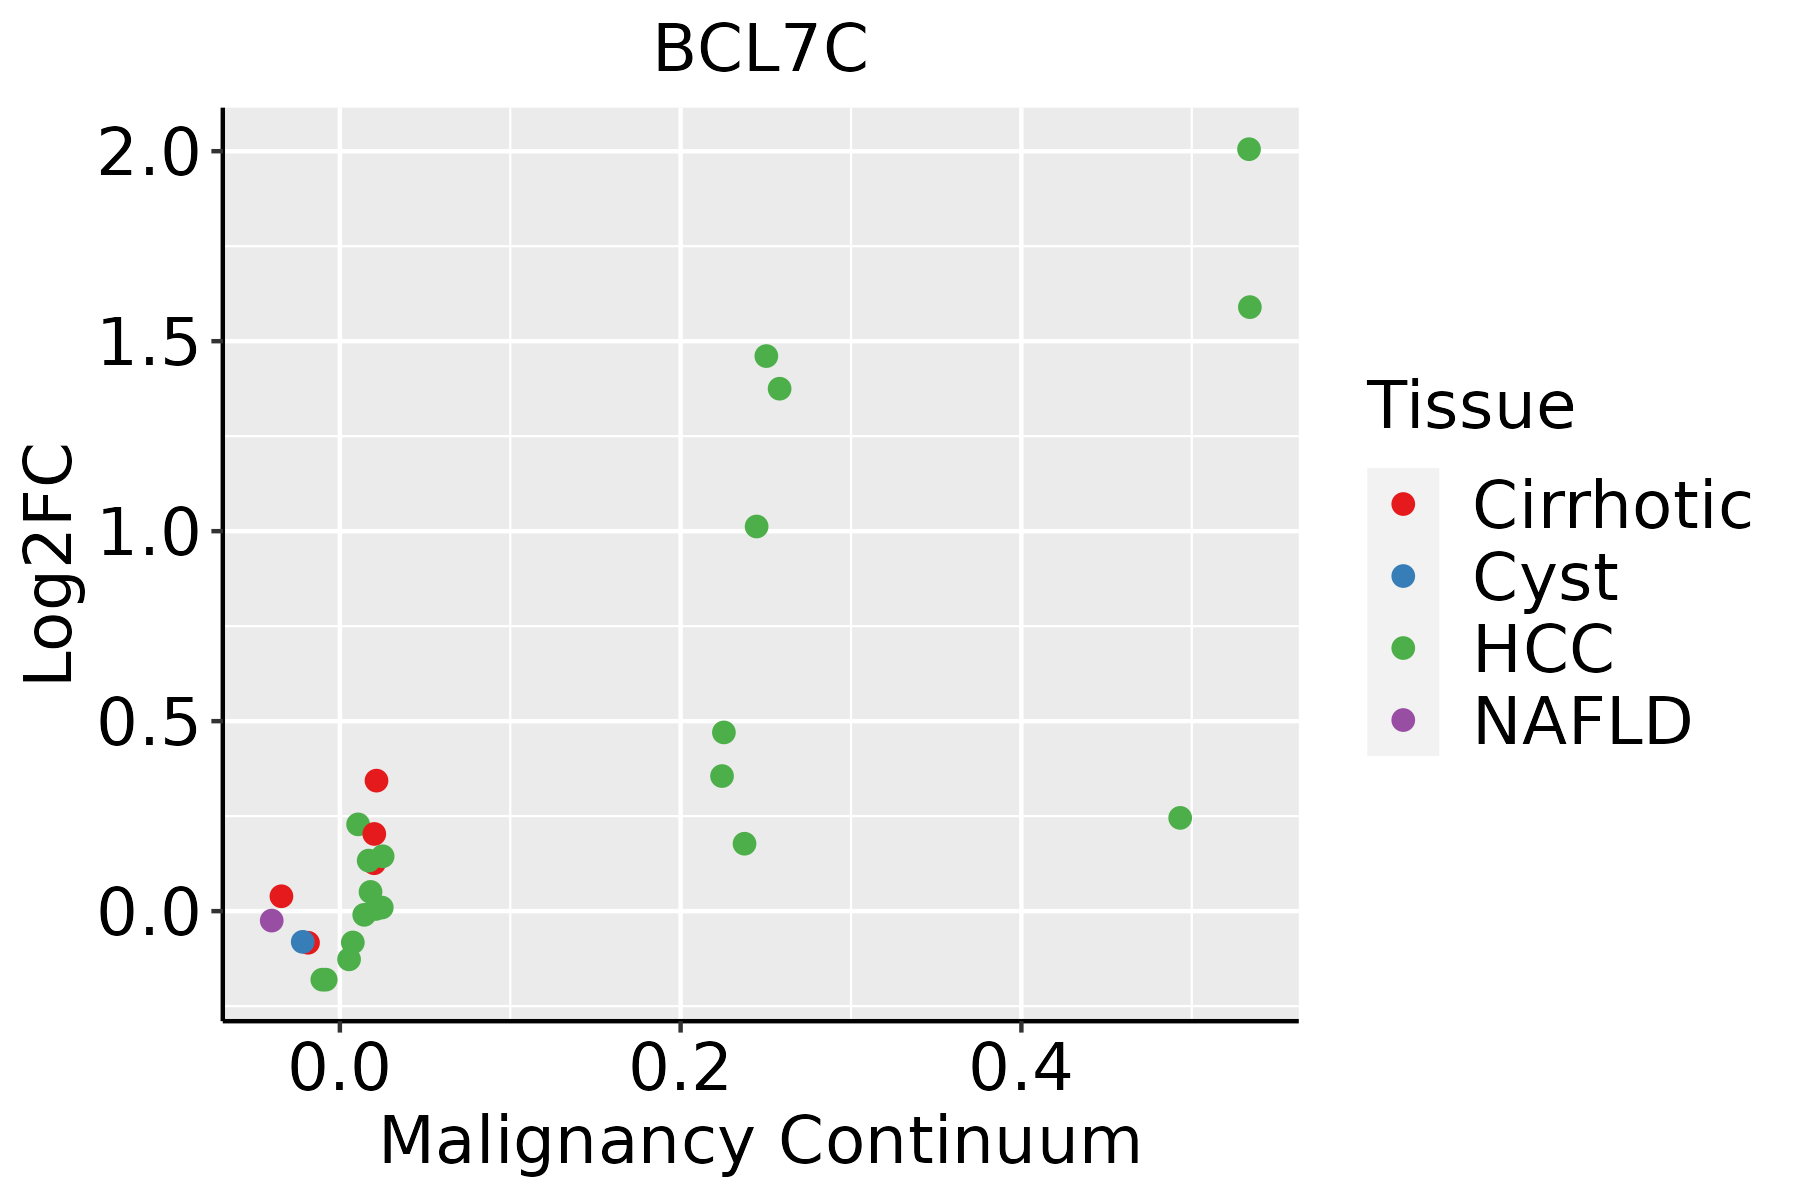 | HCC: Hepatocellular carcinoma |
| NAFLD: Non-alcoholic fatty liver disease | ||
| Oral Cavity | 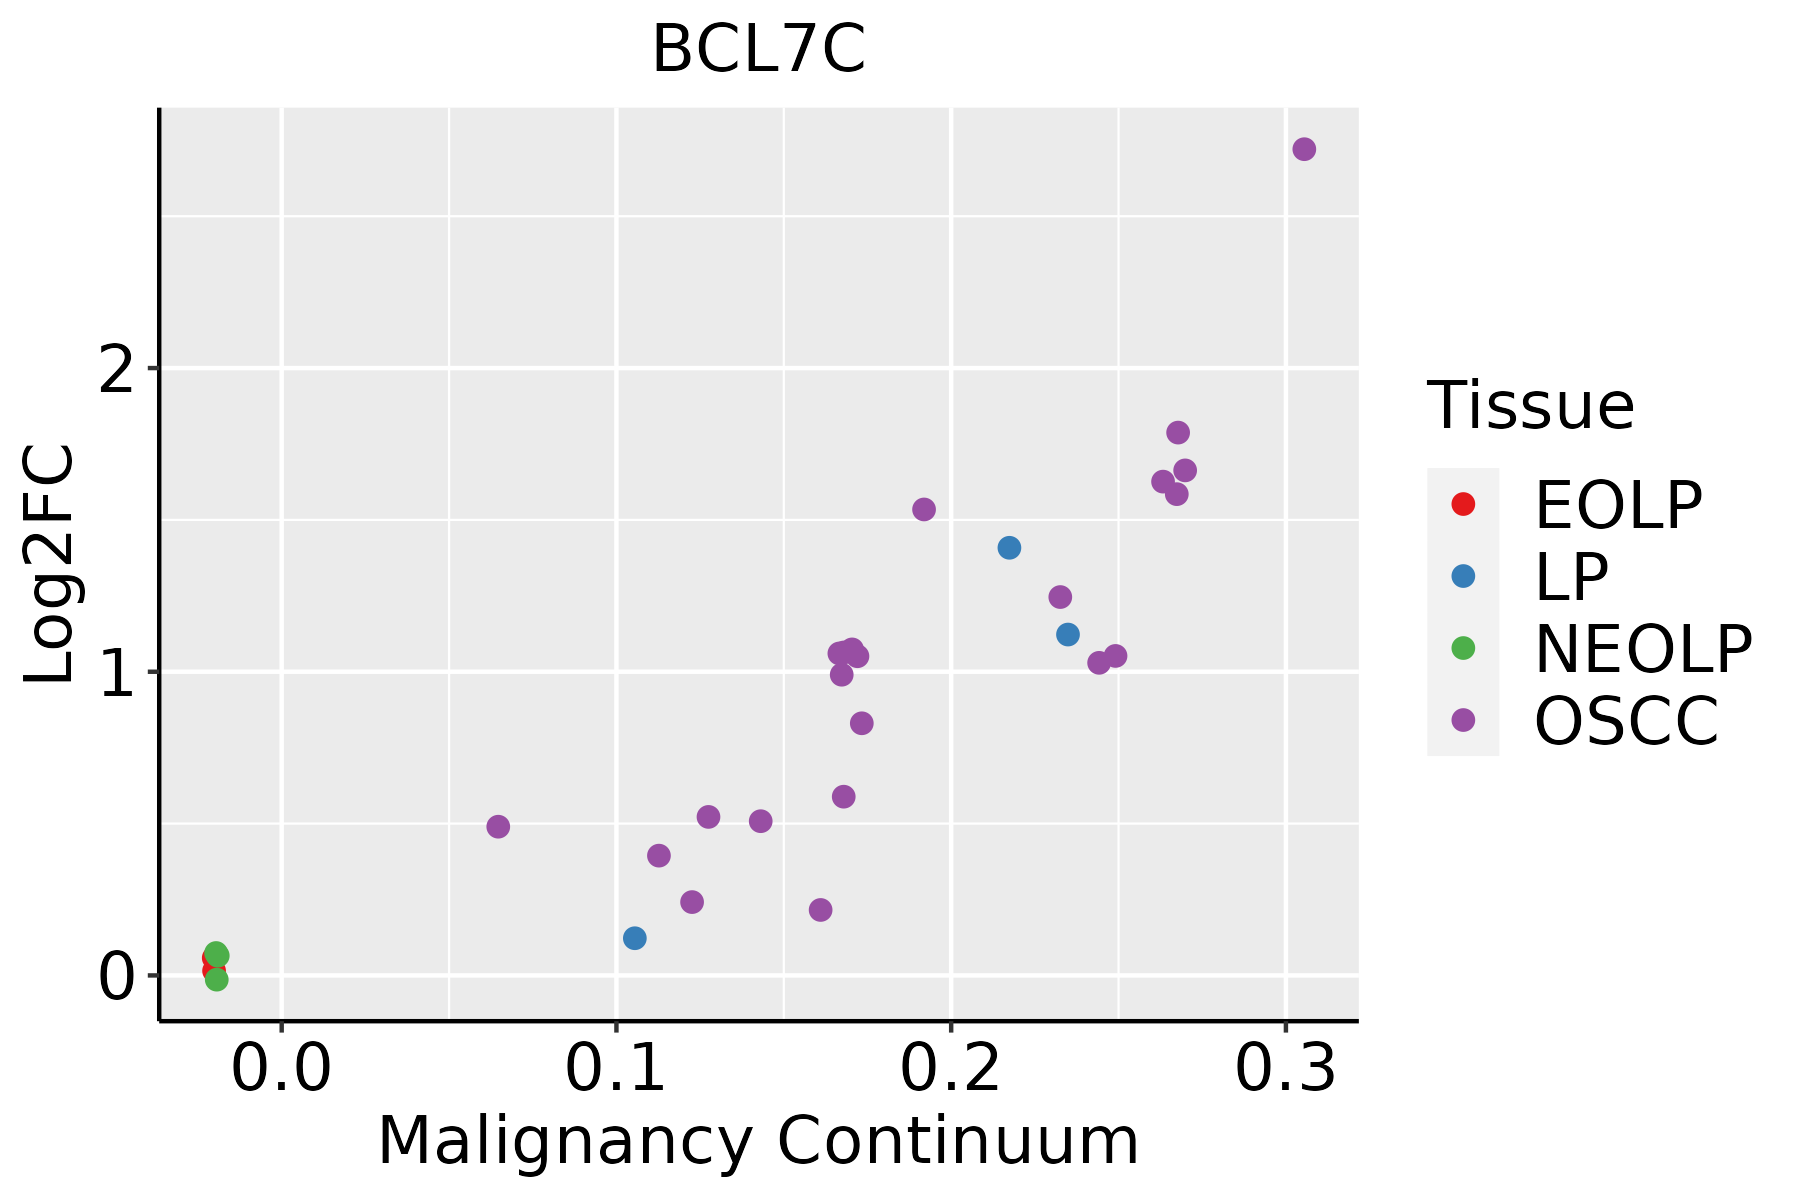 | EOLP: Erosive Oral lichen planus |
| LP: leukoplakia | ||
| NEOLP: Non-erosive oral lichen planus | ||
| OSCC: Oral squamous cell carcinoma | ||
| Skin | 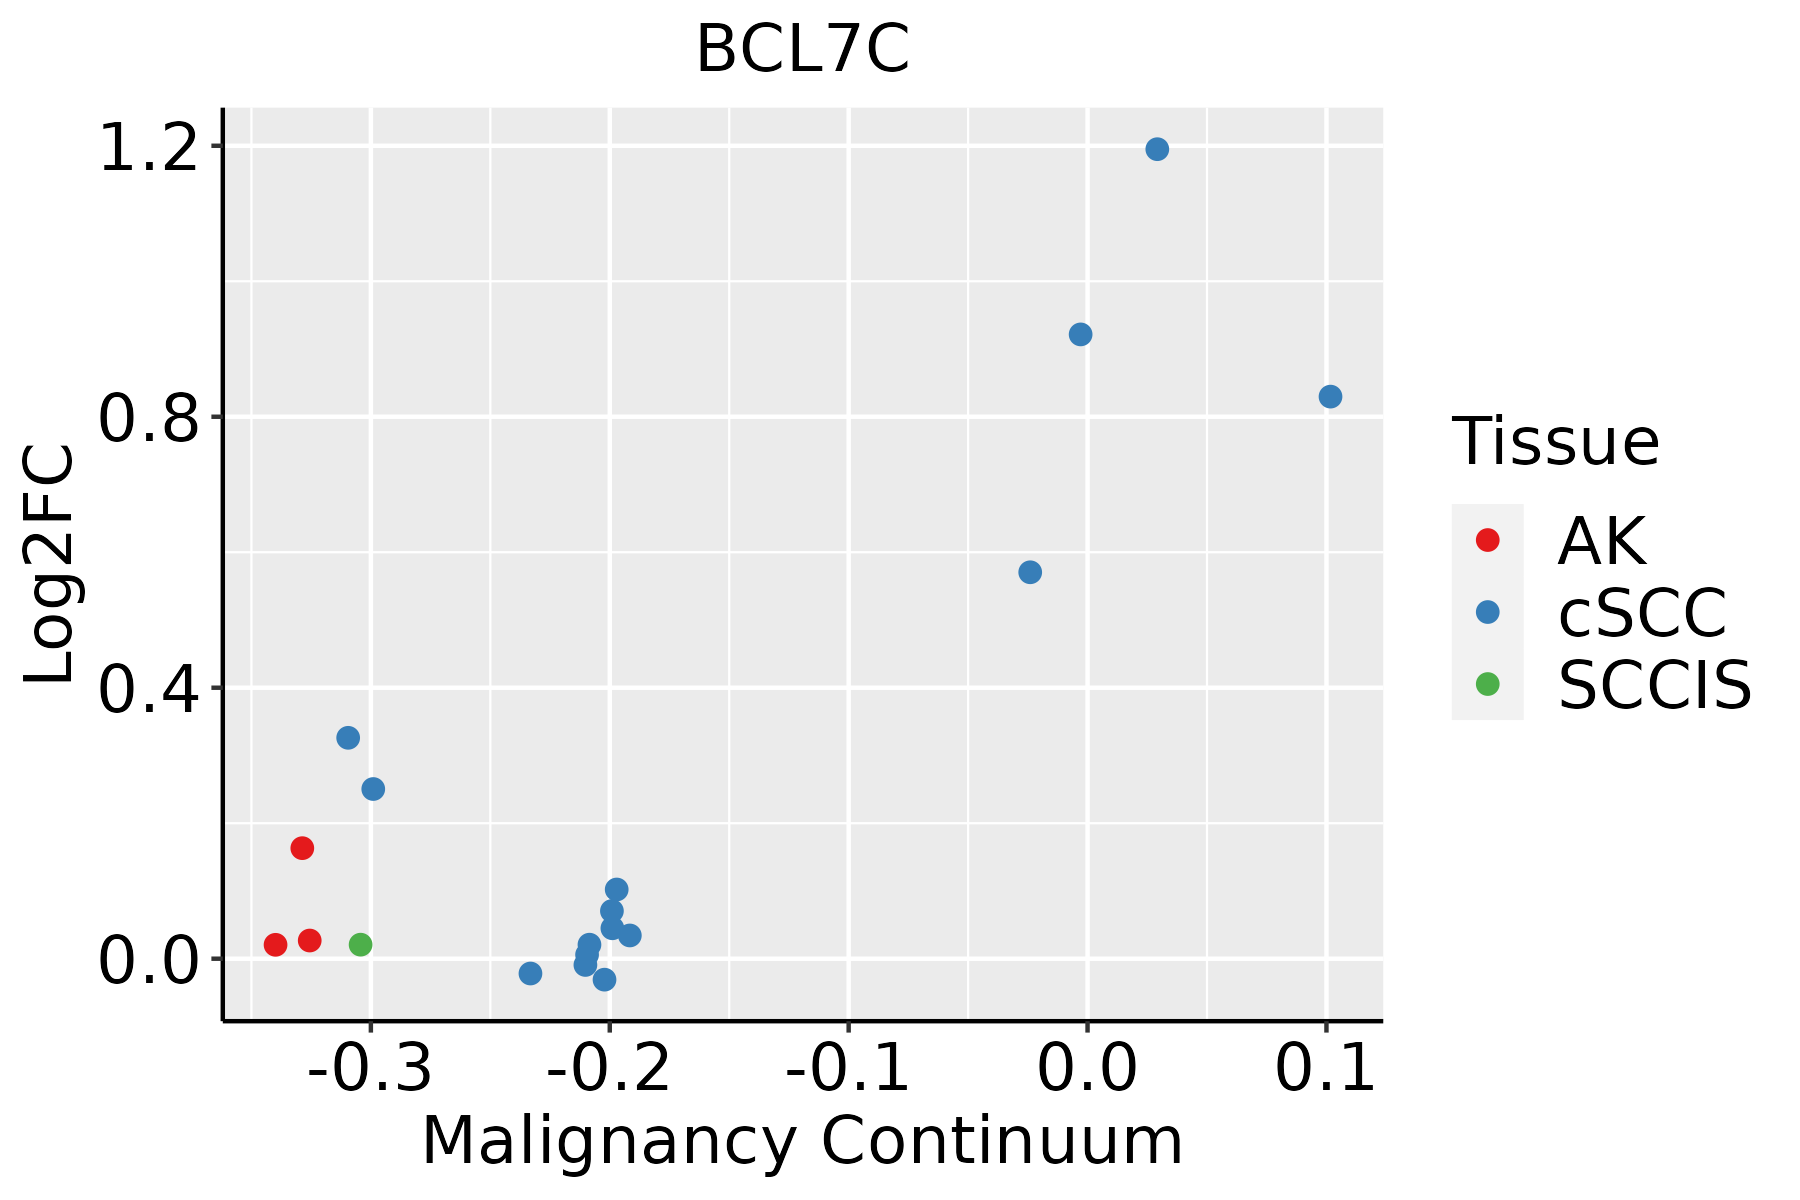 | AK: Actinic keratosis |
| cSCC: Cutaneous squamous cell carcinoma | ||
| SCCIS:squamous cell carcinoma in situ | ||
| Thyroid | 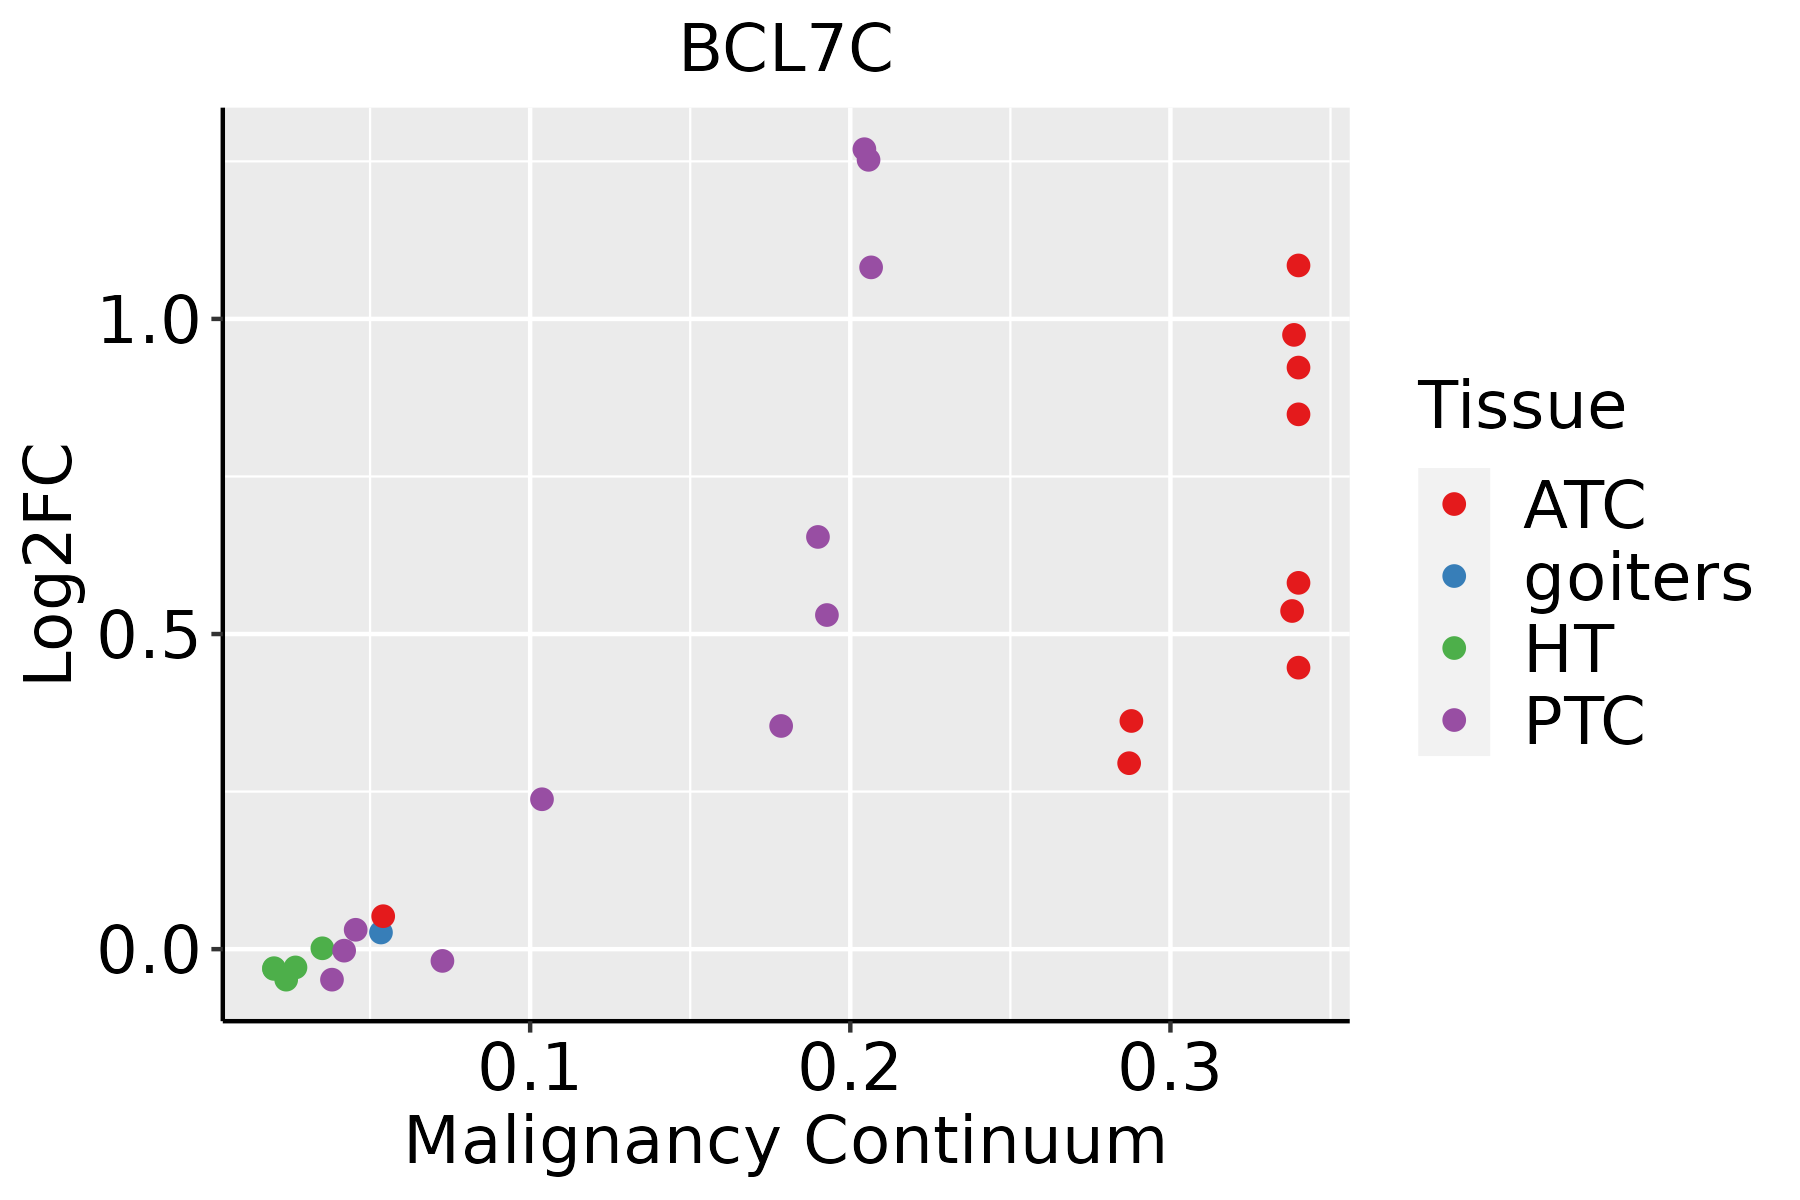 | ATC: Anaplastic thyroid cancer |
| HT: Hashimoto's thyroiditis | ||
| PTC: Papillary thyroid cancer |
| ∗log2FC in expression of this searched gene in stem-like cells from each diseased tissue sample relative to stem-like cells in normal samples in each tissue plotted against the malignancy continuum. Samples are colored based on if they are from different disease stage. |
Top |
Malignant transformation related pathway analysis |
| Find out the enriched GO biological processes and KEGG pathways involved in transition from healthy to precancer to cancer |
| Tissue | Disease Stage | Enriched GO biological Processes |
| Colorectum | AD |  |
| Colorectum | SER |  |
| Colorectum | MSS |  |
| Colorectum | MSI-H |  |
| Colorectum | FAP |  |
| ∗Top 15 enriched GO BP terms are showed in the bar plot of each disease state in each tissue. Each row represents a significant GO biological process which is colored according to the -log10(p.adjust). |
| Page: 1 2 3 4 5 6 7 8 9 |
| GO ID | Tissue | Disease Stage | Description | Gene Ratio | Bg Ratio | pvalue | p.adjust | Count |
| Page: 1 |
| Pathway ID | Tissue | Disease Stage | Description | Gene Ratio | Bg Ratio | pvalue | p.adjust | qvalue | Count |
| Page: 1 |
Top |
Cell-cell communication analysis |
| Identification of potential cell-cell interactions between two cell types and their ligand-receptor pairs for different disease states |
| Ligand | Receptor | LRpair | Pathway | Tissue | Disease Stage |
| Page: 1 |
Top |
Single-cell gene regulatory network inference analysis |
| Find out the significant the regulons (TFs) and the target genes of each regulon across cell types for different disease states |
| TF | Cell Type | Tissue | Disease Stage | Target Gene | RSS | Regulon Activity |
| ∗The dot plots of a searched regulon are shown for all cell subpopulations in each disease state of each tissue based on the regulon specific score inferred using pySCENIC and by calculating the average expression. |
| Page: 1 |
Top |
Somatic mutation of malignant transformation related genes |
| Annotation of somatic variants for genes involved in malignant transformation |
| Hugo Symbol | Variant Class | Variant Classification | dbSNP RS | HGVSc | HGVSp | HGVSp Short | SWISSPROT | BIOTYPE | SIFT | PolyPhen | Tumor Sample Barcode | Tissue | Histology | Sex | Age | Stage | Therapy Types | Drugs | Outcome |
| BCL7C | SNV | Missense_Mutation | rs138503357 | c.131N>A | p.Arg44His | p.R44H | Q8WUZ0 | protein_coding | deleterious(0) | possibly_damaging(0.736) | TCGA-UL-AAZ6-01 | Breast | breast invasive carcinoma | Female | >=65 | I/II | Chemotherapy | herceptin | SD |
| BCL7C | SNV | Missense_Mutation | c.454N>G | p.Ile152Val | p.I152V | Q8WUZ0 | protein_coding | tolerated(1) | benign(0) | TCGA-AA-3877-01 | Colorectum | colon adenocarcinoma | Female | >=65 | I/II | Unknown | Unknown | SD | |
| BCL7C | SNV | Missense_Mutation | novel | c.587N>A | p.Pro196His | p.P196H | Q8WUZ0 | protein_coding | deleterious(0) | possibly_damaging(0.889) | TCGA-AA-3982-01 | Colorectum | colon adenocarcinoma | Male | >=65 | III/IV | Unknown | Unknown | SD |
| BCL7C | SNV | Missense_Mutation | c.617T>A | p.Leu206His | p.L206H | Q8WUZ0 | protein_coding | deleterious_low_confidence(0) | probably_damaging(0.997) | TCGA-AD-6895-01 | Colorectum | colon adenocarcinoma | Male | >=65 | III/IV | Unknown | Unknown | SD | |
| BCL7C | SNV | Missense_Mutation | c.460G>A | p.Ala154Thr | p.A154T | Q8WUZ0 | protein_coding | tolerated(0.09) | benign(0) | TCGA-CK-4951-01 | Colorectum | colon adenocarcinoma | Female | >=65 | I/II | Unknown | Unknown | PD | |
| BCL7C | SNV | Missense_Mutation | rs746313841 | c.647C>T | p.Ala216Val | p.A216V | Q8WUZ0 | protein_coding | tolerated_low_confidence(0.06) | benign(0) | TCGA-EI-6507-01 | Colorectum | rectum adenocarcinoma | Male | <65 | I/II | Unknown | Unknown | SD |
| BCL7C | SNV | Missense_Mutation | rs758429606 | c.368N>A | p.Arg123His | p.R123H | Q8WUZ0 | protein_coding | deleterious(0.05) | possibly_damaging(0.674) | TCGA-AX-A06F-01 | Endometrium | uterine corpus endometrioid carcinoma | Female | <65 | III/IV | Chemotherapy | carboplatin | SD |
| BCL7C | SNV | Missense_Mutation | novel | c.130N>A | p.Arg44Ser | p.R44S | Q8WUZ0 | protein_coding | deleterious(0.01) | benign(0.272) | TCGA-AX-A0IZ-01 | Endometrium | uterine corpus endometrioid carcinoma | Female | <65 | I/II | Unknown | Unknown | SD |
| BCL7C | SNV | Missense_Mutation | rs138503357 | c.131N>A | p.Arg44His | p.R44H | Q8WUZ0 | protein_coding | deleterious(0) | possibly_damaging(0.736) | TCGA-AX-A0J1-01 | Endometrium | uterine corpus endometrioid carcinoma | Female | >=65 | I/II | Unknown | Unknown | SD |
| BCL7C | SNV | Missense_Mutation | rs771270258 | c.670N>A | p.Gly224Arg | p.G224R | Q8WUZ0 | protein_coding | deleterious_low_confidence(0) | benign(0.021) | TCGA-AX-A2HJ-01 | Endometrium | uterine corpus endometrioid carcinoma | Female | <65 | I/II | Unknown | Unknown | SD |
| Page: 1 2 3 |
Top |
Related drugs of malignant transformation related genes |
| Identification of chemicals and drugs interact with genes involved in malignant transfromation |
| (DGIdb 4.0) |
| Entrez ID | Symbol | Category | Interaction Types | Drug Claim Name | Drug Name | PMIDs |
| Page: 1 |

Copyright 2023-Present -The University of Texas Health Science Center at Houston |