
|
|||||
|
 | |
| |
| |
| |
| |
| |
|
Gene: BCL7B |
Gene summary for BCL7B |
| Gene information | Species | Human | Gene symbol | BCL7B | Gene ID | 9275 |
| Gene name | BAF chromatin remodeling complex subunit BCL7B | |
| Gene Alias | SMARCJ2 | |
| Cytomap | 7q11.23 | |
| Gene Type | protein-coding | GO ID | GO:0006915 | UniProtAcc | Q9BQE9 |
Top |
Malignant transformation analysis |
| Identification of the aberrant gene expression in precancerous and cancerous lesions by comparing the gene expression of stem-like cells in diseased tissues with normal stem cells |
| Entrez ID | Symbol | Replicates | Species | Organ | Tissue | Adj P-value | Log2FC | Malignancy |
| 9275 | BCL7B | LZE4T | Human | Esophagus | ESCC | 3.71e-03 | -3.33e-02 | 0.0811 |
| 9275 | BCL7B | LZE5T | Human | Esophagus | ESCC | 1.48e-02 | 6.62e-02 | 0.0514 |
| 9275 | BCL7B | LZE7T | Human | Esophagus | ESCC | 5.42e-04 | 2.81e-02 | 0.0667 |
| 9275 | BCL7B | LZE20T | Human | Esophagus | ESCC | 6.71e-07 | 2.23e-01 | 0.0662 |
| 9275 | BCL7B | LZE24T | Human | Esophagus | ESCC | 3.14e-18 | 5.98e-01 | 0.0596 |
| 9275 | BCL7B | LZE6T | Human | Esophagus | ESCC | 6.44e-03 | -1.34e-02 | 0.0845 |
| 9275 | BCL7B | P1T-E | Human | Esophagus | ESCC | 4.24e-12 | 7.24e-01 | 0.0875 |
| 9275 | BCL7B | P2T-E | Human | Esophagus | ESCC | 2.83e-20 | 3.63e-01 | 0.1177 |
| 9275 | BCL7B | P4T-E | Human | Esophagus | ESCC | 2.87e-33 | 8.77e-01 | 0.1323 |
| 9275 | BCL7B | P5T-E | Human | Esophagus | ESCC | 2.12e-20 | 4.34e-01 | 0.1327 |
| 9275 | BCL7B | P8T-E | Human | Esophagus | ESCC | 1.26e-18 | 4.41e-01 | 0.0889 |
| 9275 | BCL7B | P9T-E | Human | Esophagus | ESCC | 1.86e-18 | 5.71e-01 | 0.1131 |
| 9275 | BCL7B | P10T-E | Human | Esophagus | ESCC | 1.09e-34 | 6.71e-01 | 0.116 |
| 9275 | BCL7B | P11T-E | Human | Esophagus | ESCC | 1.19e-20 | 7.89e-01 | 0.1426 |
| 9275 | BCL7B | P12T-E | Human | Esophagus | ESCC | 4.58e-37 | 8.54e-01 | 0.1122 |
| 9275 | BCL7B | P15T-E | Human | Esophagus | ESCC | 3.19e-38 | 9.55e-01 | 0.1149 |
| 9275 | BCL7B | P16T-E | Human | Esophagus | ESCC | 5.93e-31 | 7.67e-01 | 0.1153 |
| 9275 | BCL7B | P17T-E | Human | Esophagus | ESCC | 3.45e-08 | 4.24e-01 | 0.1278 |
| 9275 | BCL7B | P19T-E | Human | Esophagus | ESCC | 1.13e-08 | 9.27e-01 | 0.1662 |
| 9275 | BCL7B | P20T-E | Human | Esophagus | ESCC | 4.64e-19 | 4.86e-01 | 0.1124 |
| Page: 1 2 3 4 5 6 |
| Tissue | Expression Dynamics | Abbreviation |
| Esophagus | 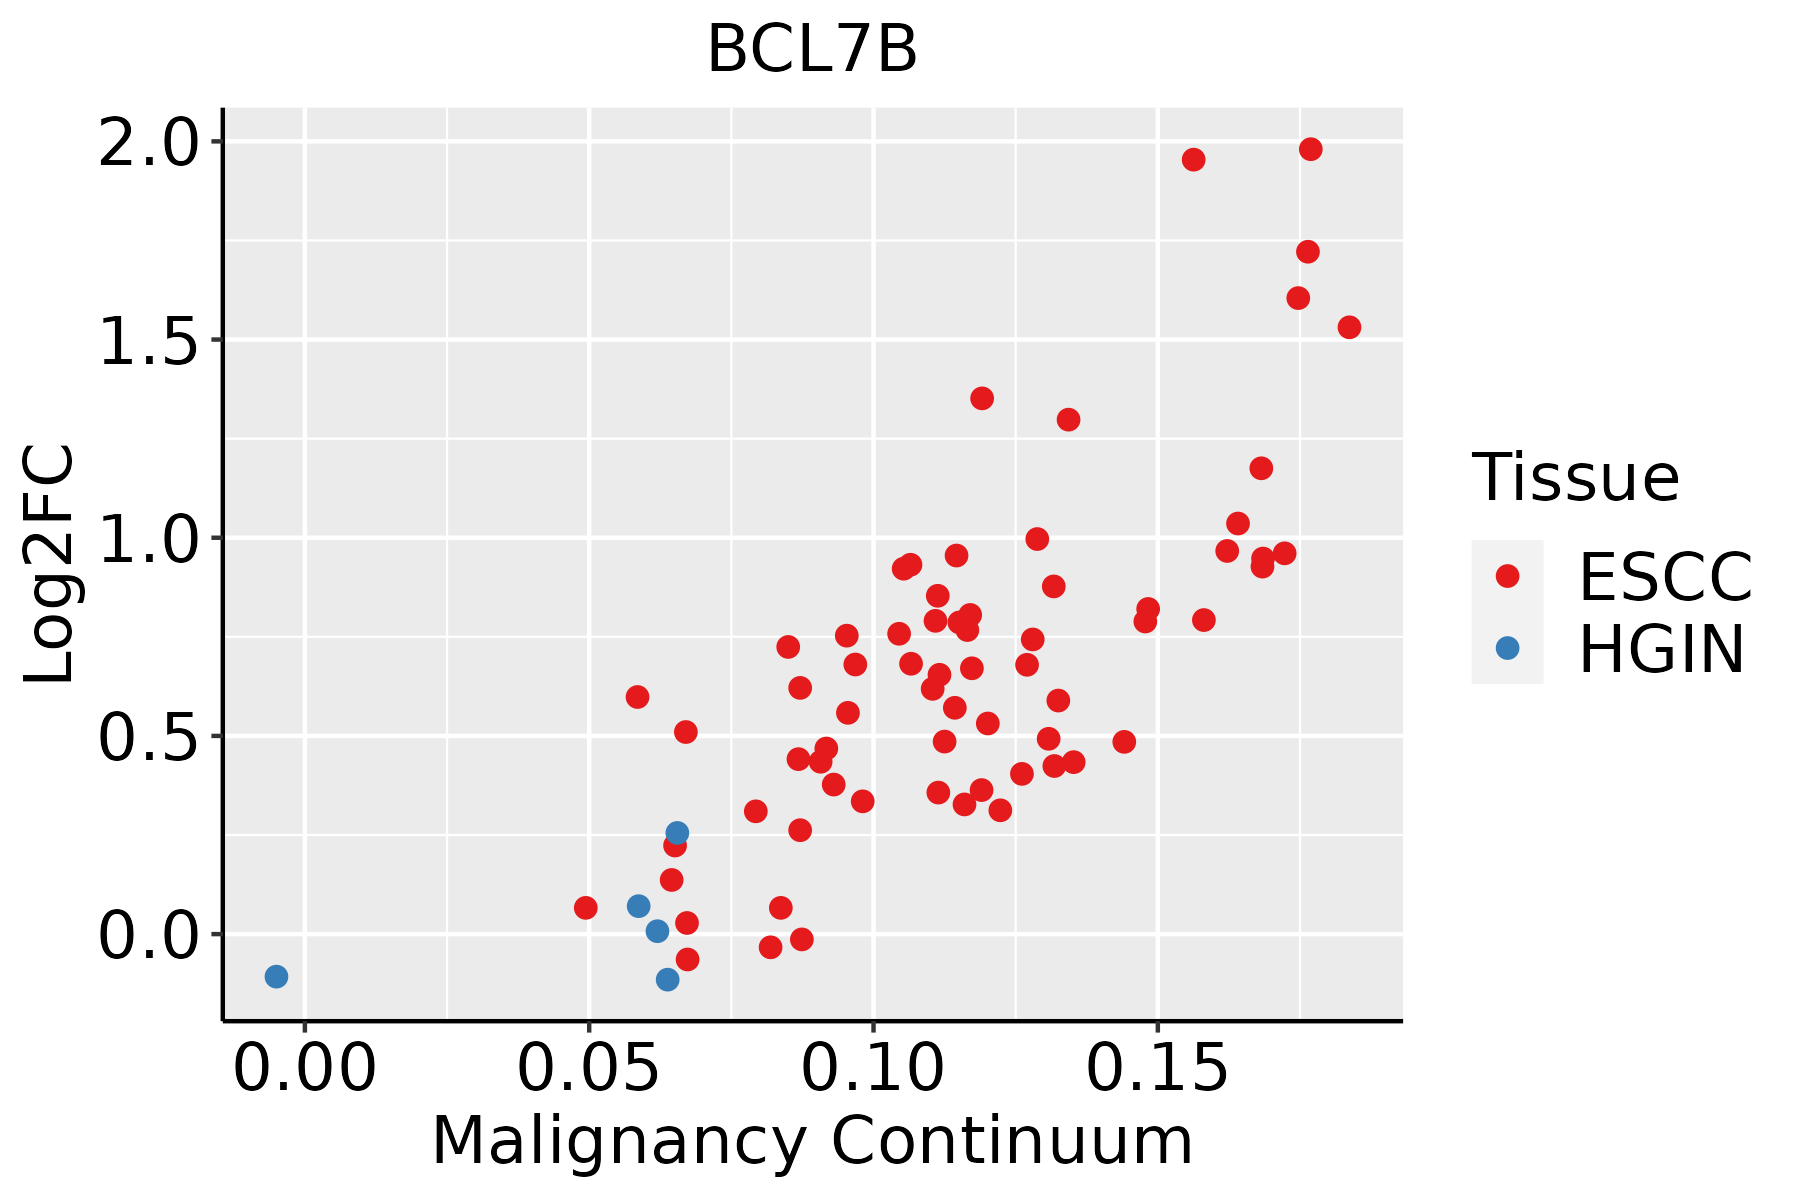 | ESCC: Esophageal squamous cell carcinoma |
| HGIN: High-grade intraepithelial neoplasias | ||
| LGIN: Low-grade intraepithelial neoplasias | ||
| Liver | 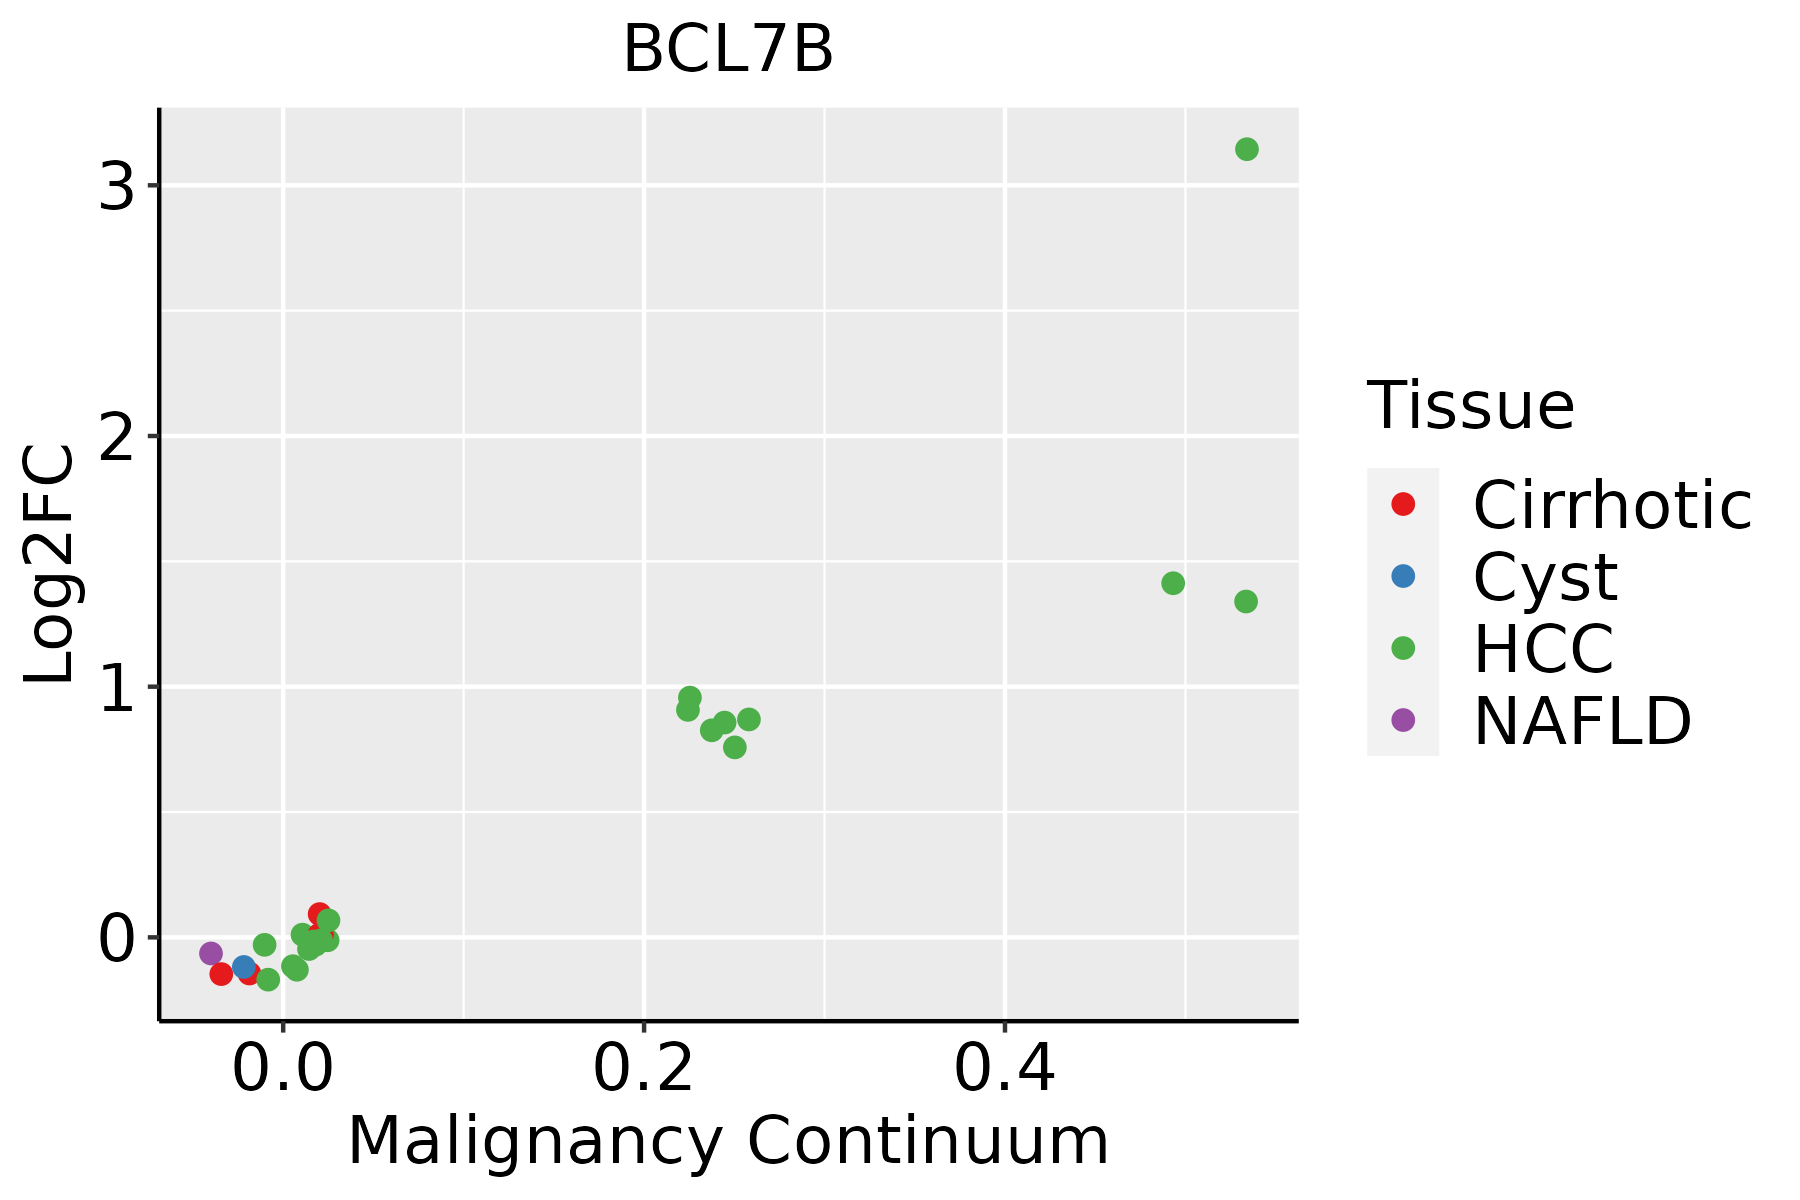 | HCC: Hepatocellular carcinoma |
| NAFLD: Non-alcoholic fatty liver disease | ||
| Oral Cavity | 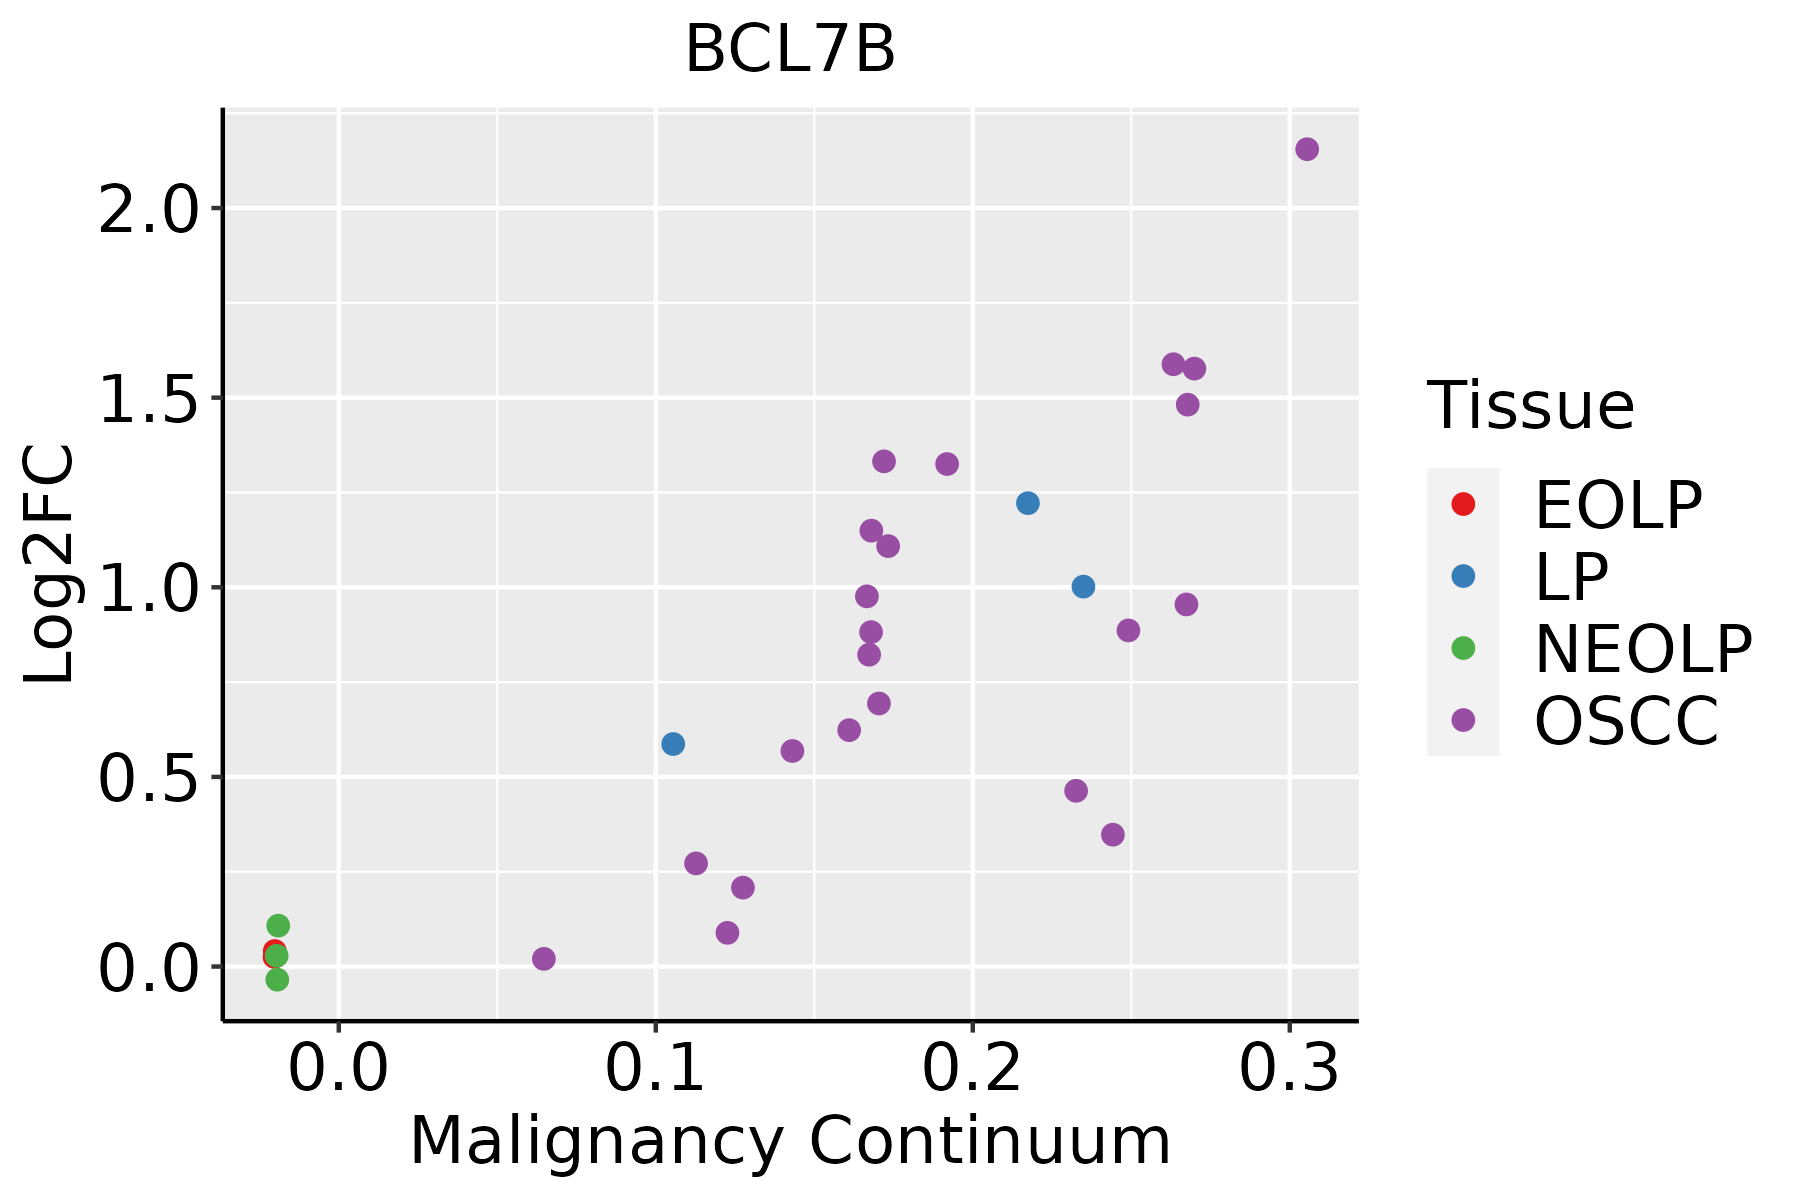 | EOLP: Erosive Oral lichen planus |
| LP: leukoplakia | ||
| NEOLP: Non-erosive oral lichen planus | ||
| OSCC: Oral squamous cell carcinoma | ||
| Skin | 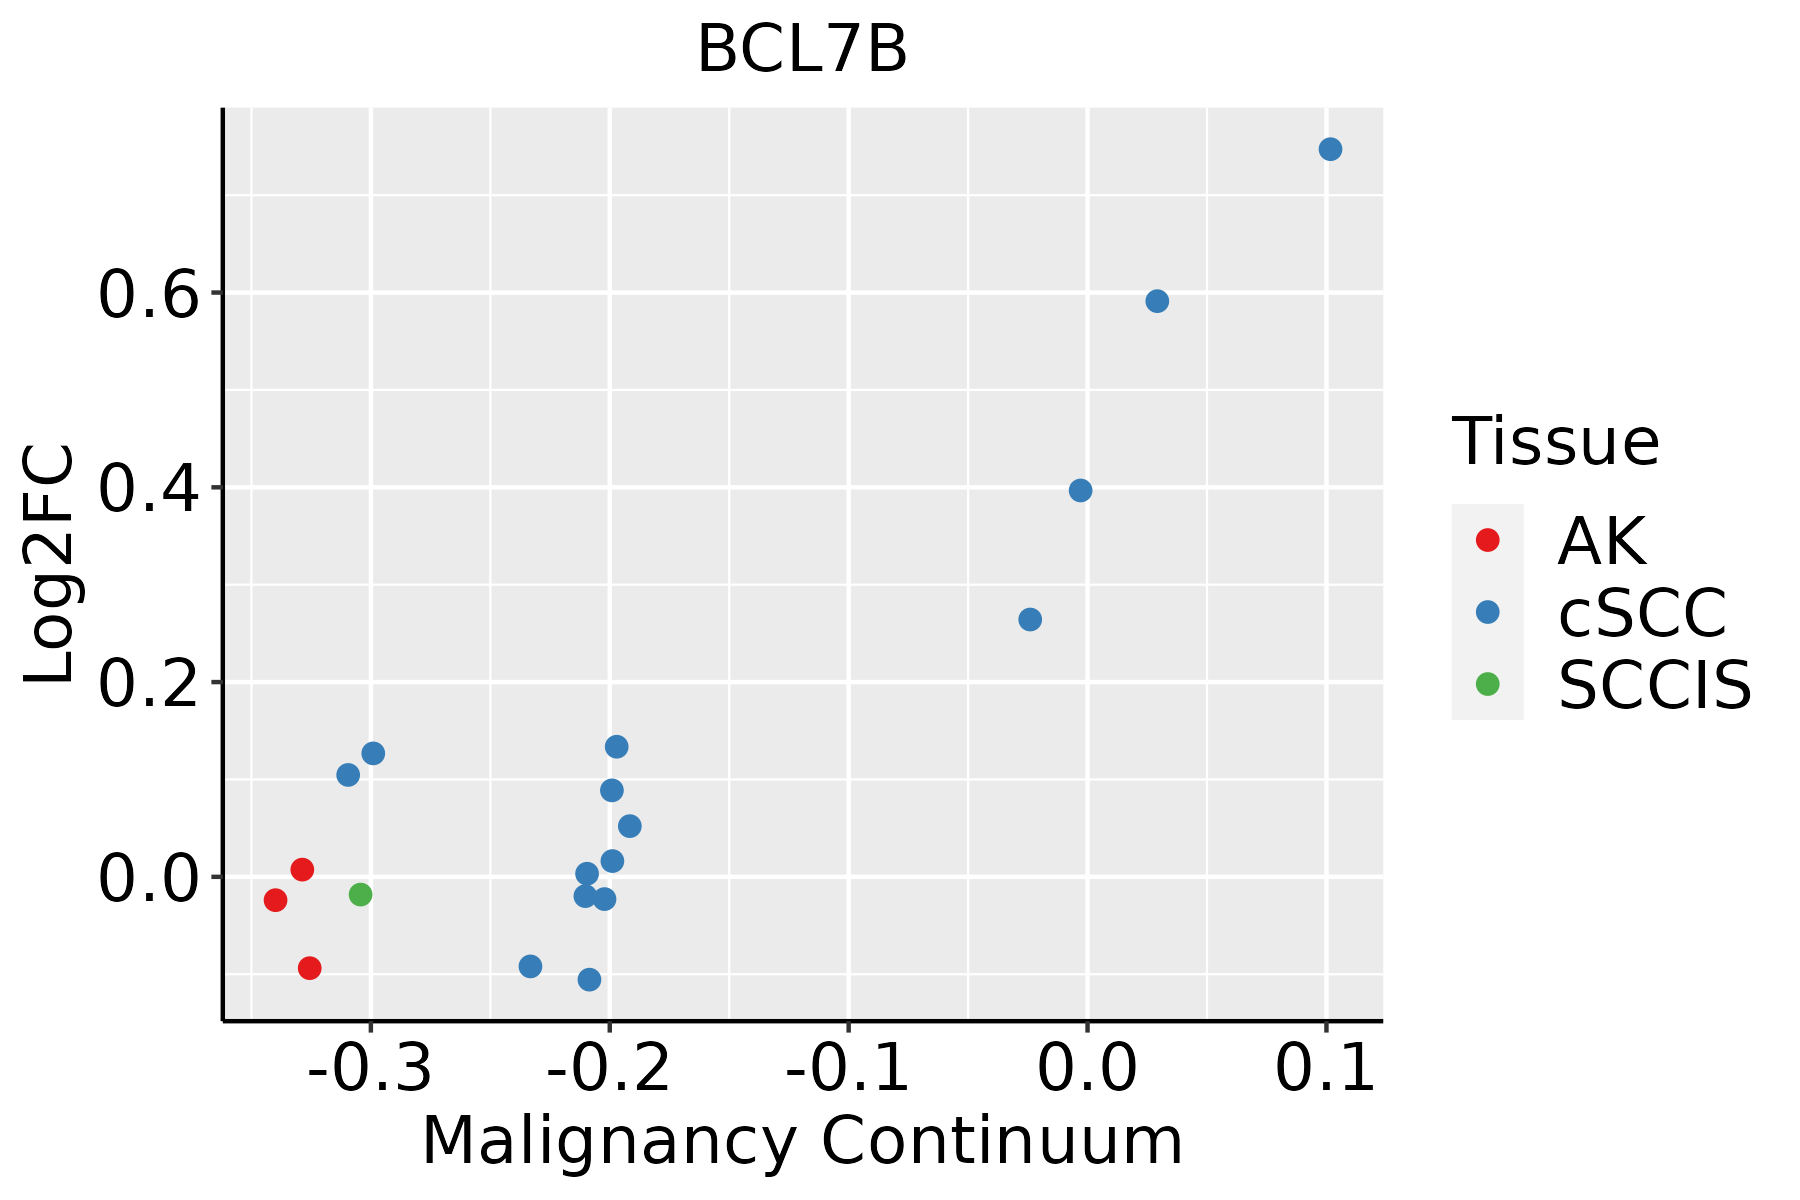 | AK: Actinic keratosis |
| cSCC: Cutaneous squamous cell carcinoma | ||
| SCCIS:squamous cell carcinoma in situ | ||
| Thyroid |  | ATC: Anaplastic thyroid cancer |
| HT: Hashimoto's thyroiditis | ||
| PTC: Papillary thyroid cancer |
| ∗log2FC in expression of this searched gene in stem-like cells from each diseased tissue sample relative to stem-like cells in normal samples in each tissue plotted against the malignancy continuum. Samples are colored based on if they are from different disease stage. |
Top |
Malignant transformation related pathway analysis |
| Find out the enriched GO biological processes and KEGG pathways involved in transition from healthy to precancer to cancer |
| Tissue | Disease Stage | Enriched GO biological Processes |
| Colorectum | AD |  |
| Colorectum | SER |  |
| Colorectum | MSS |  |
| Colorectum | MSI-H |  |
| Colorectum | FAP |  |
| ∗Top 15 enriched GO BP terms are showed in the bar plot of each disease state in each tissue. Each row represents a significant GO biological process which is colored according to the -log10(p.adjust). |
| Page: 1 2 3 4 5 6 7 8 9 |
| GO ID | Tissue | Disease Stage | Description | Gene Ratio | Bg Ratio | pvalue | p.adjust | Count |
| GO:001605517 | Esophagus | ESCC | Wnt signaling pathway | 268/8552 | 444/18723 | 2.32e-10 | 6.58e-09 | 268 |
| GO:019873817 | Esophagus | ESCC | cell-cell signaling by wnt | 269/8552 | 446/18723 | 2.41e-10 | 6.79e-09 | 269 |
| GO:001605511 | Liver | Cirrhotic | Wnt signaling pathway | 150/4634 | 444/18723 | 9.75e-06 | 1.42e-04 | 150 |
| GO:019873811 | Liver | Cirrhotic | cell-cell signaling by wnt | 150/4634 | 446/18723 | 1.28e-05 | 1.80e-04 | 150 |
| GO:019873821 | Liver | HCC | cell-cell signaling by wnt | 247/7958 | 446/18723 | 2.11e-08 | 4.96e-07 | 247 |
| GO:001605521 | Liver | HCC | Wnt signaling pathway | 245/7958 | 444/18723 | 3.68e-08 | 8.09e-07 | 245 |
| GO:001605510 | Oral cavity | OSCC | Wnt signaling pathway | 227/7305 | 444/18723 | 1.10e-07 | 1.87e-06 | 227 |
| GO:019873810 | Oral cavity | OSCC | cell-cell signaling by wnt | 227/7305 | 446/18723 | 1.75e-07 | 2.86e-06 | 227 |
| GO:001605515 | Oral cavity | LP | Wnt signaling pathway | 140/4623 | 444/18723 | 5.80e-04 | 5.35e-03 | 140 |
| GO:019873815 | Oral cavity | LP | cell-cell signaling by wnt | 140/4623 | 446/18723 | 7.12e-04 | 6.38e-03 | 140 |
| GO:001605524 | Skin | cSCC | Wnt signaling pathway | 158/4864 | 444/18723 | 3.80e-06 | 5.70e-05 | 158 |
| GO:019873824 | Skin | cSCC | cell-cell signaling by wnt | 158/4864 | 446/18723 | 5.08e-06 | 7.38e-05 | 158 |
| GO:0016055110 | Thyroid | PTC | Wnt signaling pathway | 217/5968 | 444/18723 | 3.71e-14 | 2.30e-12 | 217 |
| GO:0198738110 | Thyroid | PTC | cell-cell signaling by wnt | 217/5968 | 446/18723 | 6.68e-14 | 3.73e-12 | 217 |
| GO:001605525 | Thyroid | ATC | Wnt signaling pathway | 234/6293 | 444/18723 | 4.64e-17 | 4.31e-15 | 234 |
| GO:019873825 | Thyroid | ATC | cell-cell signaling by wnt | 234/6293 | 446/18723 | 9.26e-17 | 8.25e-15 | 234 |
| Page: 1 |
| Pathway ID | Tissue | Disease Stage | Description | Gene Ratio | Bg Ratio | pvalue | p.adjust | qvalue | Count |
| Page: 1 |
Top |
Cell-cell communication analysis |
| Identification of potential cell-cell interactions between two cell types and their ligand-receptor pairs for different disease states |
| Ligand | Receptor | LRpair | Pathway | Tissue | Disease Stage |
| Page: 1 |
Top |
Single-cell gene regulatory network inference analysis |
| Find out the significant the regulons (TFs) and the target genes of each regulon across cell types for different disease states |
| TF | Cell Type | Tissue | Disease Stage | Target Gene | RSS | Regulon Activity |
| ∗The dot plots of a searched regulon are shown for all cell subpopulations in each disease state of each tissue based on the regulon specific score inferred using pySCENIC and by calculating the average expression. |
| Page: 1 |
Top |
Somatic mutation of malignant transformation related genes |
| Annotation of somatic variants for genes involved in malignant transformation |
| Hugo Symbol | Variant Class | Variant Classification | dbSNP RS | HGVSc | HGVSp | HGVSp Short | SWISSPROT | BIOTYPE | SIFT | PolyPhen | Tumor Sample Barcode | Tissue | Histology | Sex | Age | Stage | Therapy Types | Drugs | Outcome |
| BCL7B | SNV | Missense_Mutation | novel | c.266N>T | p.Ser89Leu | p.S89L | protein_coding | tolerated(0.3) | benign(0.373) | TCGA-A1-A0SH-01 | Breast | breast invasive carcinoma | Female | <65 | I/II | Chemotherapy | tc | SD | |
| BCL7B | SNV | Missense_Mutation | rs545962743 | c.13C>T | p.Arg5Cys | p.R5C | protein_coding | unknown(0) | TCGA-OL-A5DA-01 | Breast | breast invasive carcinoma | Female | <65 | I/II | Unknown | Unknown | SD | ||
| BCL7B | SNV | Missense_Mutation | rs782334386 | c.218N>T | p.Ser73Leu | p.S73L | protein_coding | tolerated(0.11) | benign(0.388) | TCGA-AG-3892-01 | Colorectum | rectum adenocarcinoma | Female | <65 | I/II | Unknown | Unknown | SD | |
| BCL7B | SNV | Missense_Mutation | rs782453916 | c.201N>C | p.Glu67Asp | p.E67D | protein_coding | tolerated(0.28) | benign(0.268) | TCGA-AJ-A3EL-01 | Endometrium | uterine corpus endometrioid carcinoma | Female | <65 | I/II | Unknown | Unknown | SD | |
| BCL7B | SNV | Missense_Mutation | novel | c.135N>T | p.Lys45Asn | p.K45N | protein_coding | deleterious(0) | probably_damaging(0.986) | TCGA-AX-A2HD-01 | Endometrium | uterine corpus endometrioid carcinoma | Female | >=65 | III/IV | Unknown | Unknown | SD | |
| BCL7B | SNV | Missense_Mutation | rs782766469 | c.446C>T | p.Thr149Met | p.T149M | protein_coding | tolerated(0.31) | possibly_damaging(0.823) | TCGA-B5-A3FC-01 | Endometrium | uterine corpus endometrioid carcinoma | Female | <65 | I/II | Unknown | Unknown | SD | |
| BCL7B | SNV | Missense_Mutation | rs782334386 | c.218C>T | p.Ser73Leu | p.S73L | protein_coding | tolerated(0.11) | benign(0.388) | TCGA-BG-A0VX-01 | Endometrium | uterine corpus endometrioid carcinoma | Female | <65 | I/II | Unknown | Unknown | SD | |
| BCL7B | SNV | Missense_Mutation | c.302N>G | p.Glu101Gly | p.E101G | protein_coding | deleterious(0) | probably_damaging(0.952) | TCGA-BS-A0UV-01 | Endometrium | uterine corpus endometrioid carcinoma | Female | <65 | III/IV | Unknown | Unknown | SD | ||
| BCL7B | SNV | Missense_Mutation | novel | c.593G>A | p.Arg198His | p.R198H | protein_coding | deleterious(0) | probably_damaging(0.992) | TCGA-FI-A2D0-01 | Endometrium | uterine corpus endometrioid carcinoma | Female | <65 | I/II | Unknown | Unknown | SD | |
| BCL7B | SNV | Missense_Mutation | novel | c.616N>T | p.Val206Leu | p.V206L | protein_coding | deleterious_low_confidence(0.01) | benign(0.248) | TCGA-G3-AAUZ-01 | Liver | liver hepatocellular carcinoma | Male | <65 | I/II | Unknown | Unknown | SD |
| Page: 1 |
Top |
Related drugs of malignant transformation related genes |
| Identification of chemicals and drugs interact with genes involved in malignant transfromation |
| (DGIdb 4.0) |
| Entrez ID | Symbol | Category | Interaction Types | Drug Claim Name | Drug Name | PMIDs |
| Page: 1 |

Copyright 2023-Present -The University of Texas Health Science Center at Houston |