
|
|||||
|
 | |
| |
| |
| |
| |
| |
|
Gene: BCL6 |
Gene summary for BCL6 |
| Gene information | Species | Human | Gene symbol | BCL6 | Gene ID | 604 |
| Gene name | BCL6 transcription repressor | |
| Gene Alias | BCL5 | |
| Cytomap | 3q27.3 | |
| Gene Type | protein-coding | GO ID | GO:0000003 | UniProtAcc | P41182 |
Top |
Malignant transformation analysis |
| Identification of the aberrant gene expression in precancerous and cancerous lesions by comparing the gene expression of stem-like cells in diseased tissues with normal stem cells |
| Entrez ID | Symbol | Replicates | Species | Organ | Tissue | Adj P-value | Log2FC | Malignancy |
| 604 | BCL6 | LZE4T | Human | Esophagus | ESCC | 2.81e-12 | 5.25e-01 | 0.0811 |
| 604 | BCL6 | LZE8T | Human | Esophagus | ESCC | 1.95e-05 | 4.04e-02 | 0.067 |
| 604 | BCL6 | LZE20T | Human | Esophagus | ESCC | 2.01e-10 | 1.93e-01 | 0.0662 |
| 604 | BCL6 | LZE24T | Human | Esophagus | ESCC | 2.27e-14 | 5.40e-01 | 0.0596 |
| 604 | BCL6 | P1T-E | Human | Esophagus | ESCC | 2.28e-05 | 5.48e-01 | 0.0875 |
| 604 | BCL6 | P2T-E | Human | Esophagus | ESCC | 1.04e-25 | 3.72e-01 | 0.1177 |
| 604 | BCL6 | P4T-E | Human | Esophagus | ESCC | 5.98e-09 | 2.72e-01 | 0.1323 |
| 604 | BCL6 | P5T-E | Human | Esophagus | ESCC | 2.21e-02 | 5.12e-02 | 0.1327 |
| 604 | BCL6 | P8T-E | Human | Esophagus | ESCC | 5.72e-30 | 6.83e-01 | 0.0889 |
| 604 | BCL6 | P9T-E | Human | Esophagus | ESCC | 1.03e-12 | 3.77e-01 | 0.1131 |
| 604 | BCL6 | P10T-E | Human | Esophagus | ESCC | 1.51e-17 | 2.26e-01 | 0.116 |
| 604 | BCL6 | P11T-E | Human | Esophagus | ESCC | 4.84e-05 | 2.66e-01 | 0.1426 |
| 604 | BCL6 | P12T-E | Human | Esophagus | ESCC | 1.83e-23 | 4.41e-01 | 0.1122 |
| 604 | BCL6 | P15T-E | Human | Esophagus | ESCC | 1.65e-27 | 9.17e-01 | 0.1149 |
| 604 | BCL6 | P16T-E | Human | Esophagus | ESCC | 1.50e-12 | 2.64e-01 | 0.1153 |
| 604 | BCL6 | P20T-E | Human | Esophagus | ESCC | 1.39e-10 | 2.89e-01 | 0.1124 |
| 604 | BCL6 | P21T-E | Human | Esophagus | ESCC | 6.85e-06 | 6.74e-02 | 0.1617 |
| 604 | BCL6 | P22T-E | Human | Esophagus | ESCC | 2.29e-16 | 2.16e-01 | 0.1236 |
| 604 | BCL6 | P23T-E | Human | Esophagus | ESCC | 1.76e-10 | 3.19e-01 | 0.108 |
| 604 | BCL6 | P24T-E | Human | Esophagus | ESCC | 1.88e-05 | 1.30e-01 | 0.1287 |
| Page: 1 2 3 4 |
| Tissue | Expression Dynamics | Abbreviation |
| Esophagus | 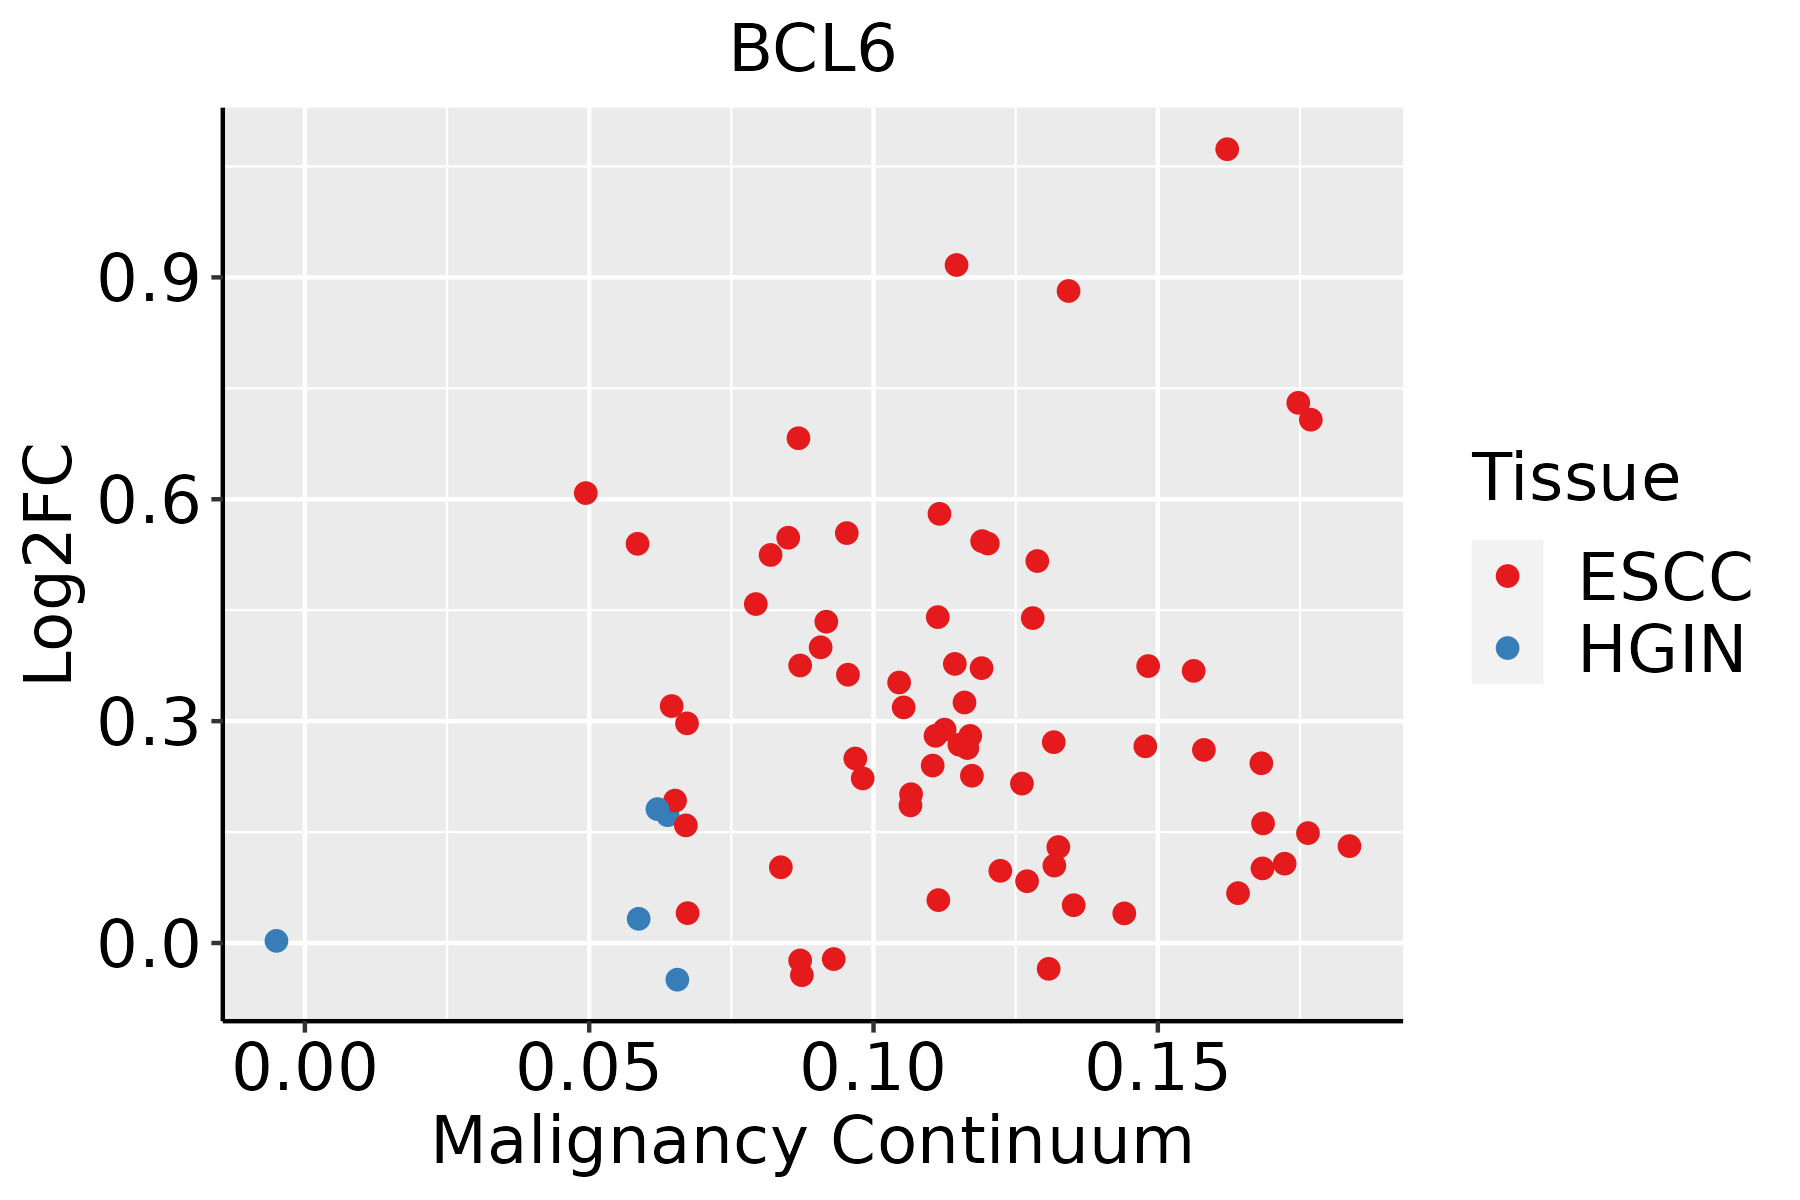 | ESCC: Esophageal squamous cell carcinoma |
| HGIN: High-grade intraepithelial neoplasias | ||
| LGIN: Low-grade intraepithelial neoplasias | ||
| Liver | 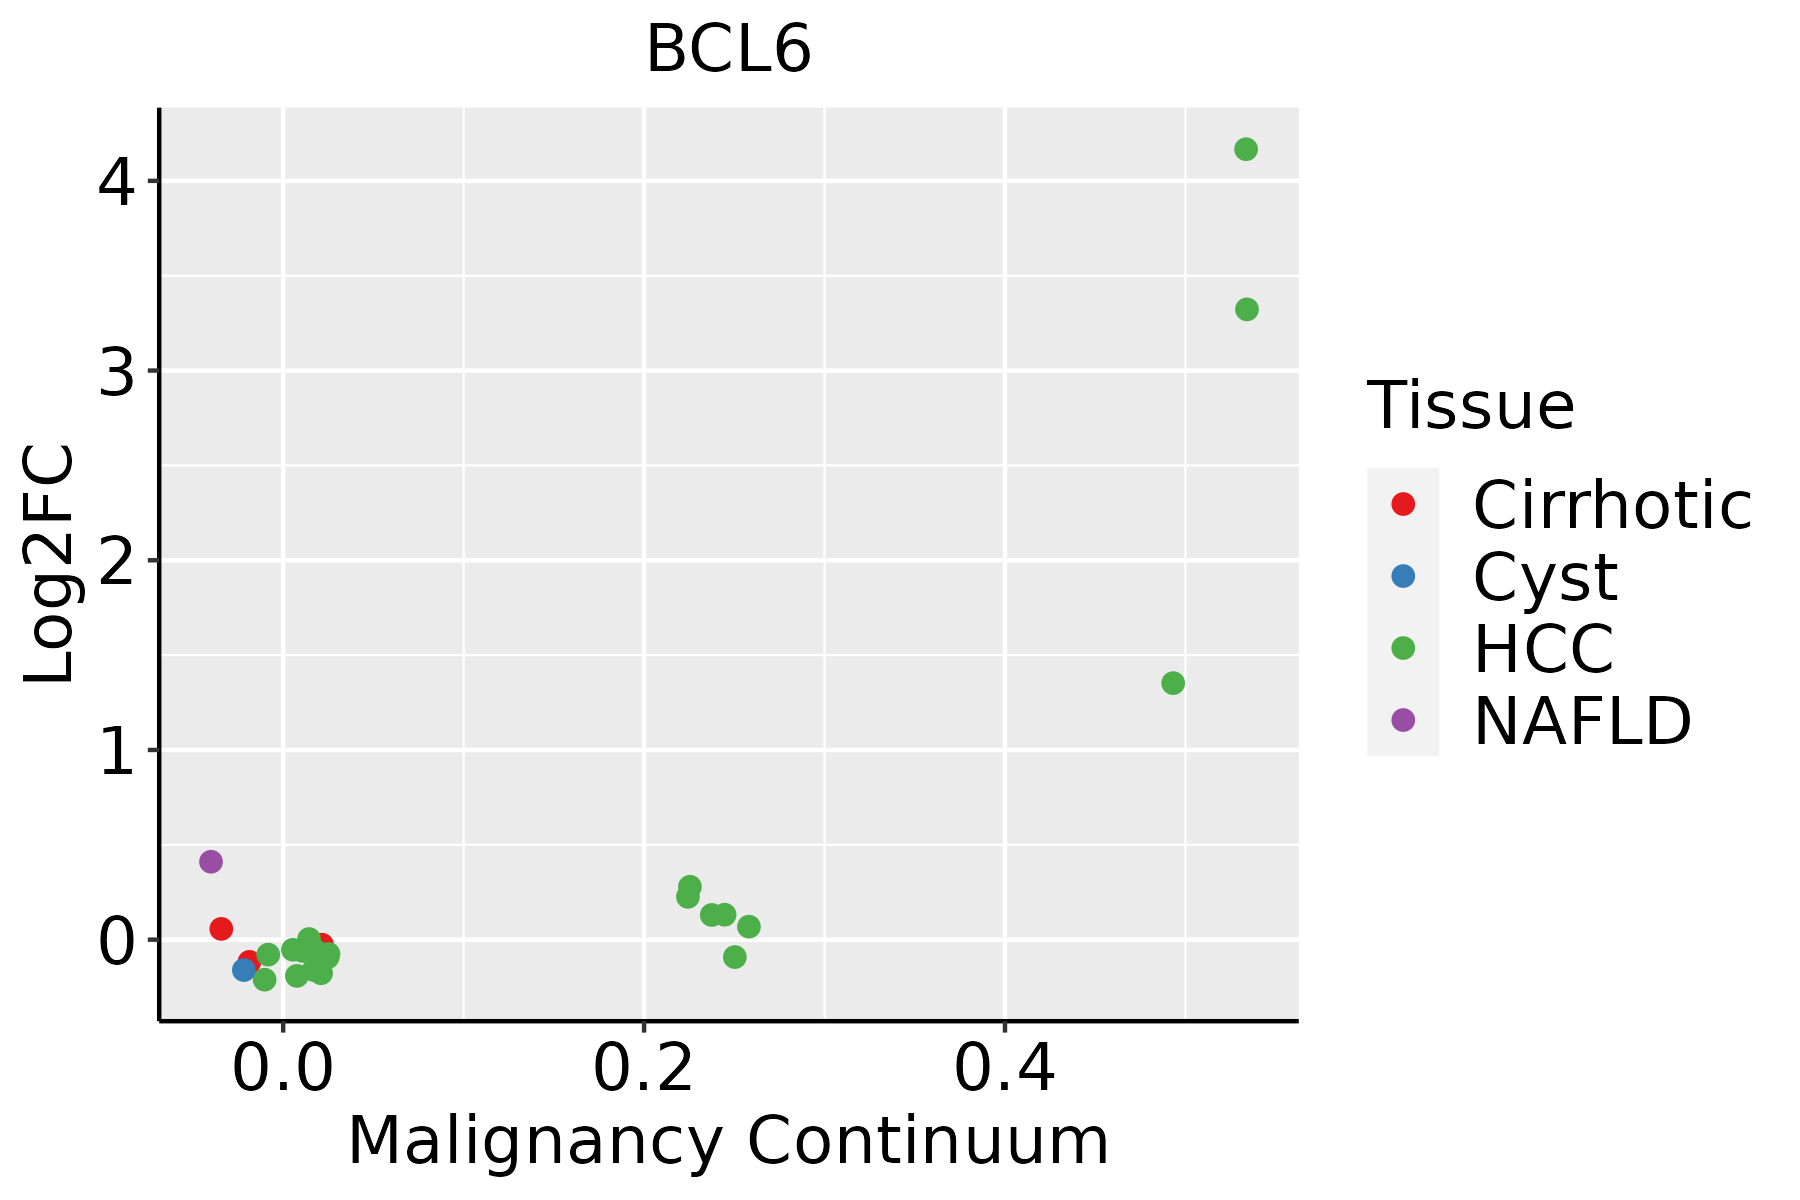 | HCC: Hepatocellular carcinoma |
| NAFLD: Non-alcoholic fatty liver disease | ||
| Lung | 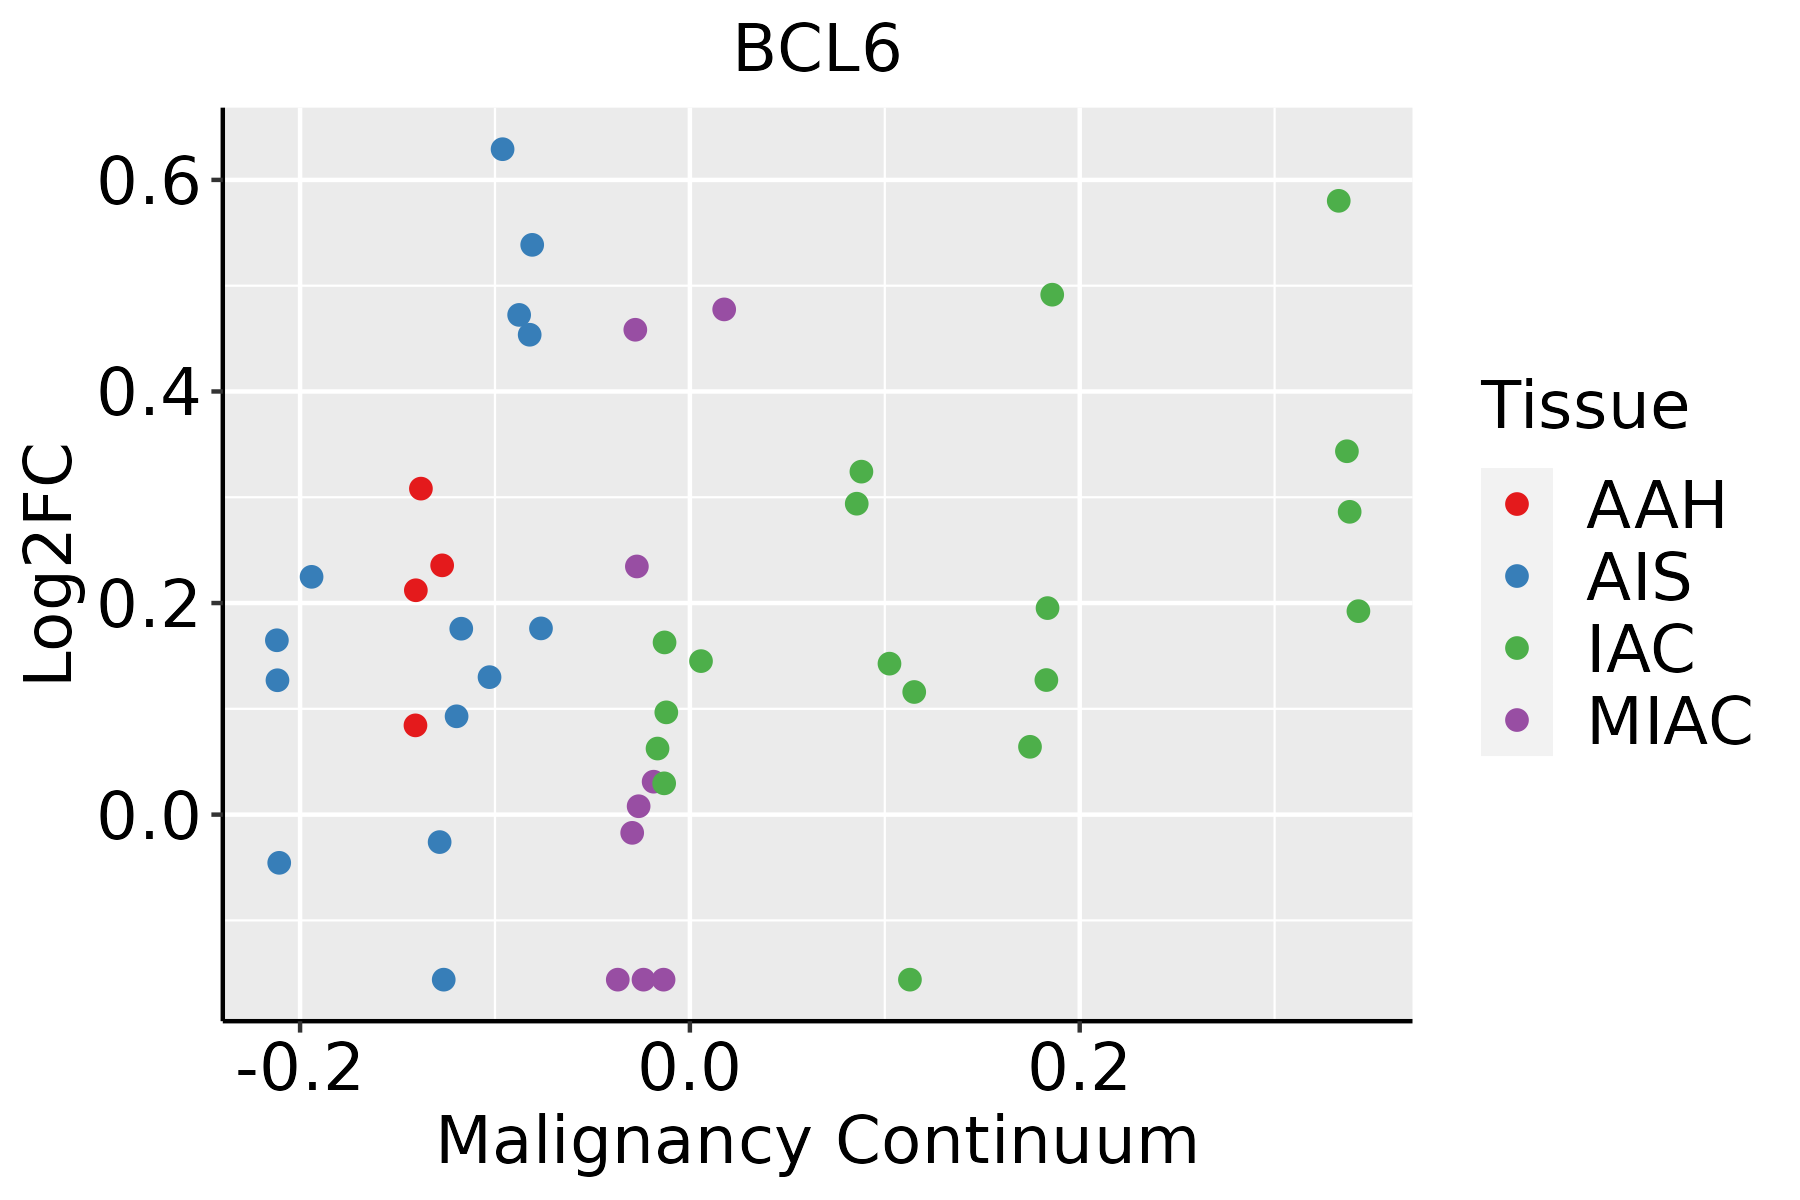 | AAH: Atypical adenomatous hyperplasia |
| AIS: Adenocarcinoma in situ | ||
| IAC: Invasive lung adenocarcinoma | ||
| MIA: Minimally invasive adenocarcinoma |
| ∗log2FC in expression of this searched gene in stem-like cells from each diseased tissue sample relative to stem-like cells in normal samples in each tissue plotted against the malignancy continuum. Samples are colored based on if they are from different disease stage. |
Top |
Malignant transformation related pathway analysis |
| Find out the enriched GO biological processes and KEGG pathways involved in transition from healthy to precancer to cancer |
| Tissue | Disease Stage | Enriched GO biological Processes |
| Colorectum | AD |  |
| Colorectum | SER |  |
| Colorectum | MSS |  |
| Colorectum | MSI-H |  |
| Colorectum | FAP |  |
| ∗Top 15 enriched GO BP terms are showed in the bar plot of each disease state in each tissue. Each row represents a significant GO biological process which is colored according to the -log10(p.adjust). |
| Page: 1 2 3 4 5 6 7 8 9 |
| GO ID | Tissue | Disease Stage | Description | Gene Ratio | Bg Ratio | pvalue | p.adjust | Count |
| GO:001657015 | Esophagus | ESCC | histone modification | 323/8552 | 463/18723 | 2.61e-26 | 7.88e-24 | 323 |
| GO:000734615 | Esophagus | ESCC | regulation of mitotic cell cycle | 293/8552 | 457/18723 | 8.00e-16 | 5.64e-14 | 293 |
| GO:00062604 | Esophagus | ESCC | DNA replication | 181/8552 | 260/18723 | 3.55e-15 | 2.05e-13 | 181 |
| GO:005105215 | Esophagus | ESCC | regulation of DNA metabolic process | 232/8552 | 359/18723 | 2.40e-13 | 1.13e-11 | 232 |
| GO:0016049110 | Esophagus | ESCC | cell growth | 289/8552 | 482/18723 | 1.29e-10 | 3.77e-09 | 289 |
| GO:00457865 | Esophagus | ESCC | negative regulation of cell cycle | 236/8552 | 385/18723 | 3.62e-10 | 9.93e-09 | 236 |
| GO:0030099111 | Esophagus | ESCC | myeloid cell differentiation | 232/8552 | 381/18723 | 1.22e-09 | 2.90e-08 | 232 |
| GO:003105614 | Esophagus | ESCC | regulation of histone modification | 106/8552 | 152/18723 | 1.52e-09 | 3.55e-08 | 106 |
| GO:000155819 | Esophagus | ESCC | regulation of cell growth | 248/8552 | 414/18723 | 2.97e-09 | 6.45e-08 | 248 |
| GO:003158919 | Esophagus | ESCC | cell-substrate adhesion | 221/8552 | 363/18723 | 3.06e-09 | 6.62e-08 | 221 |
| GO:001081020 | Esophagus | ESCC | regulation of cell-substrate adhesion | 144/8552 | 221/18723 | 3.55e-09 | 7.45e-08 | 144 |
| GO:004578527 | Esophagus | ESCC | positive regulation of cell adhesion | 255/8552 | 437/18723 | 5.07e-08 | 9.11e-07 | 255 |
| GO:00356015 | Esophagus | ESCC | protein deacylation | 79/8552 | 112/18723 | 8.30e-08 | 1.42e-06 | 79 |
| GO:000726510 | Esophagus | ESCC | Ras protein signal transduction | 201/8552 | 337/18723 | 1.44e-07 | 2.30e-06 | 201 |
| GO:0002262111 | Esophagus | ESCC | myeloid cell homeostasis | 104/8552 | 157/18723 | 1.49e-07 | 2.36e-06 | 104 |
| GO:0034101111 | Esophagus | ESCC | erythrocyte homeostasis | 88/8552 | 129/18723 | 1.81e-07 | 2.84e-06 | 88 |
| GO:00062612 | Esophagus | ESCC | DNA-dependent DNA replication | 100/8552 | 151/18723 | 2.61e-07 | 3.94e-06 | 100 |
| GO:000756820 | Esophagus | ESCC | aging | 201/8552 | 339/18723 | 2.64e-07 | 3.94e-06 | 201 |
| GO:00987325 | Esophagus | ESCC | macromolecule deacylation | 80/8552 | 116/18723 | 3.19e-07 | 4.50e-06 | 80 |
| GO:00109484 | Esophagus | ESCC | negative regulation of cell cycle process | 177/8552 | 294/18723 | 3.26e-07 | 4.59e-06 | 177 |
| Page: 1 2 3 4 5 6 7 8 9 10 11 12 |
| Pathway ID | Tissue | Disease Stage | Description | Gene Ratio | Bg Ratio | pvalue | p.adjust | qvalue | Count |
| hsa040689 | Esophagus | ESCC | FoxO signaling pathway | 89/4205 | 131/8465 | 1.56e-05 | 7.98e-05 | 4.09e-05 | 89 |
| hsa052028 | Esophagus | ESCC | Transcriptional misregulation in cancer | 116/4205 | 193/8465 | 2.08e-03 | 5.95e-03 | 3.05e-03 | 116 |
| hsa0406814 | Esophagus | ESCC | FoxO signaling pathway | 89/4205 | 131/8465 | 1.56e-05 | 7.98e-05 | 4.09e-05 | 89 |
| hsa0520213 | Esophagus | ESCC | Transcriptional misregulation in cancer | 116/4205 | 193/8465 | 2.08e-03 | 5.95e-03 | 3.05e-03 | 116 |
| hsa04068 | Liver | NAFLD | FoxO signaling pathway | 30/1043 | 131/8465 | 4.91e-04 | 8.05e-03 | 6.49e-03 | 30 |
| hsa040681 | Liver | NAFLD | FoxO signaling pathway | 30/1043 | 131/8465 | 4.91e-04 | 8.05e-03 | 6.49e-03 | 30 |
| hsa040684 | Liver | HCC | FoxO signaling pathway | 85/4020 | 131/8465 | 3.99e-05 | 2.16e-04 | 1.20e-04 | 85 |
| hsa040685 | Liver | HCC | FoxO signaling pathway | 85/4020 | 131/8465 | 3.99e-05 | 2.16e-04 | 1.20e-04 | 85 |
| hsa052026 | Lung | IAC | Transcriptional misregulation in cancer | 40/1053 | 193/8465 | 6.90e-04 | 5.90e-03 | 3.92e-03 | 40 |
| hsa040686 | Lung | IAC | FoxO signaling pathway | 29/1053 | 131/8465 | 1.25e-03 | 8.24e-03 | 5.47e-03 | 29 |
| hsa0520211 | Lung | IAC | Transcriptional misregulation in cancer | 40/1053 | 193/8465 | 6.90e-04 | 5.90e-03 | 3.92e-03 | 40 |
| hsa0406811 | Lung | IAC | FoxO signaling pathway | 29/1053 | 131/8465 | 1.25e-03 | 8.24e-03 | 5.47e-03 | 29 |
| hsa052022 | Lung | AIS | Transcriptional misregulation in cancer | 39/961 | 193/8465 | 2.15e-04 | 2.41e-03 | 1.54e-03 | 39 |
| hsa0406821 | Lung | AIS | FoxO signaling pathway | 25/961 | 131/8465 | 6.07e-03 | 2.94e-02 | 1.88e-02 | 25 |
| hsa052023 | Lung | AIS | Transcriptional misregulation in cancer | 39/961 | 193/8465 | 2.15e-04 | 2.41e-03 | 1.54e-03 | 39 |
| hsa0406831 | Lung | AIS | FoxO signaling pathway | 25/961 | 131/8465 | 6.07e-03 | 2.94e-02 | 1.88e-02 | 25 |
| Page: 1 |
Top |
Cell-cell communication analysis |
| Identification of potential cell-cell interactions between two cell types and their ligand-receptor pairs for different disease states |
| Ligand | Receptor | LRpair | Pathway | Tissue | Disease Stage |
| Page: 1 |
Top |
Single-cell gene regulatory network inference analysis |
| Find out the significant the regulons (TFs) and the target genes of each regulon across cell types for different disease states |
| TF | Cell Type | Tissue | Disease Stage | Target Gene | RSS | Regulon Activity |
| BCL6 | CD8TEXINT | Breast | ADJ | LPP,SSH1,C11orf54, etc. | 8.23e-02 |  |
| BCL6 | GC | Breast | DCIS | LPP,SSH1,C11orf54, etc. | 2.50e-01 |  |
| BCL6 | GC | Breast | IDC | LPP,SSH1,C11orf54, etc. | 1.81e-01 |  |
| BCL6 | CT | Colorectum | CRC | AC023590.1,TSC22D3,DNAJA1, etc. | 2.75e-03 |  |
| BCL6 | CT | Colorectum | FAP | AC023590.1,TSC22D3,DNAJA1, etc. | 5.77e-03 |  |
| BCL6 | EE | Colorectum | FAP | AC023590.1,TSC22D3,DNAJA1, etc. | 5.13e-03 | |
| BCL6 | SSC | Colorectum | FAP | AC023590.1,TSC22D3,DNAJA1, etc. | 2.33e-04 | |
| BCL6 | GC | Colorectum | ADJ | MYBL1,PAX5,MYO1E, etc. | 2.69e-01 |  |
| BCL6 | GC | Colorectum | CRC | MYBL1,PAX5,MYO1E, etc. | 8.77e-02 | |
| BCL6 | GC | Colorectum | FAP | MYBL1,PAX5,MYO1E, etc. | 2.20e-01 | |
| ∗The dot plots of a searched regulon are shown for all cell subpopulations in each disease state of each tissue based on the regulon specific score inferred using pySCENIC and by calculating the average expression. |
| Page: 1 2 3 4 |
Top |
Somatic mutation of malignant transformation related genes |
| Annotation of somatic variants for genes involved in malignant transformation |
| Hugo Symbol | Variant Class | Variant Classification | dbSNP RS | HGVSc | HGVSp | HGVSp Short | SWISSPROT | BIOTYPE | SIFT | PolyPhen | Tumor Sample Barcode | Tissue | Histology | Sex | Age | Stage | Therapy Types | Drugs | Outcome |
| BCL6 | SNV | Missense_Mutation | rs772289458 | c.34A>C | p.Thr12Pro | p.T12P | P41182 | protein_coding | deleterious(0) | probably_damaging(0.969) | TCGA-A2-A0CO-01 | Breast | breast invasive carcinoma | Female | >=65 | I/II | Hormone Therapy | tamoxiphen | CR |
| BCL6 | SNV | Missense_Mutation | rs772289458 | c.34A>C | p.Thr12Pro | p.T12P | P41182 | protein_coding | deleterious(0) | probably_damaging(0.969) | TCGA-A7-A4SC-01 | Breast | breast invasive carcinoma | Female | <65 | I/II | Hormone Therapy | tamoxiphen | SD |
| BCL6 | SNV | Missense_Mutation | rs772289458 | c.34N>C | p.Thr12Pro | p.T12P | P41182 | protein_coding | deleterious(0) | probably_damaging(0.969) | TCGA-A7-A6VX-01 | Breast | breast invasive carcinoma | Female | >=65 | I/II | Chemotherapy | docetaxel | CR |
| BCL6 | SNV | Missense_Mutation | c.710N>T | p.Pro237Leu | p.P237L | P41182 | protein_coding | tolerated(0.58) | benign(0.115) | TCGA-D8-A1JP-01 | Breast | breast invasive carcinoma | Female | >=65 | I/II | Hormone Therapy | tamoxiphen | SD | |
| BCL6 | SNV | Missense_Mutation | c.63C>G | p.Asn21Lys | p.N21K | P41182 | protein_coding | deleterious(0) | probably_damaging(0.999) | TCGA-E2-A15G-01 | Breast | breast invasive carcinoma | Female | >=65 | I/II | Hormone Therapy | arimidex | SD | |
| BCL6 | SNV | Missense_Mutation | rs772289458 | c.34N>C | p.Thr12Pro | p.T12P | P41182 | protein_coding | deleterious(0) | probably_damaging(0.969) | TCGA-EW-A423-01 | Breast | breast invasive carcinoma | Female | >=65 | I/II | Hormone Therapy | anastrozole | SD |
| BCL6 | SNV | Missense_Mutation | rs759501076 | c.716N>T | p.Pro239Leu | p.P239L | P41182 | protein_coding | tolerated(0.29) | benign(0) | TCGA-GM-A2DH-01 | Breast | breast invasive carcinoma | Female | <65 | I/II | Chemotherapy | taxol | CR |
| BCL6 | SNV | Missense_Mutation | rs535108808 | c.1427N>T | p.Thr476Met | p.T476M | P41182 | protein_coding | tolerated(0.06) | benign(0.197) | TCGA-LL-A5YM-01 | Breast | breast invasive carcinoma | Female | >=65 | III/IV | Unspecific | letrozole | PD |
| BCL6 | SNV | Missense_Mutation | novel | c.978N>T | p.Lys326Asn | p.K326N | P41182 | protein_coding | deleterious(0.02) | probably_damaging(0.991) | TCGA-UL-AAZ6-01 | Breast | breast invasive carcinoma | Female | >=65 | I/II | Chemotherapy | herceptin | SD |
| BCL6 | SNV | Missense_Mutation | rs750212558 | c.2075G>A | p.Arg692His | p.R692H | P41182 | protein_coding | deleterious(0) | probably_damaging(0.987) | TCGA-2W-A8YY-01 | Cervix | cervical & endocervical cancer | Female | <65 | I/II | Chemotherapy | cisplatin | CR |
| Page: 1 2 3 4 5 6 7 8 9 10 11 |
Top |
Related drugs of malignant transformation related genes |
| Identification of chemicals and drugs interact with genes involved in malignant transfromation |
| (DGIdb 4.0) |
| Entrez ID | Symbol | Category | Interaction Types | Drug Claim Name | Drug Name | PMIDs |
| 604 | BCL6 | TRANSCRIPTION FACTOR, CLINICALLY ACTIONABLE | FENRETINIDE | FENRETINIDE | 11027625 | |
| 604 | BCL6 | TRANSCRIPTION FACTOR, CLINICALLY ACTIONABLE | inhibitor | 348353630 | ||
| 604 | BCL6 | TRANSCRIPTION FACTOR, CLINICALLY ACTIONABLE | inhibitor | 348353631 |
| Page: 1 |

Copyright 2023-Present -The University of Texas Health Science Center at Houston |