
|
|||||
|
 | |
| |
| |
| |
| |
| |
|
Gene: BCL3 |
Gene summary for BCL3 |
| Gene information | Species | Human | Gene symbol | BCL3 | Gene ID | 602 |
| Gene name | BCL3 transcription coactivator | |
| Gene Alias | BCL4 | |
| Cytomap | 19q13.32 | |
| Gene Type | protein-coding | GO ID | GO:0001562 | UniProtAcc | P20749 |
Top |
Malignant transformation analysis |
| Identification of the aberrant gene expression in precancerous and cancerous lesions by comparing the gene expression of stem-like cells in diseased tissues with normal stem cells |
| Entrez ID | Symbol | Replicates | Species | Organ | Tissue | Adj P-value | Log2FC | Malignancy |
| 602 | BCL3 | LZE4T | Human | Esophagus | ESCC | 1.88e-04 | -1.19e-01 | 0.0811 |
| 602 | BCL3 | LZE20T | Human | Esophagus | ESCC | 1.18e-03 | 3.83e-04 | 0.0662 |
| 602 | BCL3 | LZE24T | Human | Esophagus | ESCC | 9.25e-09 | 7.38e-01 | 0.0596 |
| 602 | BCL3 | LZE21T | Human | Esophagus | ESCC | 1.39e-03 | 2.35e-01 | 0.0655 |
| 602 | BCL3 | P1T-E | Human | Esophagus | ESCC | 3.74e-15 | 1.63e+00 | 0.0875 |
| 602 | BCL3 | P2T-E | Human | Esophagus | ESCC | 2.62e-24 | 7.37e-01 | 0.1177 |
| 602 | BCL3 | P4T-E | Human | Esophagus | ESCC | 2.13e-18 | 9.32e-01 | 0.1323 |
| 602 | BCL3 | P5T-E | Human | Esophagus | ESCC | 2.10e-16 | 2.81e-01 | 0.1327 |
| 602 | BCL3 | P8T-E | Human | Esophagus | ESCC | 2.13e-39 | 1.79e+00 | 0.0889 |
| 602 | BCL3 | P9T-E | Human | Esophagus | ESCC | 5.17e-15 | 3.98e-01 | 0.1131 |
| 602 | BCL3 | P10T-E | Human | Esophagus | ESCC | 7.74e-08 | 1.02e-01 | 0.116 |
| 602 | BCL3 | P12T-E | Human | Esophagus | ESCC | 8.88e-17 | 1.06e-01 | 0.1122 |
| 602 | BCL3 | P15T-E | Human | Esophagus | ESCC | 5.18e-08 | 4.13e-01 | 0.1149 |
| 602 | BCL3 | P16T-E | Human | Esophagus | ESCC | 9.03e-15 | -1.74e-01 | 0.1153 |
| 602 | BCL3 | P20T-E | Human | Esophagus | ESCC | 7.08e-06 | 5.37e-01 | 0.1124 |
| 602 | BCL3 | P21T-E | Human | Esophagus | ESCC | 1.82e-13 | 3.74e-01 | 0.1617 |
| 602 | BCL3 | P22T-E | Human | Esophagus | ESCC | 6.74e-21 | -6.77e-03 | 0.1236 |
| 602 | BCL3 | P23T-E | Human | Esophagus | ESCC | 1.80e-48 | 2.08e+00 | 0.108 |
| 602 | BCL3 | P24T-E | Human | Esophagus | ESCC | 6.81e-06 | 1.94e-01 | 0.1287 |
| 602 | BCL3 | P26T-E | Human | Esophagus | ESCC | 1.16e-24 | 7.73e-01 | 0.1276 |
| Page: 1 2 3 4 5 |
| Tissue | Expression Dynamics | Abbreviation |
| Esophagus | 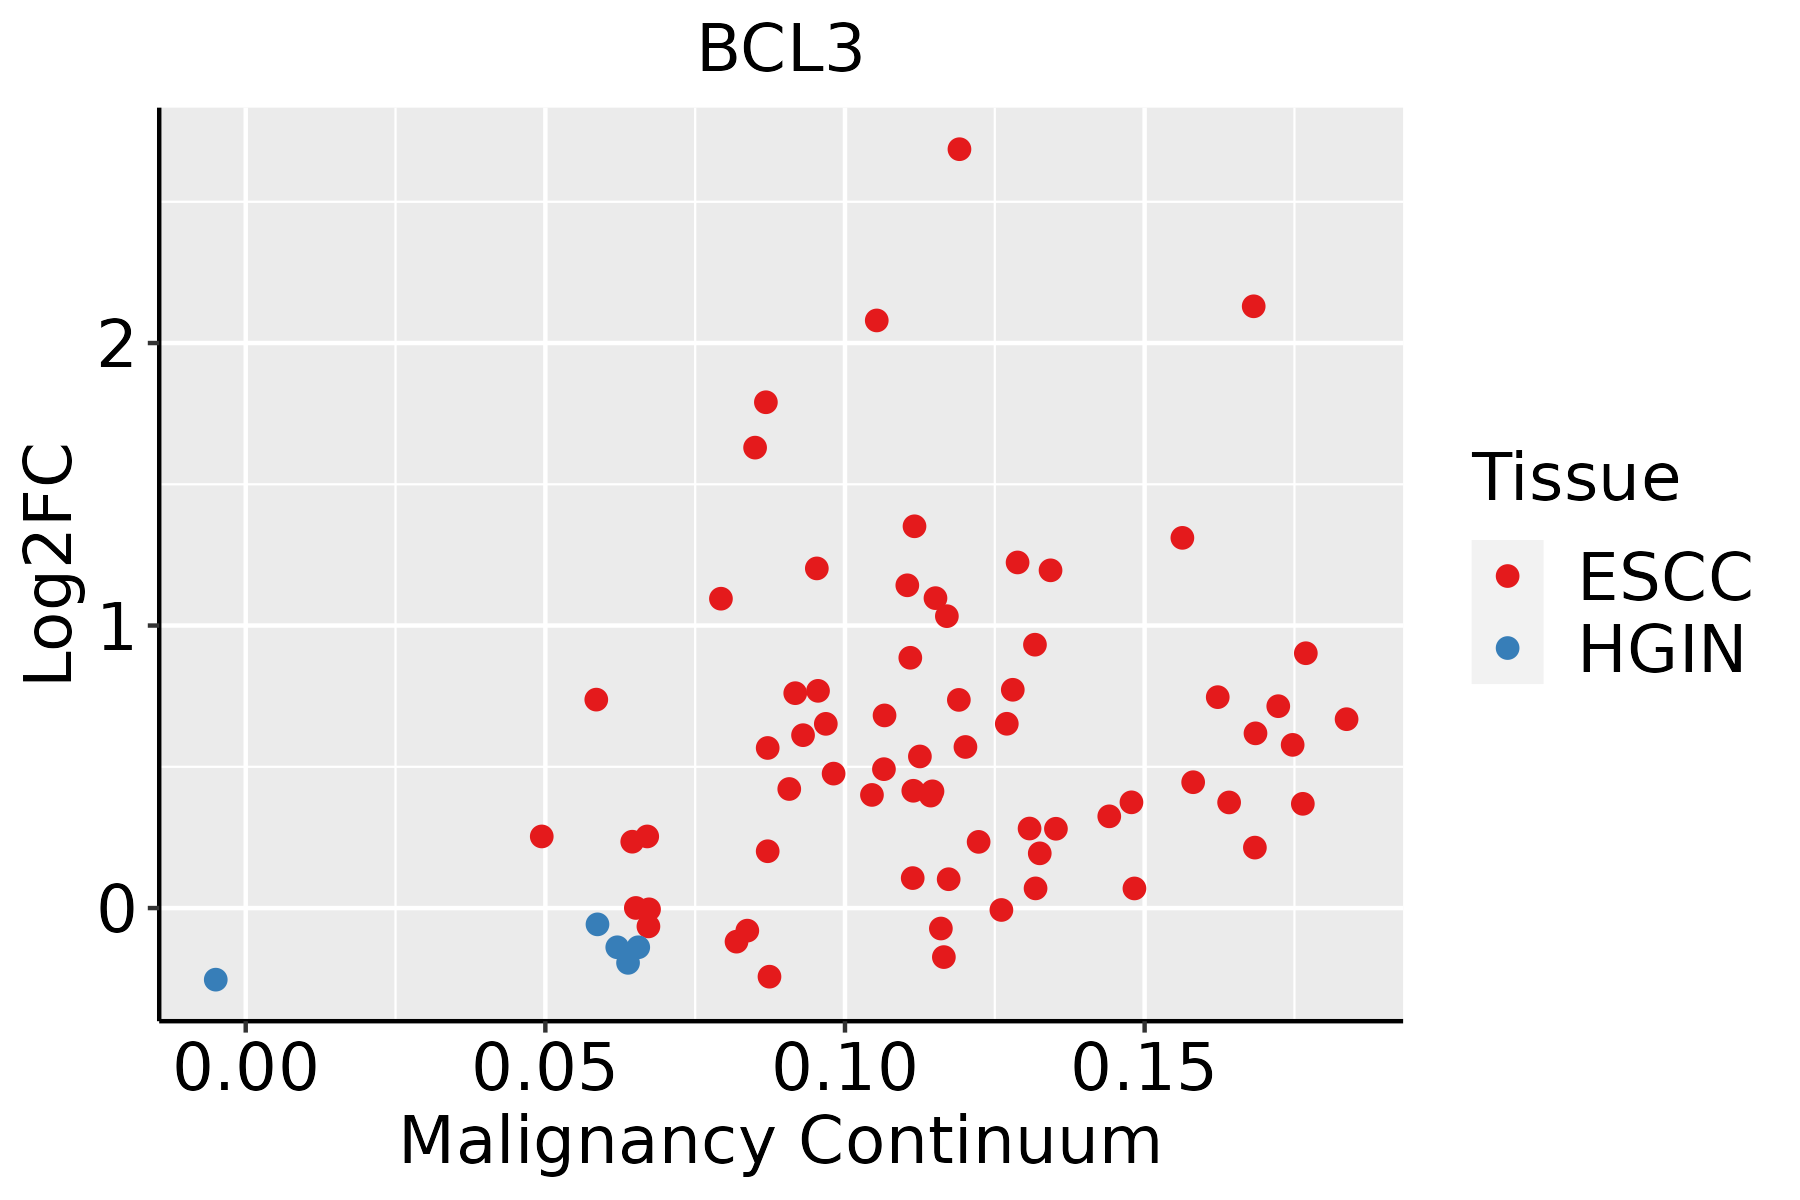 | ESCC: Esophageal squamous cell carcinoma |
| HGIN: High-grade intraepithelial neoplasias | ||
| LGIN: Low-grade intraepithelial neoplasias | ||
| Liver |  | HCC: Hepatocellular carcinoma |
| NAFLD: Non-alcoholic fatty liver disease | ||
| Oral Cavity |  | EOLP: Erosive Oral lichen planus |
| LP: leukoplakia | ||
| NEOLP: Non-erosive oral lichen planus | ||
| OSCC: Oral squamous cell carcinoma | ||
| Prostate | 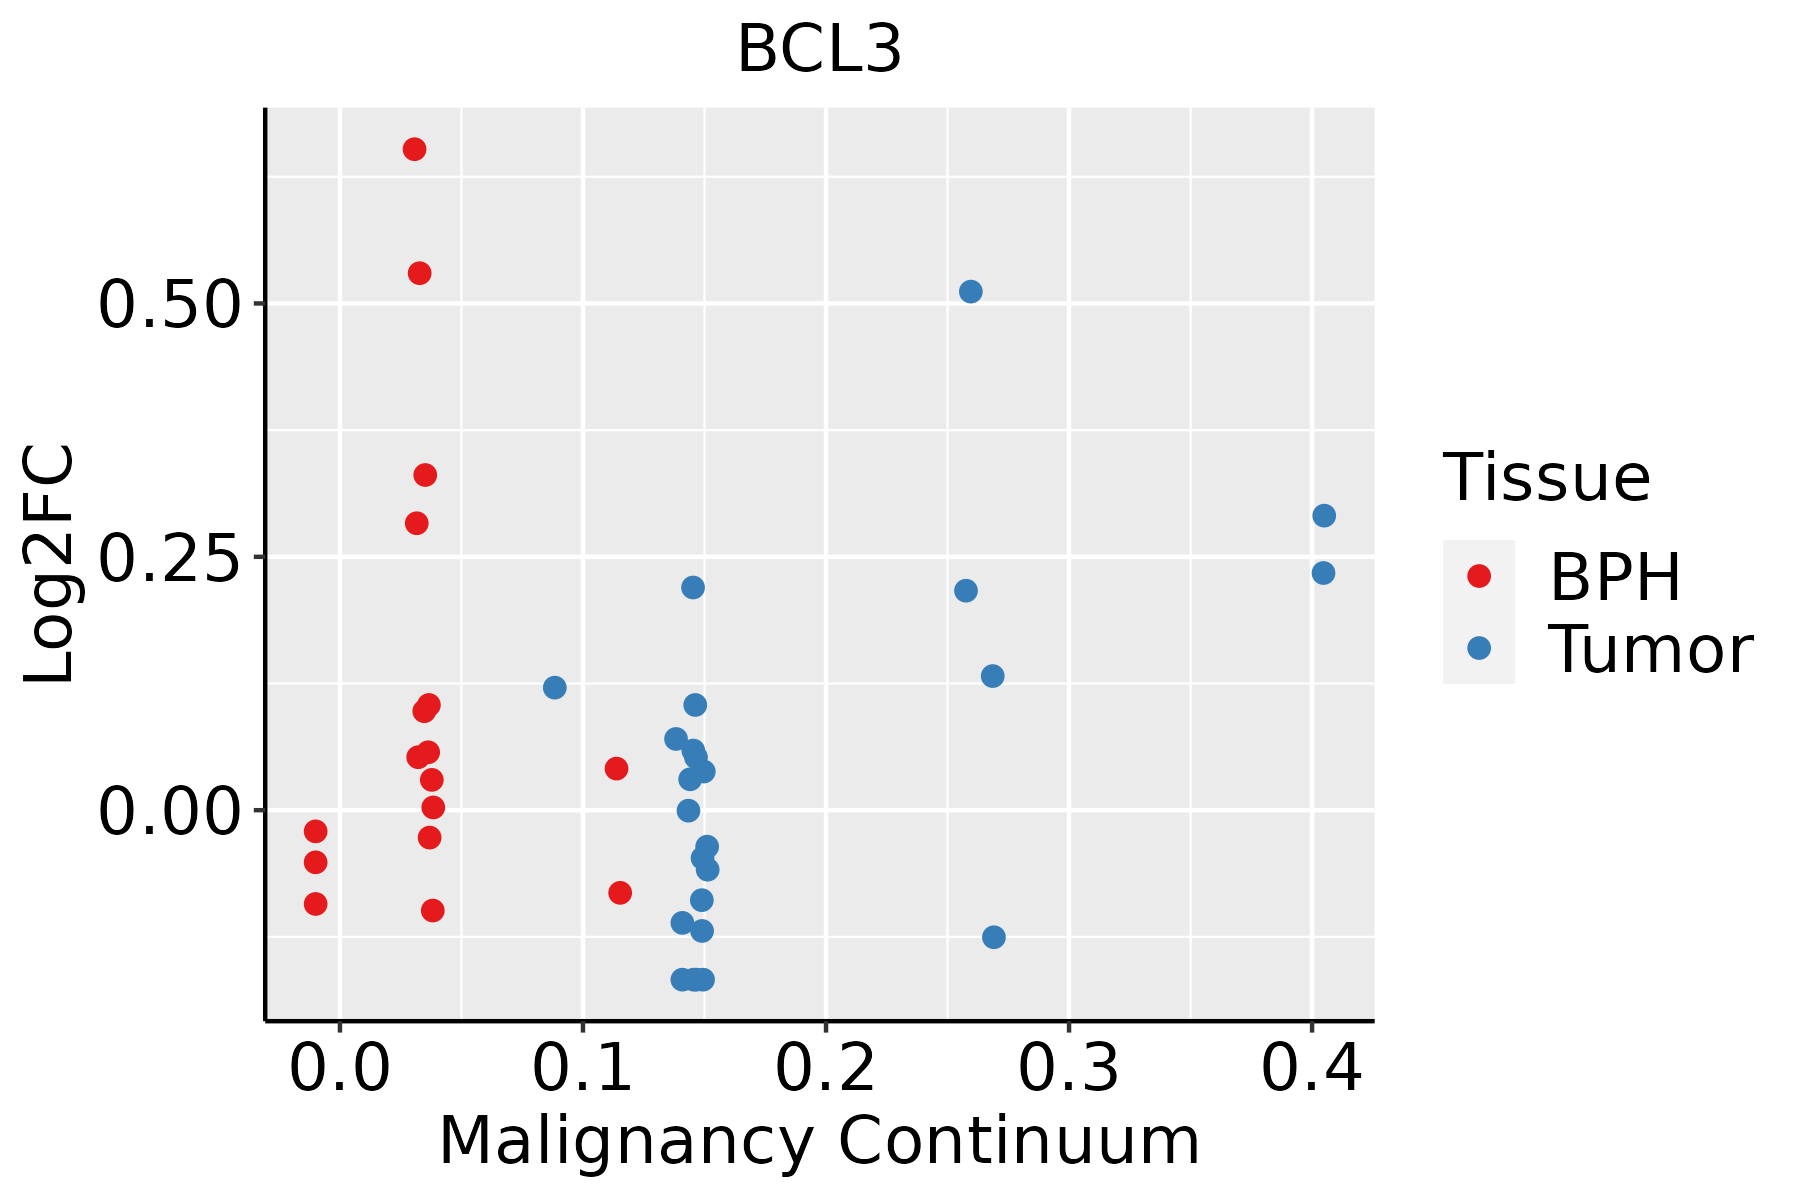 | BPH: Benign Prostatic Hyperplasia |
| Skin |  | AK: Actinic keratosis |
| cSCC: Cutaneous squamous cell carcinoma | ||
| SCCIS:squamous cell carcinoma in situ |
| ∗log2FC in expression of this searched gene in stem-like cells from each diseased tissue sample relative to stem-like cells in normal samples in each tissue plotted against the malignancy continuum. Samples are colored based on if they are from different disease stage. |
Top |
Malignant transformation related pathway analysis |
| Find out the enriched GO biological processes and KEGG pathways involved in transition from healthy to precancer to cancer |
| Tissue | Disease Stage | Enriched GO biological Processes |
| Colorectum | AD |  |
| Colorectum | SER |  |
| Colorectum | MSS |  |
| Colorectum | MSI-H |  |
| Colorectum | FAP |  |
| ∗Top 15 enriched GO BP terms are showed in the bar plot of each disease state in each tissue. Each row represents a significant GO biological process which is colored according to the -log10(p.adjust). |
| Page: 1 2 3 4 5 6 7 8 9 |
| GO ID | Tissue | Disease Stage | Description | Gene Ratio | Bg Ratio | pvalue | p.adjust | Count |
| GO:0072594110 | Esophagus | ESCC | establishment of protein localization to organelle | 311/8552 | 422/18723 | 3.02e-32 | 2.13e-29 | 311 |
| GO:0097193111 | Esophagus | ESCC | intrinsic apoptotic signaling pathway | 222/8552 | 288/18723 | 5.87e-28 | 2.02e-25 | 222 |
| GO:0006913110 | Esophagus | ESCC | nucleocytoplasmic transport | 230/8552 | 301/18723 | 6.04e-28 | 2.02e-25 | 230 |
| GO:0051169110 | Esophagus | ESCC | nuclear transport | 230/8552 | 301/18723 | 6.04e-28 | 2.02e-25 | 230 |
| GO:003450418 | Esophagus | ESCC | protein localization to nucleus | 211/8552 | 290/18723 | 4.06e-21 | 6.60e-19 | 211 |
| GO:0051098111 | Esophagus | ESCC | regulation of binding | 251/8552 | 363/18723 | 6.73e-20 | 8.46e-18 | 251 |
| GO:0006417111 | Esophagus | ESCC | regulation of translation | 304/8552 | 468/18723 | 1.53e-17 | 1.33e-15 | 304 |
| GO:0045727111 | Esophagus | ESCC | positive regulation of translation | 107/8552 | 136/18723 | 2.79e-15 | 1.68e-13 | 107 |
| GO:000941113 | Esophagus | ESCC | response to UV | 115/8552 | 149/18723 | 3.29e-15 | 1.93e-13 | 115 |
| GO:0034250111 | Esophagus | ESCC | positive regulation of cellular amide metabolic process | 123/8552 | 162/18723 | 3.32e-15 | 1.93e-13 | 123 |
| GO:001703818 | Esophagus | ESCC | protein import | 149/8552 | 206/18723 | 5.90e-15 | 3.31e-13 | 149 |
| GO:000961518 | Esophagus | ESCC | response to virus | 238/8552 | 367/18723 | 6.65e-14 | 3.32e-12 | 238 |
| GO:0072331111 | Esophagus | ESCC | signal transduction by p53 class mediator | 121/8552 | 163/18723 | 9.61e-14 | 4.69e-12 | 121 |
| GO:0008630110 | Esophagus | ESCC | intrinsic apoptotic signaling pathway in response to DNA damage | 78/8552 | 99/18723 | 1.43e-11 | 5.08e-10 | 78 |
| GO:000724919 | Esophagus | ESCC | I-kappaB kinase/NF-kappaB signaling | 183/8552 | 281/18723 | 3.02e-11 | 1.01e-09 | 183 |
| GO:000931419 | Esophagus | ESCC | response to radiation | 277/8552 | 456/18723 | 4.42e-11 | 1.43e-09 | 277 |
| GO:005117014 | Esophagus | ESCC | import into nucleus | 111/8552 | 159/18723 | 5.69e-10 | 1.44e-08 | 111 |
| GO:000660613 | Esophagus | ESCC | protein import into nucleus | 108/8552 | 155/18723 | 1.16e-09 | 2.77e-08 | 108 |
| GO:004277014 | Esophagus | ESCC | signal transduction in response to DNA damage | 117/8552 | 172/18723 | 2.38e-09 | 5.32e-08 | 117 |
| GO:0042771110 | Esophagus | ESCC | intrinsic apoptotic signaling pathway in response to DNA damage by p53 class mediator | 38/8552 | 43/18723 | 5.75e-09 | 1.18e-07 | 38 |
| Page: 1 2 3 4 5 6 7 8 9 10 11 12 |
| Pathway ID | Tissue | Disease Stage | Description | Gene Ratio | Bg Ratio | pvalue | p.adjust | qvalue | Count |
| hsa0466810 | Esophagus | ESCC | TNF signaling pathway | 89/4205 | 114/8465 | 3.36e-10 | 4.01e-09 | 2.06e-09 | 89 |
| hsa046259 | Esophagus | ESCC | C-type lectin receptor signaling pathway | 73/4205 | 104/8465 | 1.57e-05 | 7.98e-05 | 4.09e-05 | 73 |
| hsa0466817 | Esophagus | ESCC | TNF signaling pathway | 89/4205 | 114/8465 | 3.36e-10 | 4.01e-09 | 2.06e-09 | 89 |
| hsa0462513 | Esophagus | ESCC | C-type lectin receptor signaling pathway | 73/4205 | 104/8465 | 1.57e-05 | 7.98e-05 | 4.09e-05 | 73 |
| hsa046684 | Liver | HCC | TNF signaling pathway | 73/4020 | 114/8465 | 2.53e-04 | 1.19e-03 | 6.63e-04 | 73 |
| hsa0466811 | Liver | HCC | TNF signaling pathway | 73/4020 | 114/8465 | 2.53e-04 | 1.19e-03 | 6.63e-04 | 73 |
| hsa046689 | Oral cavity | OSCC | TNF signaling pathway | 82/3704 | 114/8465 | 8.30e-10 | 9.59e-09 | 4.88e-09 | 82 |
| hsa046258 | Oral cavity | OSCC | C-type lectin receptor signaling pathway | 73/3704 | 104/8465 | 3.83e-08 | 3.12e-07 | 1.59e-07 | 73 |
| hsa0466816 | Oral cavity | OSCC | TNF signaling pathway | 82/3704 | 114/8465 | 8.30e-10 | 9.59e-09 | 4.88e-09 | 82 |
| hsa0462512 | Oral cavity | OSCC | C-type lectin receptor signaling pathway | 73/3704 | 104/8465 | 3.83e-08 | 3.12e-07 | 1.59e-07 | 73 |
| hsa0466822 | Oral cavity | LP | TNF signaling pathway | 49/2418 | 114/8465 | 6.51e-04 | 3.29e-03 | 2.12e-03 | 49 |
| hsa0462521 | Oral cavity | LP | C-type lectin receptor signaling pathway | 43/2418 | 104/8465 | 3.33e-03 | 1.41e-02 | 9.06e-03 | 43 |
| hsa0466832 | Oral cavity | LP | TNF signaling pathway | 49/2418 | 114/8465 | 6.51e-04 | 3.29e-03 | 2.12e-03 | 49 |
| hsa0462531 | Oral cavity | LP | C-type lectin receptor signaling pathway | 43/2418 | 104/8465 | 3.33e-03 | 1.41e-02 | 9.06e-03 | 43 |
| hsa046688 | Prostate | BPH | TNF signaling pathway | 41/1718 | 114/8465 | 6.86e-05 | 4.35e-04 | 2.69e-04 | 41 |
| hsa0466815 | Prostate | BPH | TNF signaling pathway | 41/1718 | 114/8465 | 6.86e-05 | 4.35e-04 | 2.69e-04 | 41 |
| hsa0466821 | Prostate | Tumor | TNF signaling pathway | 40/1791 | 114/8465 | 3.88e-04 | 2.07e-03 | 1.29e-03 | 40 |
| hsa0466831 | Prostate | Tumor | TNF signaling pathway | 40/1791 | 114/8465 | 3.88e-04 | 2.07e-03 | 1.29e-03 | 40 |
| Page: 1 |
Top |
Cell-cell communication analysis |
| Identification of potential cell-cell interactions between two cell types and their ligand-receptor pairs for different disease states |
| Ligand | Receptor | LRpair | Pathway | Tissue | Disease Stage |
| Page: 1 |
Top |
Single-cell gene regulatory network inference analysis |
| Find out the significant the regulons (TFs) and the target genes of each regulon across cell types for different disease states |
| TF | Cell Type | Tissue | Disease Stage | Target Gene | RSS | Regulon Activity |
| BCL3 | KER | Cervix | Healthy | SLC39A8,MARK4,EREG, etc. | 2.69e-01 |  |
| BCL3 | ABS | Colorectum | MSS | CKB,SLC25A37,ZC3H12A, etc. | 1.02e-01 |  |
| BCL3 | AT2 | Lung | Healthy | SFTPB,SFTPC,STEAP4, etc. | 4.82e-01 |  |
| BCL3 | INMON | Lung | AAH | RYBP,HPSE,THBS1, etc. | 9.56e-02 |  |
| BCL3 | INMON | Lung | ADJ | ECE1,TSHZ3,S100A8, etc. | 1.77e-01 |  |
| ∗The dot plots of a searched regulon are shown for all cell subpopulations in each disease state of each tissue based on the regulon specific score inferred using pySCENIC and by calculating the average expression. |
| Page: 1 |
Top |
Somatic mutation of malignant transformation related genes |
| Annotation of somatic variants for genes involved in malignant transformation |
| Hugo Symbol | Variant Class | Variant Classification | dbSNP RS | HGVSc | HGVSp | HGVSp Short | SWISSPROT | BIOTYPE | SIFT | PolyPhen | Tumor Sample Barcode | Tissue | Histology | Sex | Age | Stage | Therapy Types | Drugs | Outcome |
| BCL3 | SNV | Missense_Mutation | c.463N>T | p.Val155Phe | p.V155F | P20749 | protein_coding | deleterious(0) | possibly_damaging(0.577) | TCGA-AO-A0JD-01 | Breast | breast invasive carcinoma | Female | <65 | III/IV | Chemotherapy | cyclophosphamide | SD | |
| BCL3 | SNV | Missense_Mutation | novel | c.1252C>G | p.Pro418Ala | p.P418A | P20749 | protein_coding | tolerated_low_confidence(0.1) | benign(0.173) | TCGA-EK-A3GK-01 | Cervix | cervical & endocervical cancer | Female | <65 | I/II | Unknown | Unknown | SD |
| BCL3 | SNV | Missense_Mutation | novel | c.1263N>G | p.Phe421Leu | p.F421L | P20749 | protein_coding | deleterious_low_confidence(0.04) | benign(0) | TCGA-IR-A3LA-01 | Cervix | cervical & endocervical cancer | Female | <65 | I/II | Chemotherapy | cisplatin | CR |
| BCL3 | SNV | Missense_Mutation | c.647N>A | p.Arg216His | p.R216H | P20749 | protein_coding | tolerated(0.14) | benign(0.267) | TCGA-AD-6964-01 | Colorectum | colon adenocarcinoma | Male | <65 | III/IV | Chemotherapy | folfox | PD | |
| BCL3 | SNV | Missense_Mutation | c.620N>T | p.Thr207Met | p.T207M | P20749 | protein_coding | deleterious(0) | probably_damaging(1) | TCGA-AZ-4313-01 | Colorectum | colon adenocarcinoma | Female | <65 | I/II | Unknown | Unknown | SD | |
| BCL3 | SNV | Missense_Mutation | c.1019N>A | p.Cys340Tyr | p.C340Y | P20749 | protein_coding | tolerated(0.76) | benign(0.178) | TCGA-G4-6304-01 | Colorectum | colon adenocarcinoma | Female | >=65 | I/II | Chemotherapy | fluorouracil | PD | |
| BCL3 | SNV | Missense_Mutation | c.635N>T | p.Ala212Val | p.A212V | P20749 | protein_coding | deleterious(0) | possibly_damaging(0.79) | TCGA-G4-6320-01 | Colorectum | colon adenocarcinoma | Male | >=65 | III/IV | Chemotherapy | oxaliplatin | SD | |
| BCL3 | SNV | Missense_Mutation | novel | c.319C>T | p.Pro107Ser | p.P107S | P20749 | protein_coding | deleterious(0.04) | benign(0.02) | TCGA-AP-A1DK-01 | Endometrium | uterine corpus endometrioid carcinoma | Female | <65 | I/II | Unknown | Unknown | SD |
| BCL3 | SNV | Missense_Mutation | novel | c.1301T>C | p.Phe434Ser | p.F434S | P20749 | protein_coding | deleterious_low_confidence(0) | benign(0.137) | TCGA-AX-A06F-01 | Endometrium | uterine corpus endometrioid carcinoma | Female | <65 | III/IV | Chemotherapy | carboplatin | SD |
| BCL3 | SNV | Missense_Mutation | c.646N>T | p.Arg216Cys | p.R216C | P20749 | protein_coding | tolerated(0.05) | possibly_damaging(0.523) | TCGA-AX-A2HG-01 | Endometrium | uterine corpus endometrioid carcinoma | Female | <65 | I/II | Unknown | Unknown | SD |
| Page: 1 2 3 |
Top |
Related drugs of malignant transformation related genes |
| Identification of chemicals and drugs interact with genes involved in malignant transfromation |
| (DGIdb 4.0) |
| Entrez ID | Symbol | Category | Interaction Types | Drug Claim Name | Drug Name | PMIDs |
| Page: 1 |

Copyright 2023-Present -The University of Texas Health Science Center at Houston |