Schematic overview of the cellular and molecular mechanisms involved in the cancer progression, including the proposed cellular and molecular mechanisms in cancer cells trajectory. AT1: alveolar type 1 cells; AT2: alveolar type 2 cells; AAH: atypical adenomatous hyperplasia; AIS: adenocarcinoma in situ; MIA: minimally invasive adenocarcinoma; IA: invasive adenocarcinoma; EMT: epithelial-mesenchymal transition

Home

Download

Statistics

Help

Contact

Center for Computational Systems Medicine
leaf

Gene summary

leaf

Malignant transformation analysis

leaf

Malignant transformation related pathway analysis

leaf

Cell-cell communication analysis

leaf

Single-cell gene regulatory network inference analysis

leaf

Somatic mutation of malignant transformation related genes

leaf

Related drugs of malignant transformation related genes

Gene: BCL2L12

Gene summary for BCL2L12

check button Gene summary.

Gene informationSpeciesHuman
Gene symbol

BCL2L12

Gene ID

83596

Gene nameBCL2 like 12
Gene AliasBCL2L12
Cytomap19q13.33
Gene Typeprotein-coding
GO ID

GO:0006139

UniProtAcc

Q9HB09


Top

Malignant transformation analysis

check button Identification of the aberrant gene expression in precancerous and cancerous lesions by comparing the gene expression of stem-like cells in diseased tissues with normal stem cells
check button Malignant transformation involving gene list.
Entrez IDSymbolReplicatesSpeciesOrganTissueAdj P-valueLog2FCMalignancy
83596BCL2L12LZE4THumanEsophagusESCC1.86e-092.73e-010.0811
83596BCL2L12LZE5THumanEsophagusESCC7.46e-032.36e-010.0514
83596BCL2L12LZE7THumanEsophagusESCC2.64e-124.91e-010.0667
83596BCL2L12LZE8THumanEsophagusESCC3.11e-032.00e-010.067
83596BCL2L12LZE20THumanEsophagusESCC2.22e-029.77e-020.0662
83596BCL2L12LZE22THumanEsophagusESCC1.15e-076.08e-010.068
83596BCL2L12LZE24THumanEsophagusESCC1.87e-154.73e-010.0596
83596BCL2L12LZE21THumanEsophagusESCC1.39e-044.25e-010.0655
83596BCL2L12LZE6THumanEsophagusESCC5.35e-031.75e-010.0845
83596BCL2L12P1T-EHumanEsophagusESCC1.04e-074.96e-010.0875
83596BCL2L12P2T-EHumanEsophagusESCC1.31e-215.11e-010.1177
83596BCL2L12P4T-EHumanEsophagusESCC2.14e-327.80e-010.1323
83596BCL2L12P5T-EHumanEsophagusESCC3.35e-183.99e-010.1327
83596BCL2L12P8T-EHumanEsophagusESCC2.37e-428.89e-010.0889
83596BCL2L12P9T-EHumanEsophagusESCC2.41e-123.12e-010.1131
83596BCL2L12P10T-EHumanEsophagusESCC2.23e-295.63e-010.116
83596BCL2L12P11T-EHumanEsophagusESCC1.77e-094.21e-010.1426
83596BCL2L12P12T-EHumanEsophagusESCC4.48e-306.32e-010.1122
83596BCL2L12P15T-EHumanEsophagusESCC6.03e-266.50e-010.1149
83596BCL2L12P16T-EHumanEsophagusESCC2.69e-152.36e-010.1153
Page: 1 2 3 4 5 6 

check button Transcriptomic changes along malignancy continuum.
TissueExpression DynamicsAbbreviation
EsophagusThe image shows the transcriptomic changes along malignancy continuum.log2FC in expression of this searched gene in stem-like cells from each diseased tissue sample relative to stem-like cells in normal samples in each tissue plotted against the malignancy continuum. Samples are colored based on if they are from different disease stage.ESCC: Esophageal squamous cell carcinoma
HGIN: High-grade intraepithelial neoplasias
LGIN: Low-grade intraepithelial neoplasias
LiverThe image shows the transcriptomic changes along malignancy continuum.log2FC in expression of this searched gene in stem-like cells from each diseased tissue sample relative to stem-like cells in normal samples in each tissue plotted against the malignancy continuum. Samples are colored based on if they are from different disease stage.
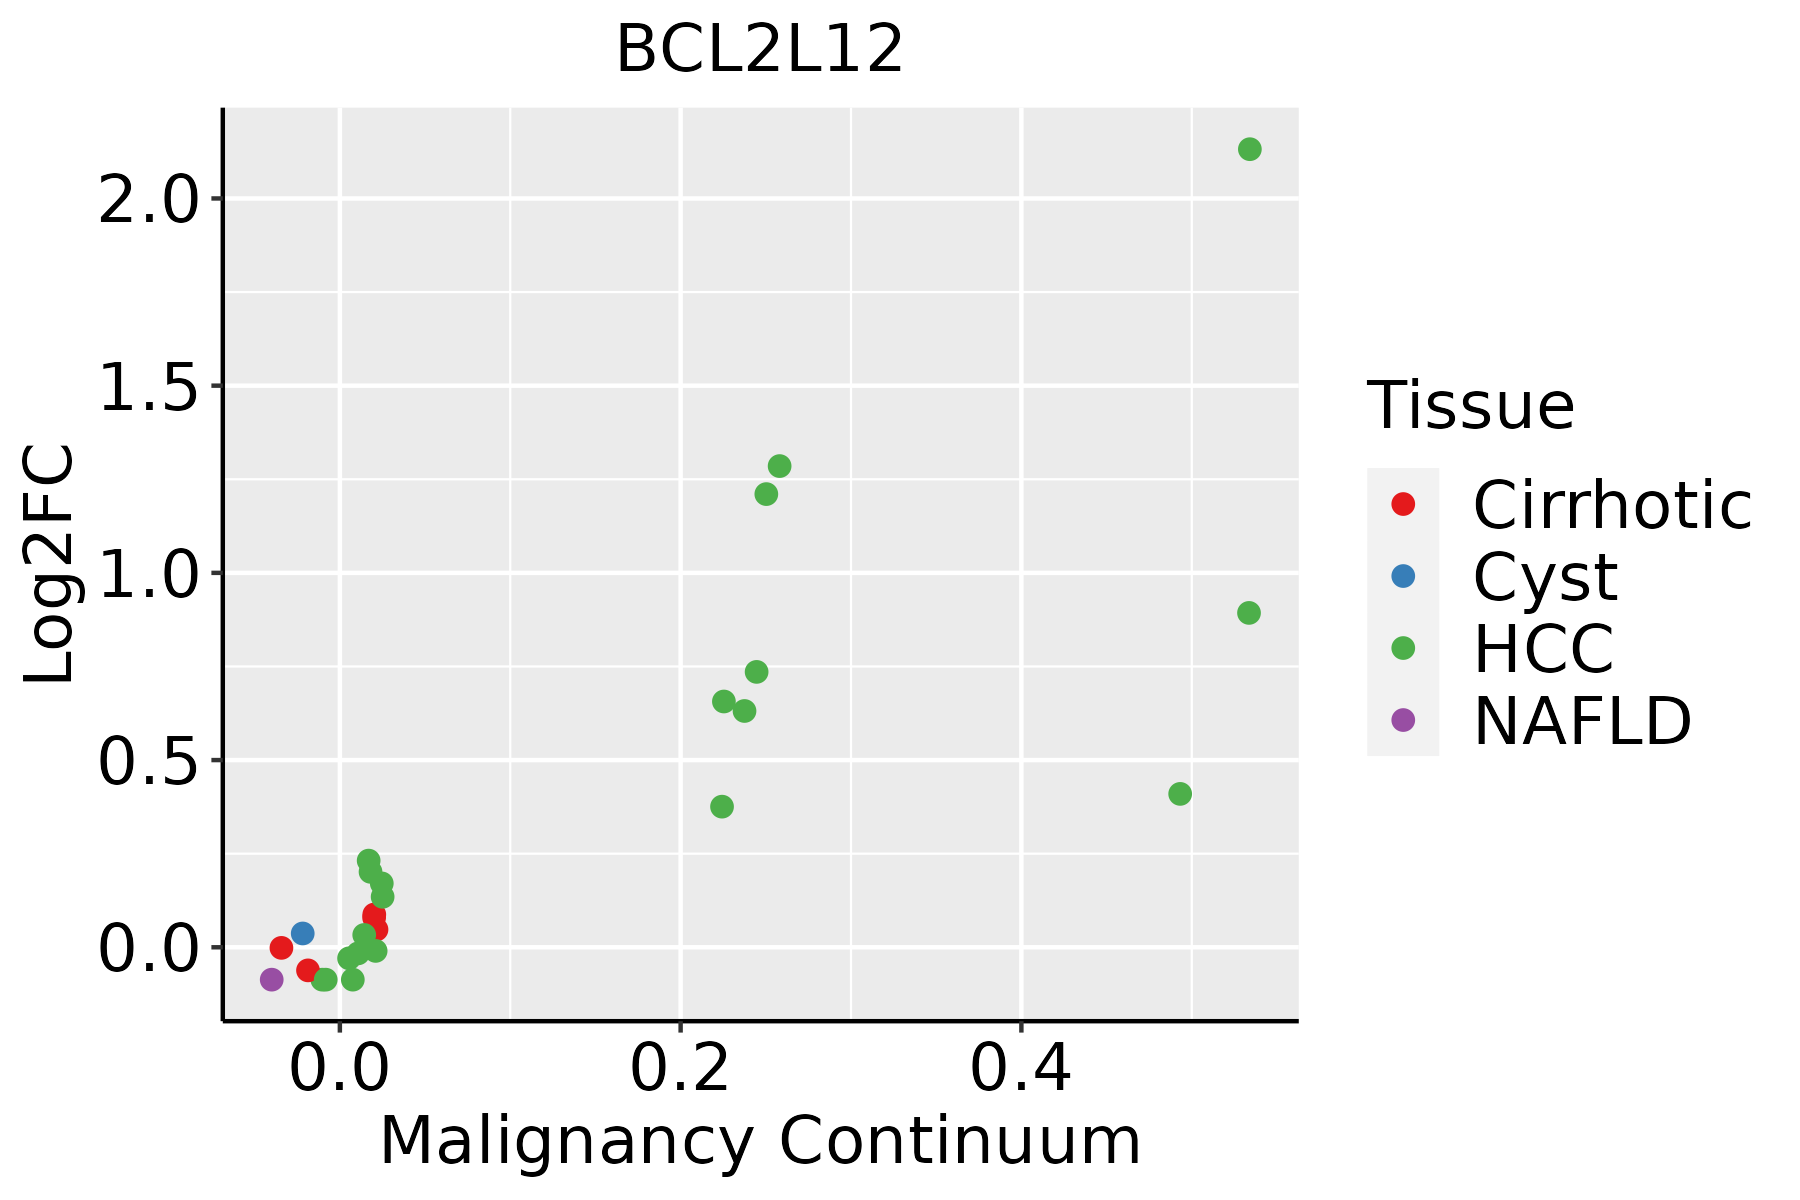
HCC: Hepatocellular carcinoma
NAFLD: Non-alcoholic fatty liver disease
Oral CavityThe image shows the transcriptomic changes along malignancy continuum.log2FC in expression of this searched gene in stem-like cells from each diseased tissue sample relative to stem-like cells in normal samples in each tissue plotted against the malignancy continuum. Samples are colored based on if they are from different disease stage.
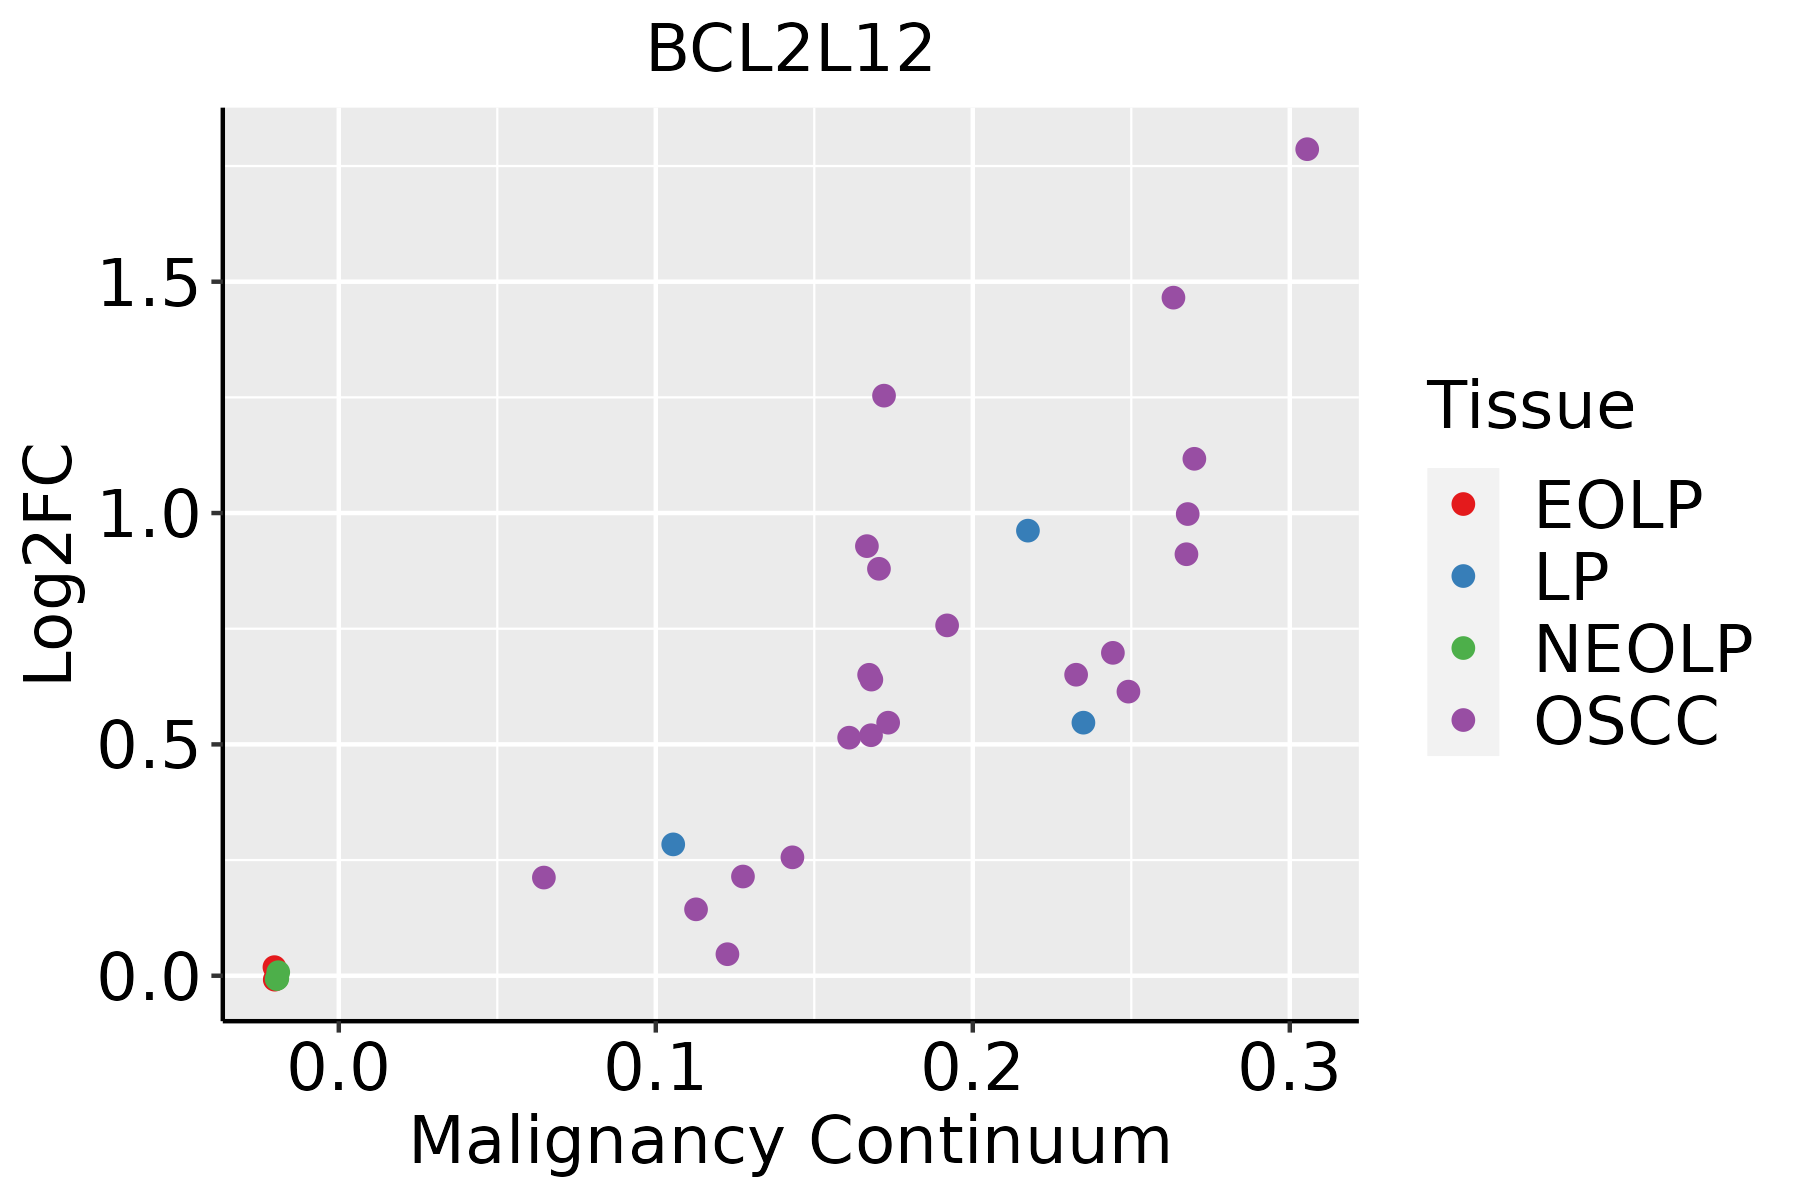
EOLP: Erosive Oral lichen planus
LP: leukoplakia
NEOLP: Non-erosive oral lichen planus
OSCC: Oral squamous cell carcinoma
SkinThe image shows the transcriptomic changes along malignancy continuum.log2FC in expression of this searched gene in stem-like cells from each diseased tissue sample relative to stem-like cells in normal samples in each tissue plotted against the malignancy continuum. Samples are colored based on if they are from different disease stage.
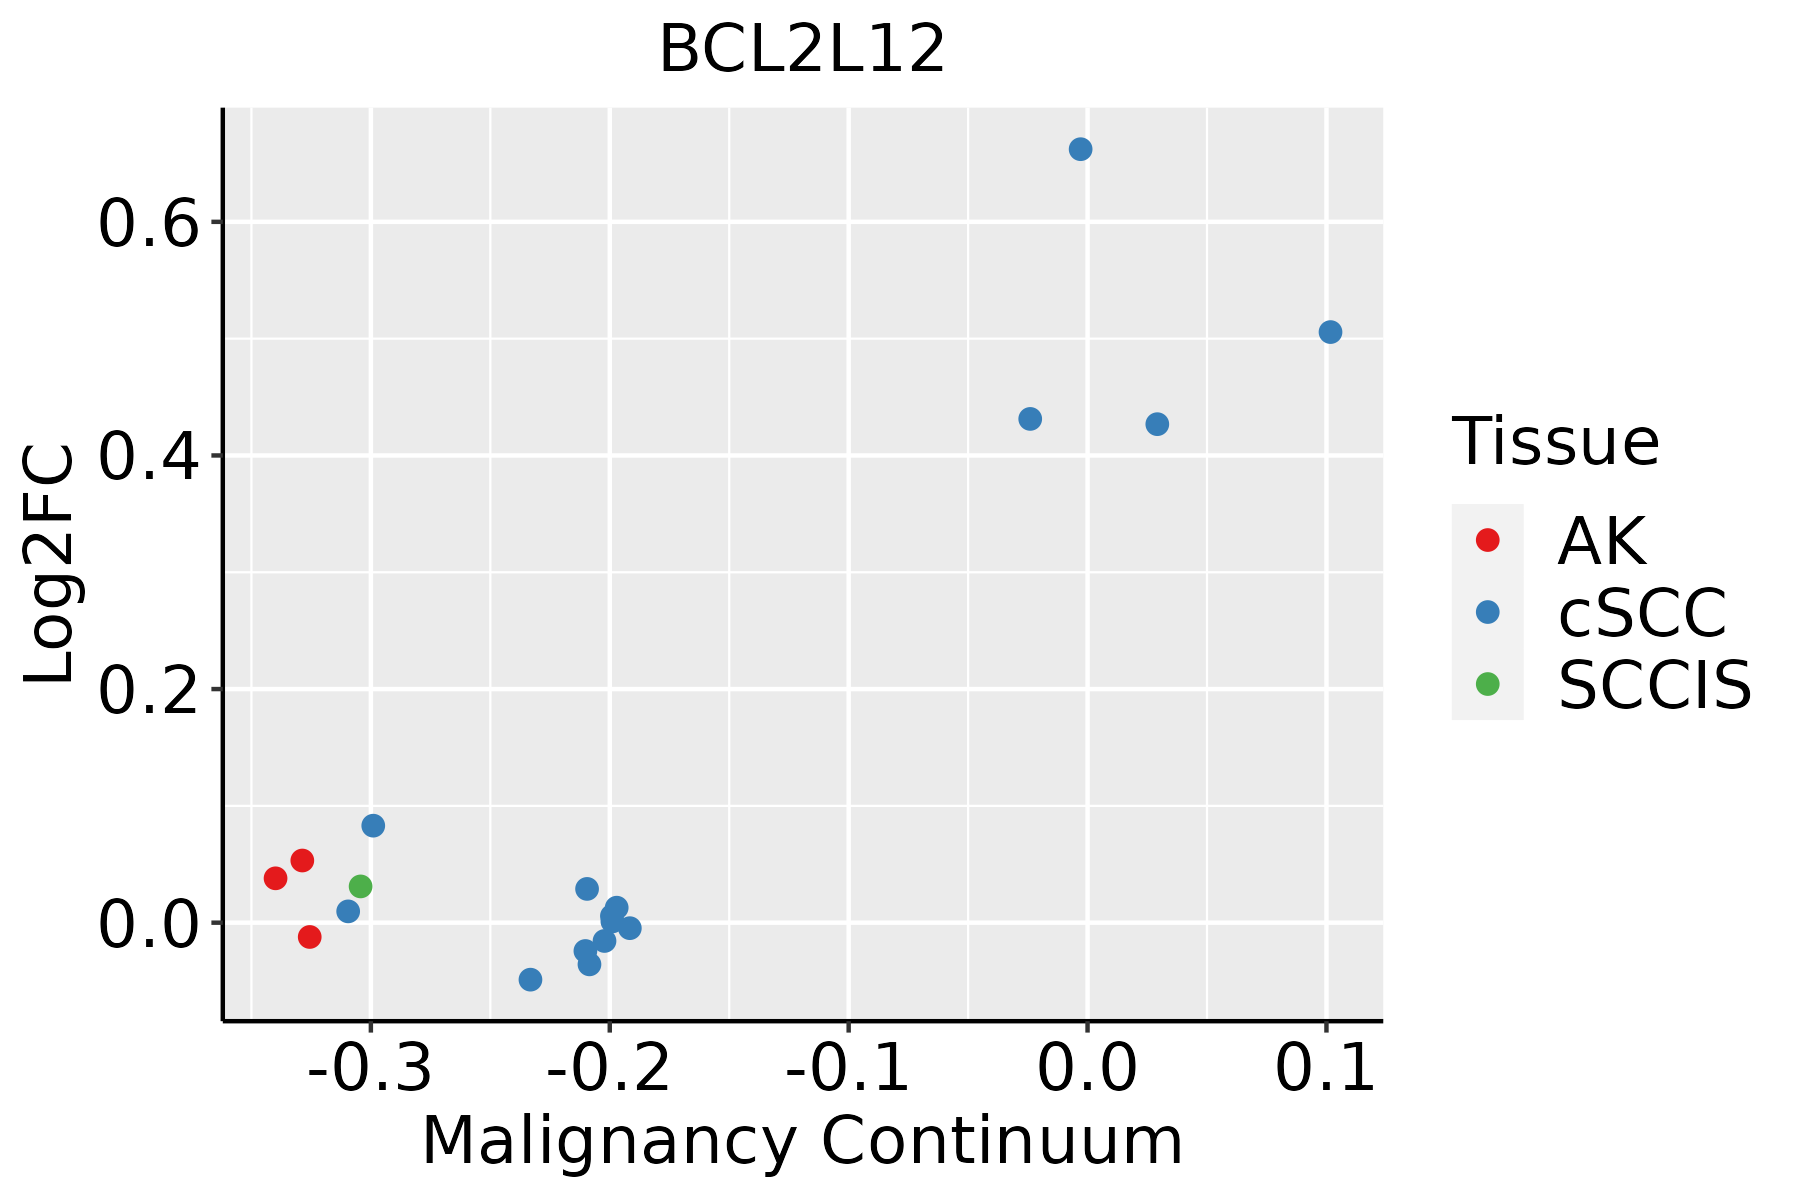
AK: Actinic keratosis
cSCC: Cutaneous squamous cell carcinoma
SCCIS:squamous cell carcinoma in situ
ThyroidThe image shows the transcriptomic changes along malignancy continuum.log2FC in expression of this searched gene in stem-like cells from each diseased tissue sample relative to stem-like cells in normal samples in each tissue plotted against the malignancy continuum. Samples are colored based on if they are from different disease stage.ATC: Anaplastic thyroid cancer
HT: Hashimoto's thyroiditis
PTC: Papillary thyroid cancer
∗log2FC in expression of this searched gene in stem-like cells from each diseased tissue sample relative to stem-like cells in normal samples in each tissue plotted against the malignancy continuum. Samples are colored based on if they are from different disease stage.

Top

Malignant transformation related pathway analysis

check buttonFind out the enriched GO biological processes and KEGG pathways involved in transition from healthy to precancer to cancer
check button Figure of enriched GO biological processes.
TissueDisease StageEnriched GO biological Processes
ColorectumADGO analysis - Figure of enriched GO biological processes: Top 15 enriched GO BP terms are showed in the bar plot of each disease state in each tissue. Each row represents a significant GO biological process which is colored according to the -log10(p.adjust).
ColorectumSERGO analysis - Figure of enriched GO biological processes: Top 15 enriched GO BP terms are showed in the bar plot of each disease state in each tissue. Each row represents a significant GO biological process which is colored according to the -log10(p.adjust).
ColorectumMSSGO analysis - Figure of enriched GO biological processes: Top 15 enriched GO BP terms are showed in the bar plot of each disease state in each tissue. Each row represents a significant GO biological process which is colored according to the -log10(p.adjust).
ColorectumMSI-HGO analysis - Figure of enriched GO biological processes: Top 15 enriched GO BP terms are showed in the bar plot of each disease state in each tissue. Each row represents a significant GO biological process which is colored according to the -log10(p.adjust).
ColorectumFAPGO analysis - Figure of enriched GO biological processes: Top 15 enriched GO BP terms are showed in the bar plot of each disease state in each tissue. Each row represents a significant GO biological process which is colored according to the -log10(p.adjust).
∗Top 15 enriched GO BP terms are showed in the bar plot of each disease state in each tissue. Each row represents a significant GO biological process which is colored according to the -log10(p.adjust).
Page: 1 2 3 4 5 6 7 8 9 

check button Enriched GO biological processes.
GO IDTissueDisease StageDescriptionGene RatioBg Ratiopvaluep.adjustCount
GO:2001233111EsophagusESCCregulation of apoptotic signaling pathway256/8552356/187234.11e-241.04e-21256
GO:0097191111EsophagusESCCextrinsic apoptotic signaling pathway159/8552219/187234.12e-162.94e-14159
GO:2001236111EsophagusESCCregulation of extrinsic apoptotic signaling pathway111/8552151/187232.97e-121.18e-10111
GO:2000116111EsophagusESCCregulation of cysteine-type endopeptidase activity158/8552235/187231.67e-115.90e-10158
GO:0043281111EsophagusESCCregulation of cysteine-type endopeptidase activity involved in apoptotic process143/8552209/187232.12e-117.31e-10143
GO:005160418EsophagusESCCprotein maturation189/8552294/187237.64e-112.39e-09189
GO:0052547111EsophagusESCCregulation of peptidase activity275/8552461/187237.54e-101.88e-08275
GO:0052548111EsophagusESCCregulation of endopeptidase activity253/8552432/187233.68e-086.78e-07253
GO:2000117110EsophagusESCCnegative regulation of cysteine-type endopeptidase activity63/855286/187231.84e-072.88e-0663
GO:0043154110EsophagusESCCnegative regulation of cysteine-type endopeptidase activity involved in apoptotic process58/855278/187232.38e-073.61e-0658
GO:001648514EsophagusESCCprotein processing134/8552225/187231.81e-051.60e-04134
GO:0045861111EsophagusESCCnegative regulation of proteolysis195/8552351/187231.13e-047.85e-04195
GO:0051346110EsophagusESCCnegative regulation of hydrolase activity208/8552379/187231.76e-041.14e-03208
GO:001046620EsophagusESCCnegative regulation of peptidase activity140/8552262/187236.73e-032.46e-02140
GO:001095119EsophagusESCCnegative regulation of endopeptidase activity135/8552252/187236.86e-032.51e-02135
GO:001095511EsophagusESCCnegative regulation of protein processing20/855229/187239.66e-033.34e-0220
GO:190331811EsophagusESCCnegative regulation of protein maturation20/855229/187239.66e-033.34e-0220
GO:200123312LiverCirrhoticregulation of apoptotic signaling pathway163/4634356/187232.62e-184.43e-16163
GO:005254712LiverCirrhoticregulation of peptidase activity185/4634461/187231.32e-131.09e-11185
GO:005254812LiverCirrhoticregulation of endopeptidase activity172/4634432/187232.12e-121.58e-10172
Page: 1 2 3 4 5 6 7 

check button Enriched KEGG pathways.
Pathway IDTissueDisease StageDescriptionGene RatioBg Ratiopvaluep.adjustqvalueCount
Page: 1 

Top

Cell-cell communication analysis

check buttonIdentification of potential cell-cell interactions between two cell types and their ligand-receptor pairs for different disease states
LigandReceptorLRpairPathwayTissueDisease Stage
Page: 1 

Top

Single-cell gene regulatory network inference analysis

check buttonFind out the significant the regulons (TFs) and the target genes of each regulon across cell types for different disease states
TFCell TypeTissueDisease StageTarget GeneRSSRegulon Activity
∗The dot plots of a searched regulon are shown for all cell subpopulations in each disease state of each tissue based on the regulon specific score inferred using pySCENIC and by calculating the average expression.
Page: 1 

Top

Somatic mutation of malignant transformation related genes

check buttonAnnotation of somatic variants for genes involved in malignant transformation
Hugo SymbolVariant ClassVariant ClassificationdbSNP RSHGVScHGVSpHGVSp ShortSWISSPROTBIOTYPESIFTPolyPhenTumor Sample BarcodeTissueHistologySexAgeStageTherapy TypesDrugsOutcome
BCL2L12SNVMissense_Mutationc.848N>Gp.Ala283Glyp.A283GQ9HB09protein_codingdeleterious(0.01)probably_damaging(0.992)TCGA-BH-A18V-01Breastbreast invasive carcinomaFemale<65I/IIUnknownUnknownSD
BCL2L12SNVMissense_Mutationc.133N>Gp.Arg45Glyp.R45GQ9HB09protein_codingtolerated_low_confidence(0.11)benign(0.03)TCGA-IR-A3LK-01Cervixcervical & endocervical cancerFemale>=65I/IIChemotherapycisplatinPD
BCL2L12SNVMissense_Mutationnovelc.743N>Ap.Arg248Hisp.R248HQ9HB09protein_codingtolerated(0.06)probably_damaging(0.996)TCGA-AA-3556-01Colorectumcolon adenocarcinomaMale>=65I/IIUnknownUnknownSD
BCL2L12SNVMissense_Mutationnovelc.247G>Ap.Ala83Thrp.A83TQ9HB09protein_codingdeleterious_low_confidence(0.01)benign(0.01)TCGA-AA-3947-01Colorectumcolon adenocarcinomaFemale<65I/IIUnknownUnknownSD
BCL2L12insertionFrame_Shift_Insnovelc.439_440insCp.Ser149LeufsTer2p.S149Lfs*2Q9HB09protein_codingTCGA-AG-A02N-01Colorectumrectum adenocarcinomaMale>=65I/IIChemotherapyfolinicCR
BCL2L12SNVMissense_Mutationnovelc.946N>Ap.Gly316Argp.G316RQ9HB09protein_codingdeleterious(0)possibly_damaging(0.655)TCGA-AJ-A8CV-01Endometriumuterine corpus endometrioid carcinomaFemale<65I/IIUnknownUnknownSD
BCL2L12SNVMissense_Mutationnovelc.163N>Tp.Val55Phep.V55FQ9HB09protein_codingdeleterious_low_confidence(0)probably_damaging(0.996)TCGA-AP-A059-01Endometriumuterine corpus endometrioid carcinomaFemale>=65I/IIUnknownUnknownSD
BCL2L12SNVMissense_Mutationc.547N>Cp.Glu183Glnp.E183QQ9HB09protein_codingdeleterious(0.03)probably_damaging(0.996)TCGA-AP-A0LI-01Endometriumuterine corpus endometrioid carcinomaFemale>=65III/IVChemotherapypaclitaxelSD
BCL2L12SNVMissense_Mutationnovelc.446N>Gp.Ser149Cysp.S149CQ9HB09protein_codingdeleterious_low_confidence(0)benign(0.01)TCGA-AX-A2IO-01Endometriumuterine corpus endometrioid carcinomaFemale>=65I/IIChemotherapycarboplatinSD
BCL2L12SNVMissense_Mutationrs747252998c.895N>Ap.Gly299Argp.G299RQ9HB09protein_codingdeleterious(0)possibly_damaging(0.758)TCGA-B5-A0JV-01Endometriumuterine corpus endometrioid carcinomaFemale<65I/IIUnknownUnknownPD
Page: 1 2 3 

Top

Related drugs of malignant transformation related genes

check buttonIdentification of chemicals and drugs interact with genes involved in malignant transfromation
(DGIdb 4.0)
Entrez IDSymbolCategoryInteraction TypesDrug Claim NameDrug NamePMIDs
Page: 1