
|
|||||
|
 | |
| |
| |
| |
| |
| |
|
Gene: BCL2A1 |
Gene summary for BCL2A1 |
| Gene information | Species | Human | Gene symbol | BCL2A1 | Gene ID | 597 |
| Gene name | BCL2 related protein A1 | |
| Gene Alias | ACC-1 | |
| Cytomap | 15q25.1 | |
| Gene Type | protein-coding | GO ID | GO:0006915 | UniProtAcc | Q16548 |
Top |
Malignant transformation analysis |
| Identification of the aberrant gene expression in precancerous and cancerous lesions by comparing the gene expression of stem-like cells in diseased tissues with normal stem cells |
| Entrez ID | Symbol | Replicates | Species | Organ | Tissue | Adj P-value | Log2FC | Malignancy |
| 597 | BCL2A1 | GSM4909287 | Human | Breast | IDC | 3.31e-25 | 7.94e-01 | 0.2057 |
| 597 | BCL2A1 | LZE11D | Human | Esophagus | HGIN | 3.32e-06 | 5.98e-01 | -0.005 |
| 597 | BCL2A1 | P2T-E | Human | Esophagus | ESCC | 5.53e-12 | 6.90e-01 | 0.1177 |
| 597 | BCL2A1 | P76T-E | Human | Esophagus | ESCC | 7.28e-05 | 4.36e-01 | 0.1207 |
| 597 | BCL2A1 | C04 | Human | Oral cavity | OSCC | 2.02e-04 | 3.70e-01 | 0.2633 |
| 597 | BCL2A1 | C21 | Human | Oral cavity | OSCC | 3.11e-21 | 1.08e+00 | 0.2678 |
| 597 | BCL2A1 | C30 | Human | Oral cavity | OSCC | 1.17e-14 | 5.04e-01 | 0.3055 |
| 597 | BCL2A1 | C51 | Human | Oral cavity | OSCC | 3.00e-03 | 2.44e-01 | 0.2674 |
| 597 | BCL2A1 | C07 | Human | Oral cavity | OSCC | 4.58e-04 | 4.53e-01 | 0.2491 |
| 597 | BCL2A1 | C08 | Human | Oral cavity | OSCC | 3.61e-03 | 1.71e-01 | 0.1919 |
| 597 | BCL2A1 | C09 | Human | Oral cavity | OSCC | 9.22e-04 | 1.12e-01 | 0.1431 |
| 597 | BCL2A1 | EOLP-1 | Human | Oral cavity | EOLP | 8.23e-16 | 5.98e-01 | -0.0202 |
| 597 | BCL2A1 | EOLP-2 | Human | Oral cavity | EOLP | 1.22e-08 | 3.97e-01 | -0.0203 |
| Page: 1 |
| Tissue | Expression Dynamics | Abbreviation |
| Breast | 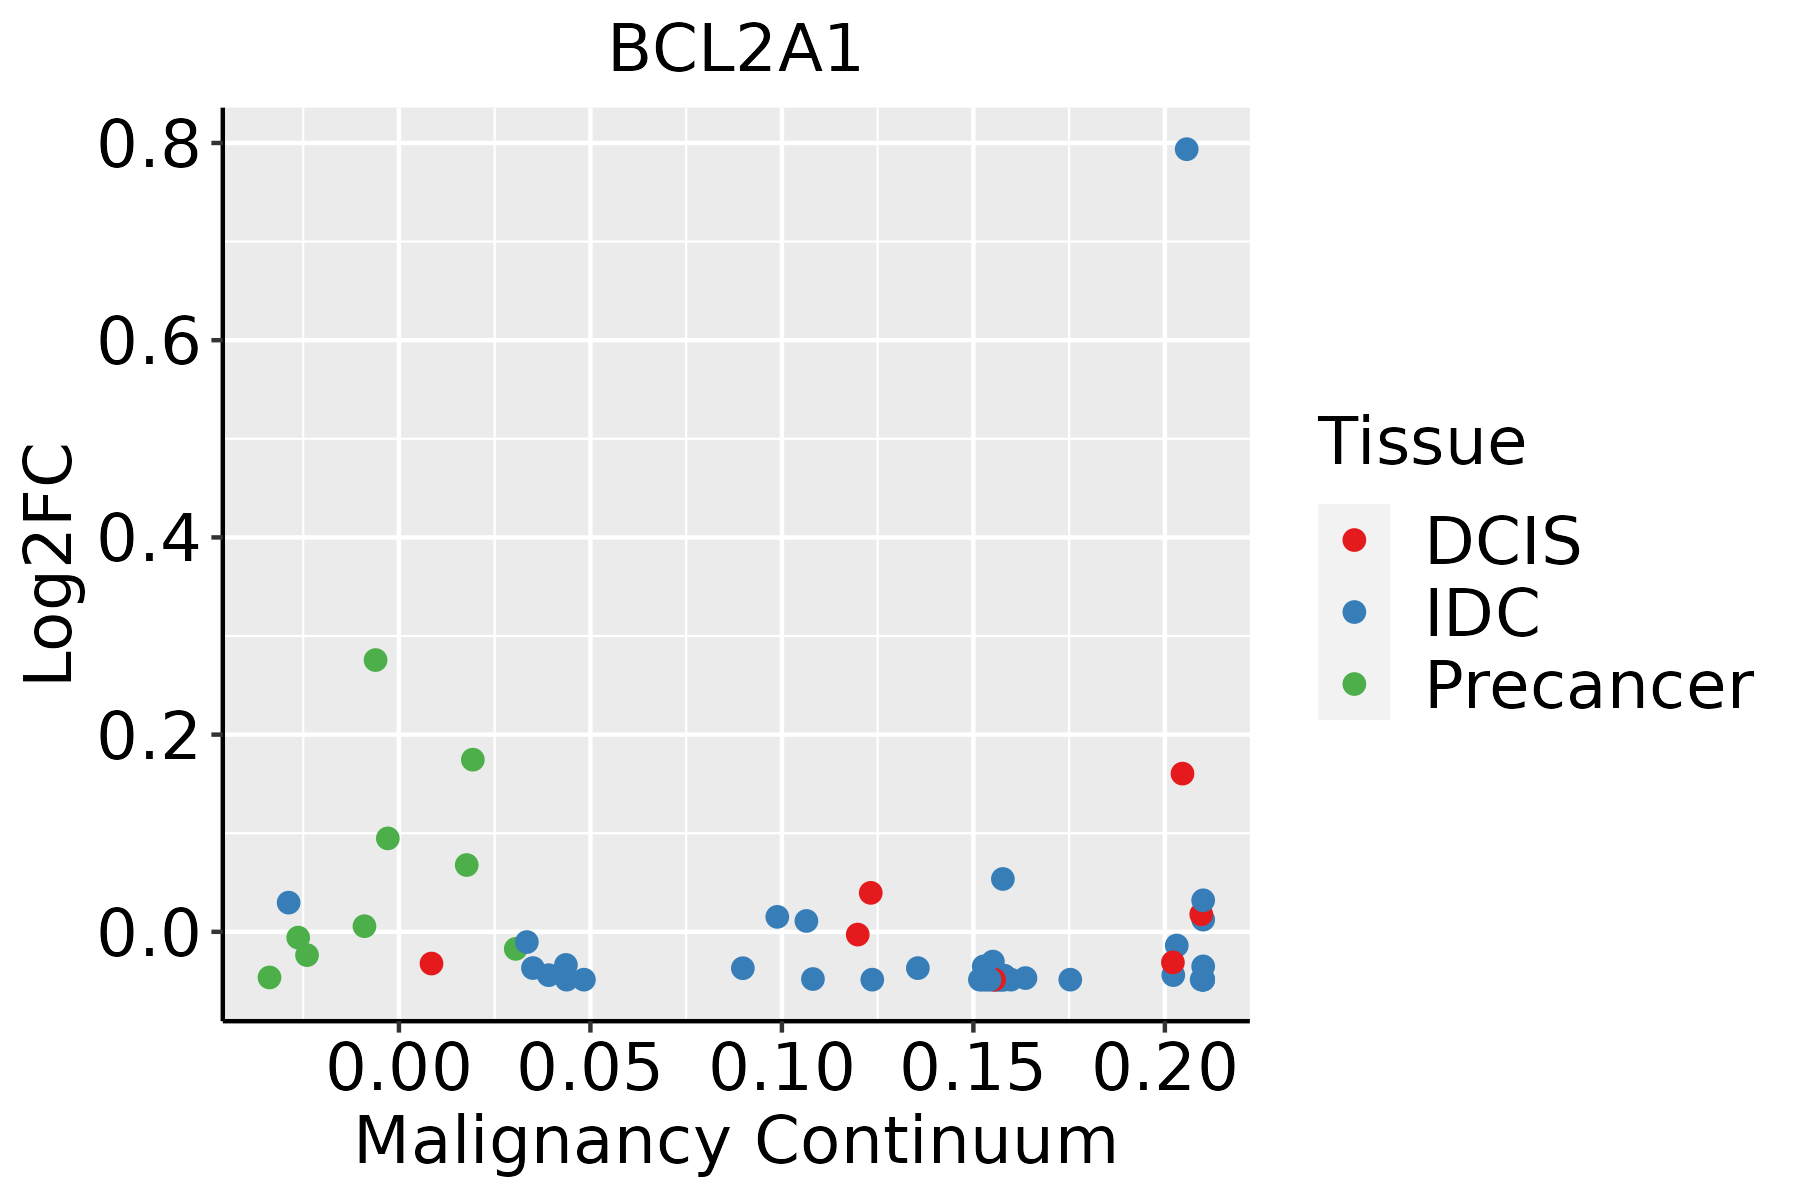 | IDC: Invasive ductal carcinoma |
| DCIS: Ductal carcinoma in situ | ||
| Precancer(BRCA1-mut): Precancerous lesion from BRCA1 mutation carriers | ||
| Esophagus | 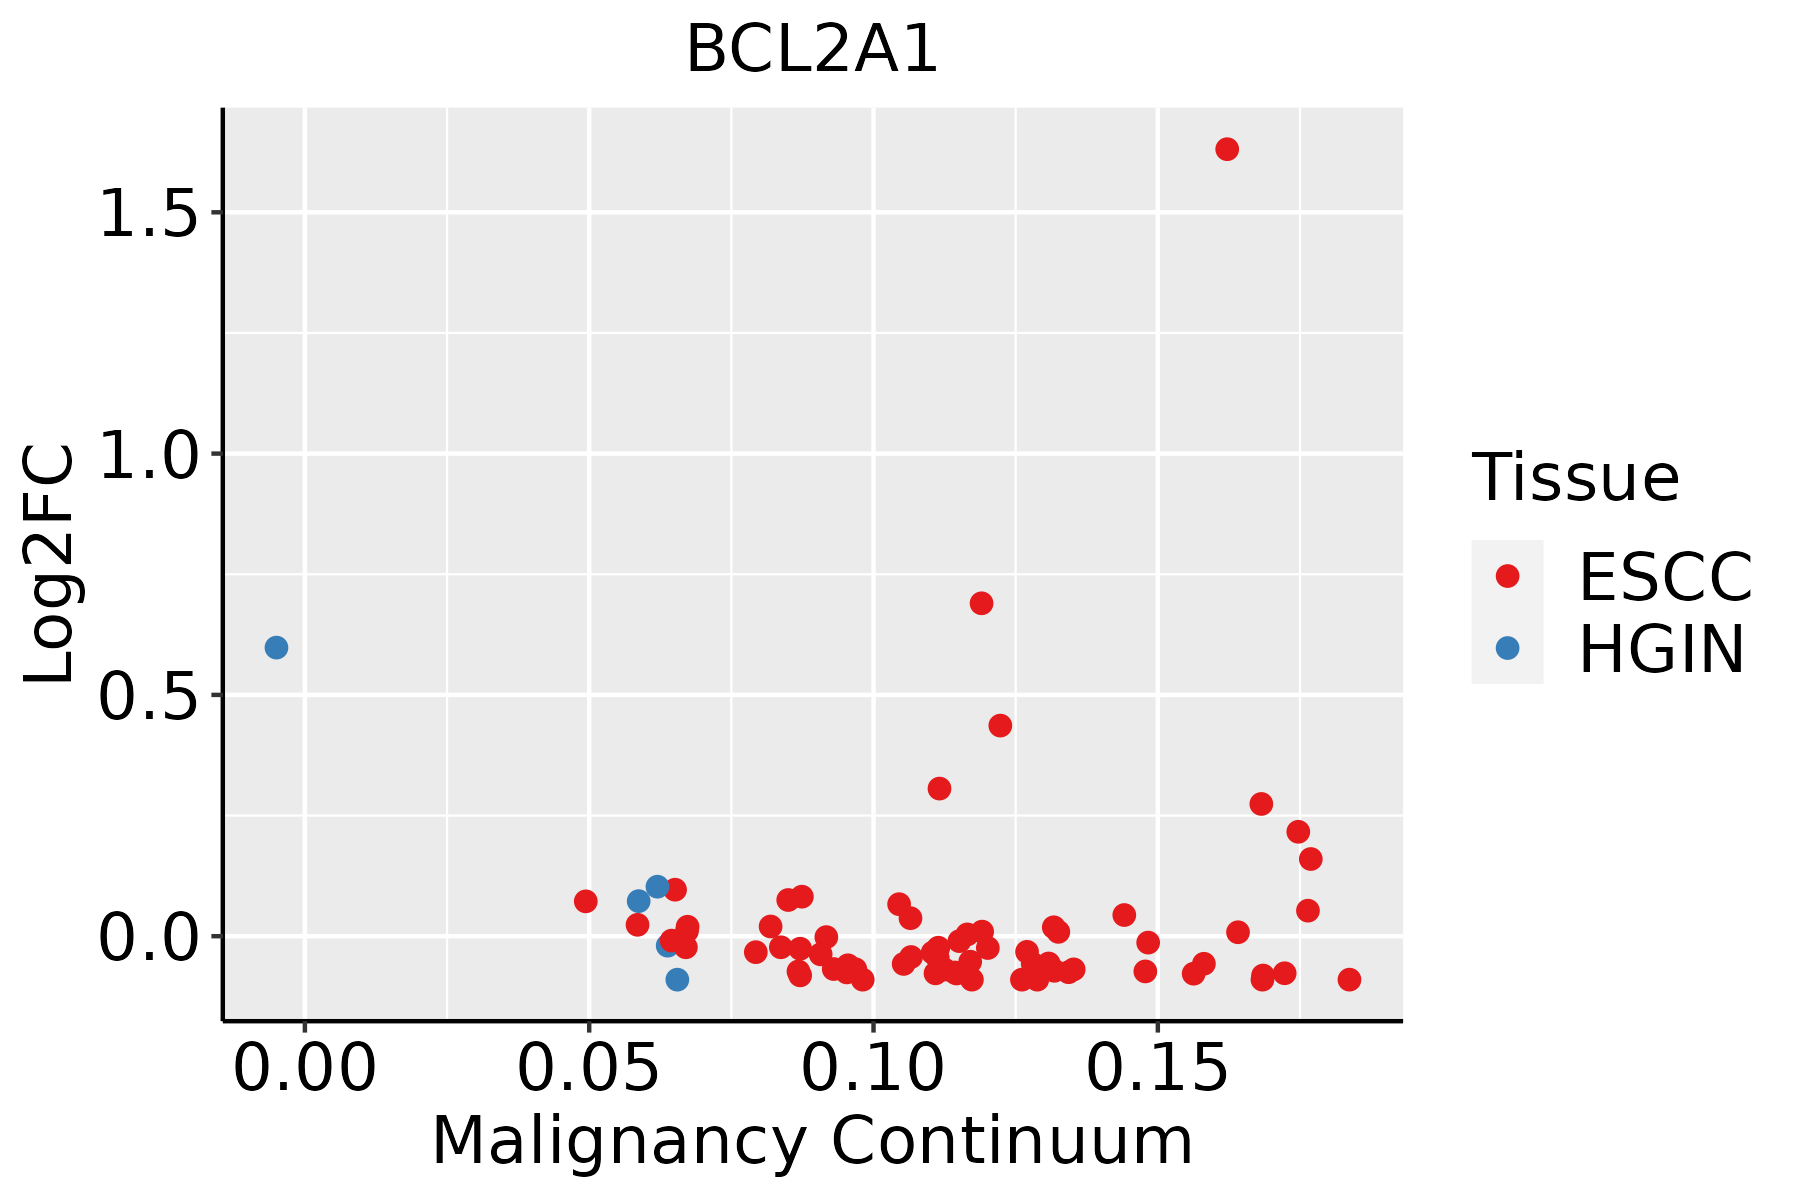 | ESCC: Esophageal squamous cell carcinoma |
| HGIN: High-grade intraepithelial neoplasias | ||
| LGIN: Low-grade intraepithelial neoplasias | ||
| Oral Cavity |  | EOLP: Erosive Oral lichen planus |
| LP: leukoplakia | ||
| NEOLP: Non-erosive oral lichen planus | ||
| OSCC: Oral squamous cell carcinoma |
| ∗log2FC in expression of this searched gene in stem-like cells from each diseased tissue sample relative to stem-like cells in normal samples in each tissue plotted against the malignancy continuum. Samples are colored based on if they are from different disease stage. |
Top |
Malignant transformation related pathway analysis |
| Find out the enriched GO biological processes and KEGG pathways involved in transition from healthy to precancer to cancer |
| Tissue | Disease Stage | Enriched GO biological Processes |
| Colorectum | AD |  |
| Colorectum | SER |  |
| Colorectum | MSS |  |
| Colorectum | MSI-H |  |
| Colorectum | FAP |  |
| ∗Top 15 enriched GO BP terms are showed in the bar plot of each disease state in each tissue. Each row represents a significant GO biological process which is colored according to the -log10(p.adjust). |
| Page: 1 2 3 4 5 6 7 8 9 |
| GO ID | Tissue | Disease Stage | Description | Gene Ratio | Bg Ratio | pvalue | p.adjust | Count |
| GO:009719314 | Breast | IDC | intrinsic apoptotic signaling pathway | 69/1434 | 288/18723 | 6.32e-18 | 2.99e-15 | 69 |
| GO:009719114 | Breast | IDC | extrinsic apoptotic signaling pathway | 42/1434 | 219/18723 | 2.56e-08 | 1.73e-06 | 42 |
| GO:000756813 | Breast | IDC | aging | 52/1434 | 339/18723 | 1.14e-06 | 5.10e-05 | 52 |
| GO:000863013 | Breast | IDC | intrinsic apoptotic signaling pathway in response to DNA damage | 21/1434 | 99/18723 | 1.57e-05 | 3.94e-04 | 21 |
| GO:009719327 | Esophagus | HGIN | intrinsic apoptotic signaling pathway | 90/2587 | 288/18723 | 1.50e-14 | 2.80e-12 | 90 |
| GO:009719126 | Esophagus | HGIN | extrinsic apoptotic signaling pathway | 56/2587 | 219/18723 | 2.48e-06 | 8.80e-05 | 56 |
| GO:000863020 | Esophagus | HGIN | intrinsic apoptotic signaling pathway in response to DNA damage | 28/2587 | 99/18723 | 1.24e-04 | 2.54e-03 | 28 |
| GO:0097193111 | Esophagus | ESCC | intrinsic apoptotic signaling pathway | 222/8552 | 288/18723 | 5.87e-28 | 2.02e-25 | 222 |
| GO:0097191111 | Esophagus | ESCC | extrinsic apoptotic signaling pathway | 159/8552 | 219/18723 | 4.12e-16 | 2.94e-14 | 159 |
| GO:0008630110 | Esophagus | ESCC | intrinsic apoptotic signaling pathway in response to DNA damage | 78/8552 | 99/18723 | 1.43e-11 | 5.08e-10 | 78 |
| GO:000756820 | Esophagus | ESCC | aging | 201/8552 | 339/18723 | 2.64e-07 | 3.94e-06 | 201 |
| GO:00380347 | Esophagus | ESCC | signal transduction in absence of ligand | 48/8552 | 65/18723 | 3.63e-06 | 3.97e-05 | 48 |
| GO:00971927 | Esophagus | ESCC | extrinsic apoptotic signaling pathway in absence of ligand | 48/8552 | 65/18723 | 3.63e-06 | 3.97e-05 | 48 |
| GO:00215436 | Esophagus | ESCC | pallium development | 94/8552 | 169/18723 | 5.79e-03 | 2.14e-02 | 94 |
| GO:009719320 | Oral cavity | OSCC | intrinsic apoptotic signaling pathway | 202/7305 | 288/18723 | 4.64e-27 | 1.73e-24 | 202 |
| GO:009719120 | Oral cavity | OSCC | extrinsic apoptotic signaling pathway | 142/7305 | 219/18723 | 7.34e-15 | 4.55e-13 | 142 |
| GO:000756818 | Oral cavity | OSCC | aging | 194/7305 | 339/18723 | 6.18e-12 | 2.33e-10 | 194 |
| GO:000863018 | Oral cavity | OSCC | intrinsic apoptotic signaling pathway in response to DNA damage | 72/7305 | 99/18723 | 9.50e-12 | 3.50e-10 | 72 |
| GO:00380346 | Oral cavity | OSCC | signal transduction in absence of ligand | 44/7305 | 65/18723 | 2.63e-06 | 3.26e-05 | 44 |
| GO:00971926 | Oral cavity | OSCC | extrinsic apoptotic signaling pathway in absence of ligand | 44/7305 | 65/18723 | 2.63e-06 | 3.26e-05 | 44 |
| Page: 1 2 |
| Pathway ID | Tissue | Disease Stage | Description | Gene Ratio | Bg Ratio | pvalue | p.adjust | qvalue | Count |
| hsa0421022 | Breast | IDC | Apoptosis | 31/867 | 136/8465 | 1.34e-05 | 1.61e-04 | 1.20e-04 | 31 |
| hsa0421032 | Breast | IDC | Apoptosis | 31/867 | 136/8465 | 1.34e-05 | 1.61e-04 | 1.20e-04 | 31 |
| hsa0421020 | Esophagus | HGIN | Apoptosis | 36/1383 | 136/8465 | 1.67e-03 | 1.52e-02 | 1.20e-02 | 36 |
| hsa04210110 | Esophagus | HGIN | Apoptosis | 36/1383 | 136/8465 | 1.67e-03 | 1.52e-02 | 1.20e-02 | 36 |
| hsa052215 | Esophagus | ESCC | Acute myeloid leukemia | 49/4205 | 67/8465 | 7.43e-05 | 3.07e-04 | 1.57e-04 | 49 |
| hsa040645 | Esophagus | ESCC | NF-kappa B signaling pathway | 67/4205 | 104/8465 | 1.62e-03 | 4.89e-03 | 2.50e-03 | 67 |
| hsa052028 | Esophagus | ESCC | Transcriptional misregulation in cancer | 116/4205 | 193/8465 | 2.08e-03 | 5.95e-03 | 3.05e-03 | 116 |
| hsa0522113 | Esophagus | ESCC | Acute myeloid leukemia | 49/4205 | 67/8465 | 7.43e-05 | 3.07e-04 | 1.57e-04 | 49 |
| hsa0406412 | Esophagus | ESCC | NF-kappa B signaling pathway | 67/4205 | 104/8465 | 1.62e-03 | 4.89e-03 | 2.50e-03 | 67 |
| hsa0520213 | Esophagus | ESCC | Transcriptional misregulation in cancer | 116/4205 | 193/8465 | 2.08e-03 | 5.95e-03 | 3.05e-03 | 116 |
| hsa0421018 | Oral cavity | OSCC | Apoptosis | 101/3704 | 136/8465 | 3.34e-13 | 7.00e-12 | 3.56e-12 | 101 |
| hsa040644 | Oral cavity | OSCC | NF-kappa B signaling pathway | 67/3704 | 104/8465 | 1.57e-05 | 6.75e-05 | 3.44e-05 | 67 |
| hsa052214 | Oral cavity | OSCC | Acute myeloid leukemia | 42/3704 | 67/8465 | 1.34e-03 | 3.75e-03 | 1.91e-03 | 42 |
| hsa0421019 | Oral cavity | OSCC | Apoptosis | 101/3704 | 136/8465 | 3.34e-13 | 7.00e-12 | 3.56e-12 | 101 |
| hsa0406411 | Oral cavity | OSCC | NF-kappa B signaling pathway | 67/3704 | 104/8465 | 1.57e-05 | 6.75e-05 | 3.44e-05 | 67 |
| hsa0522112 | Oral cavity | OSCC | Acute myeloid leukemia | 42/3704 | 67/8465 | 1.34e-03 | 3.75e-03 | 1.91e-03 | 42 |
| hsa0421043 | Oral cavity | EOLP | Apoptosis | 40/1218 | 136/8465 | 4.20e-06 | 2.91e-05 | 1.72e-05 | 40 |
| hsa040642 | Oral cavity | EOLP | NF-kappa B signaling pathway | 31/1218 | 104/8465 | 3.72e-05 | 1.82e-04 | 1.07e-04 | 31 |
| hsa0522121 | Oral cavity | EOLP | Acute myeloid leukemia | 19/1218 | 67/8465 | 2.20e-03 | 7.32e-03 | 4.32e-03 | 19 |
| hsa0421053 | Oral cavity | EOLP | Apoptosis | 40/1218 | 136/8465 | 4.20e-06 | 2.91e-05 | 1.72e-05 | 40 |
| Page: 1 2 |
Top |
Cell-cell communication analysis |
| Identification of potential cell-cell interactions between two cell types and their ligand-receptor pairs for different disease states |
| Ligand | Receptor | LRpair | Pathway | Tissue | Disease Stage |
| Page: 1 |
Top |
Single-cell gene regulatory network inference analysis |
| Find out the significant the regulons (TFs) and the target genes of each regulon across cell types for different disease states |
| TF | Cell Type | Tissue | Disease Stage | Target Gene | RSS | Regulon Activity |
| ∗The dot plots of a searched regulon are shown for all cell subpopulations in each disease state of each tissue based on the regulon specific score inferred using pySCENIC and by calculating the average expression. |
| Page: 1 |
Top |
Somatic mutation of malignant transformation related genes |
| Annotation of somatic variants for genes involved in malignant transformation |
| Hugo Symbol | Variant Class | Variant Classification | dbSNP RS | HGVSc | HGVSp | HGVSp Short | SWISSPROT | BIOTYPE | SIFT | PolyPhen | Tumor Sample Barcode | Tissue | Histology | Sex | Age | Stage | Therapy Types | Drugs | Outcome |
| BCL2A1 | SNV | Missense_Mutation | c.296N>G | p.Leu99Arg | p.L99R | Q16548 | protein_coding | deleterious(0) | probably_damaging(0.999) | TCGA-D8-A1XK-01 | Breast | breast invasive carcinoma | Female | <65 | I/II | Chemotherapy | doxorubicine+cyclophosphamide | SD | |
| BCL2A1 | SNV | Missense_Mutation | novel | c.240N>C | p.Glu80Asp | p.E80D | Q16548 | protein_coding | tolerated(0.22) | possibly_damaging(0.814) | TCGA-AA-A00N-01 | Colorectum | colon adenocarcinoma | Male | >=65 | I/II | Unknown | Unknown | PD |
| BCL2A1 | SNV | Missense_Mutation | c.368N>T | p.Ala123Val | p.A123V | Q16548 | protein_coding | deleterious(0.01) | probably_damaging(0.915) | TCGA-AA-A02R-01 | Colorectum | colon adenocarcinoma | Female | >=65 | I/II | Unknown | Unknown | PD | |
| BCL2A1 | SNV | Missense_Mutation | c.422N>C | p.Glu141Ala | p.E141A | Q16548 | protein_coding | deleterious(0.01) | benign(0.246) | TCGA-CA-6717-01 | Colorectum | colon adenocarcinoma | Male | <65 | I/II | Chemotherapy | oxaliplatin | CR | |
| BCL2A1 | SNV | Missense_Mutation | c.375N>A | p.Phe125Leu | p.F125L | Q16548 | protein_coding | deleterious(0.01) | probably_damaging(0.958) | TCGA-CA-6717-01 | Colorectum | colon adenocarcinoma | Male | <65 | I/II | Chemotherapy | oxaliplatin | CR | |
| BCL2A1 | SNV | Missense_Mutation | c.358N>C | p.Tyr120His | p.Y120H | Q16548 | protein_coding | tolerated(0.49) | benign(0.003) | TCGA-AG-3887-01 | Colorectum | rectum adenocarcinoma | Male | >=65 | I/II | Chemotherapy | irinotecan | SD | |
| BCL2A1 | insertion | Frame_Shift_Ins | novel | c.472_473insAAAGTTGTTTATTTAAAAG | p.Leu158GlnfsTer15 | p.L158Qfs*15 | Q16548 | protein_coding | TCGA-AM-5820-01 | Colorectum | colon adenocarcinoma | Female | <65 | I/II | Unknown | Unknown | SD | ||
| BCL2A1 | SNV | Missense_Mutation | novel | c.472N>A | p.Leu158Ile | p.L158I | Q16548 | protein_coding | tolerated(0.26) | benign(0.01) | TCGA-A5-A0G1-01 | Endometrium | uterine corpus endometrioid carcinoma | Female | >=65 | I/II | Unknown | Unknown | SD |
| BCL2A1 | SNV | Missense_Mutation | novel | c.364N>A | p.Val122Ile | p.V122I | Q16548 | protein_coding | tolerated(0.58) | benign(0.034) | TCGA-A5-A0G1-01 | Endometrium | uterine corpus endometrioid carcinoma | Female | >=65 | I/II | Unknown | Unknown | SD |
| BCL2A1 | SNV | Missense_Mutation | novel | c.193G>T | p.Asp65Tyr | p.D65Y | Q16548 | protein_coding | deleterious(0.01) | probably_damaging(0.964) | TCGA-A5-A2K5-01 | Endometrium | uterine corpus endometrioid carcinoma | Female | >=65 | I/II | Unknown | Unknown | SD |
| Page: 1 2 |
Top |
Related drugs of malignant transformation related genes |
| Identification of chemicals and drugs interact with genes involved in malignant transfromation |
| (DGIdb 4.0) |
| Entrez ID | Symbol | Category | Interaction Types | Drug Claim Name | Drug Name | PMIDs |
| 597 | BCL2A1 | DRUGGABLE GENOME | Apogossypolone | |||
| 597 | BCL2A1 | DRUGGABLE GENOME | US8937193-compound-6b | |||
| 597 | BCL2A1 | DRUGGABLE GENOME | US8937193-compound-7 | |||
| 597 | BCL2A1 | DRUGGABLE GENOME | inhibitor | CHEMBL2107358 | OBATOCLAX MESYLATE |
| Page: 1 |

Copyright 2023-Present -The University of Texas Health Science Center at Houston |