
|
|||||
|
 | |
| |
| |
| |
| |
| |
|
Gene: BCL11B |
Gene summary for BCL11B |
| Gene information | Species | Human | Gene symbol | BCL11B | Gene ID | 64919 |
| Gene name | BAF chromatin remodeling complex subunit BCL11B | |
| Gene Alias | ATL1 | |
| Cytomap | 14q32.2 | |
| Gene Type | protein-coding | GO ID | GO:0000902 | UniProtAcc | L8B8F6 |
Top |
Malignant transformation analysis |
| Identification of the aberrant gene expression in precancerous and cancerous lesions by comparing the gene expression of stem-like cells in diseased tissues with normal stem cells |
| Entrez ID | Symbol | Replicates | Species | Organ | Tissue | Adj P-value | Log2FC | Malignancy |
| 64919 | BCL11B | LZE2T | Human | Esophagus | ESCC | 1.99e-06 | 5.50e-01 | 0.082 |
| 64919 | BCL11B | LZE4T | Human | Esophagus | ESCC | 1.91e-06 | 1.88e-01 | 0.0811 |
| 64919 | BCL11B | LZE7T | Human | Esophagus | ESCC | 5.39e-05 | 3.44e-01 | 0.0667 |
| 64919 | BCL11B | LZE22T | Human | Esophagus | ESCC | 6.09e-04 | 2.61e-01 | 0.068 |
| 64919 | BCL11B | LZE24T | Human | Esophagus | ESCC | 4.69e-23 | 9.97e-01 | 0.0596 |
| 64919 | BCL11B | LZE21T | Human | Esophagus | ESCC | 7.29e-03 | 1.52e-01 | 0.0655 |
| 64919 | BCL11B | LZE6T | Human | Esophagus | ESCC | 1.61e-06 | 2.53e-01 | 0.0845 |
| 64919 | BCL11B | P4T-E | Human | Esophagus | ESCC | 2.67e-20 | 4.32e-01 | 0.1323 |
| 64919 | BCL11B | P5T-E | Human | Esophagus | ESCC | 2.01e-03 | 1.93e-03 | 0.1327 |
| 64919 | BCL11B | P9T-E | Human | Esophagus | ESCC | 5.57e-05 | 1.82e-01 | 0.1131 |
| 64919 | BCL11B | P10T-E | Human | Esophagus | ESCC | 3.28e-49 | 1.06e+00 | 0.116 |
| 64919 | BCL11B | P11T-E | Human | Esophagus | ESCC | 3.39e-04 | 1.35e-01 | 0.1426 |
| 64919 | BCL11B | P12T-E | Human | Esophagus | ESCC | 4.66e-29 | 6.95e-01 | 0.1122 |
| 64919 | BCL11B | P15T-E | Human | Esophagus | ESCC | 1.55e-21 | 6.20e-01 | 0.1149 |
| 64919 | BCL11B | P16T-E | Human | Esophagus | ESCC | 3.46e-04 | -5.60e-02 | 0.1153 |
| 64919 | BCL11B | P20T-E | Human | Esophagus | ESCC | 7.23e-07 | 1.01e-01 | 0.1124 |
| 64919 | BCL11B | P21T-E | Human | Esophagus | ESCC | 1.99e-14 | 2.78e-01 | 0.1617 |
| 64919 | BCL11B | P22T-E | Human | Esophagus | ESCC | 2.04e-17 | 2.05e-01 | 0.1236 |
| 64919 | BCL11B | P24T-E | Human | Esophagus | ESCC | 8.99e-03 | -4.42e-02 | 0.1287 |
| 64919 | BCL11B | P26T-E | Human | Esophagus | ESCC | 2.26e-11 | 2.65e-01 | 0.1276 |
| Page: 1 2 3 4 |
| Tissue | Expression Dynamics | Abbreviation |
| Esophagus | 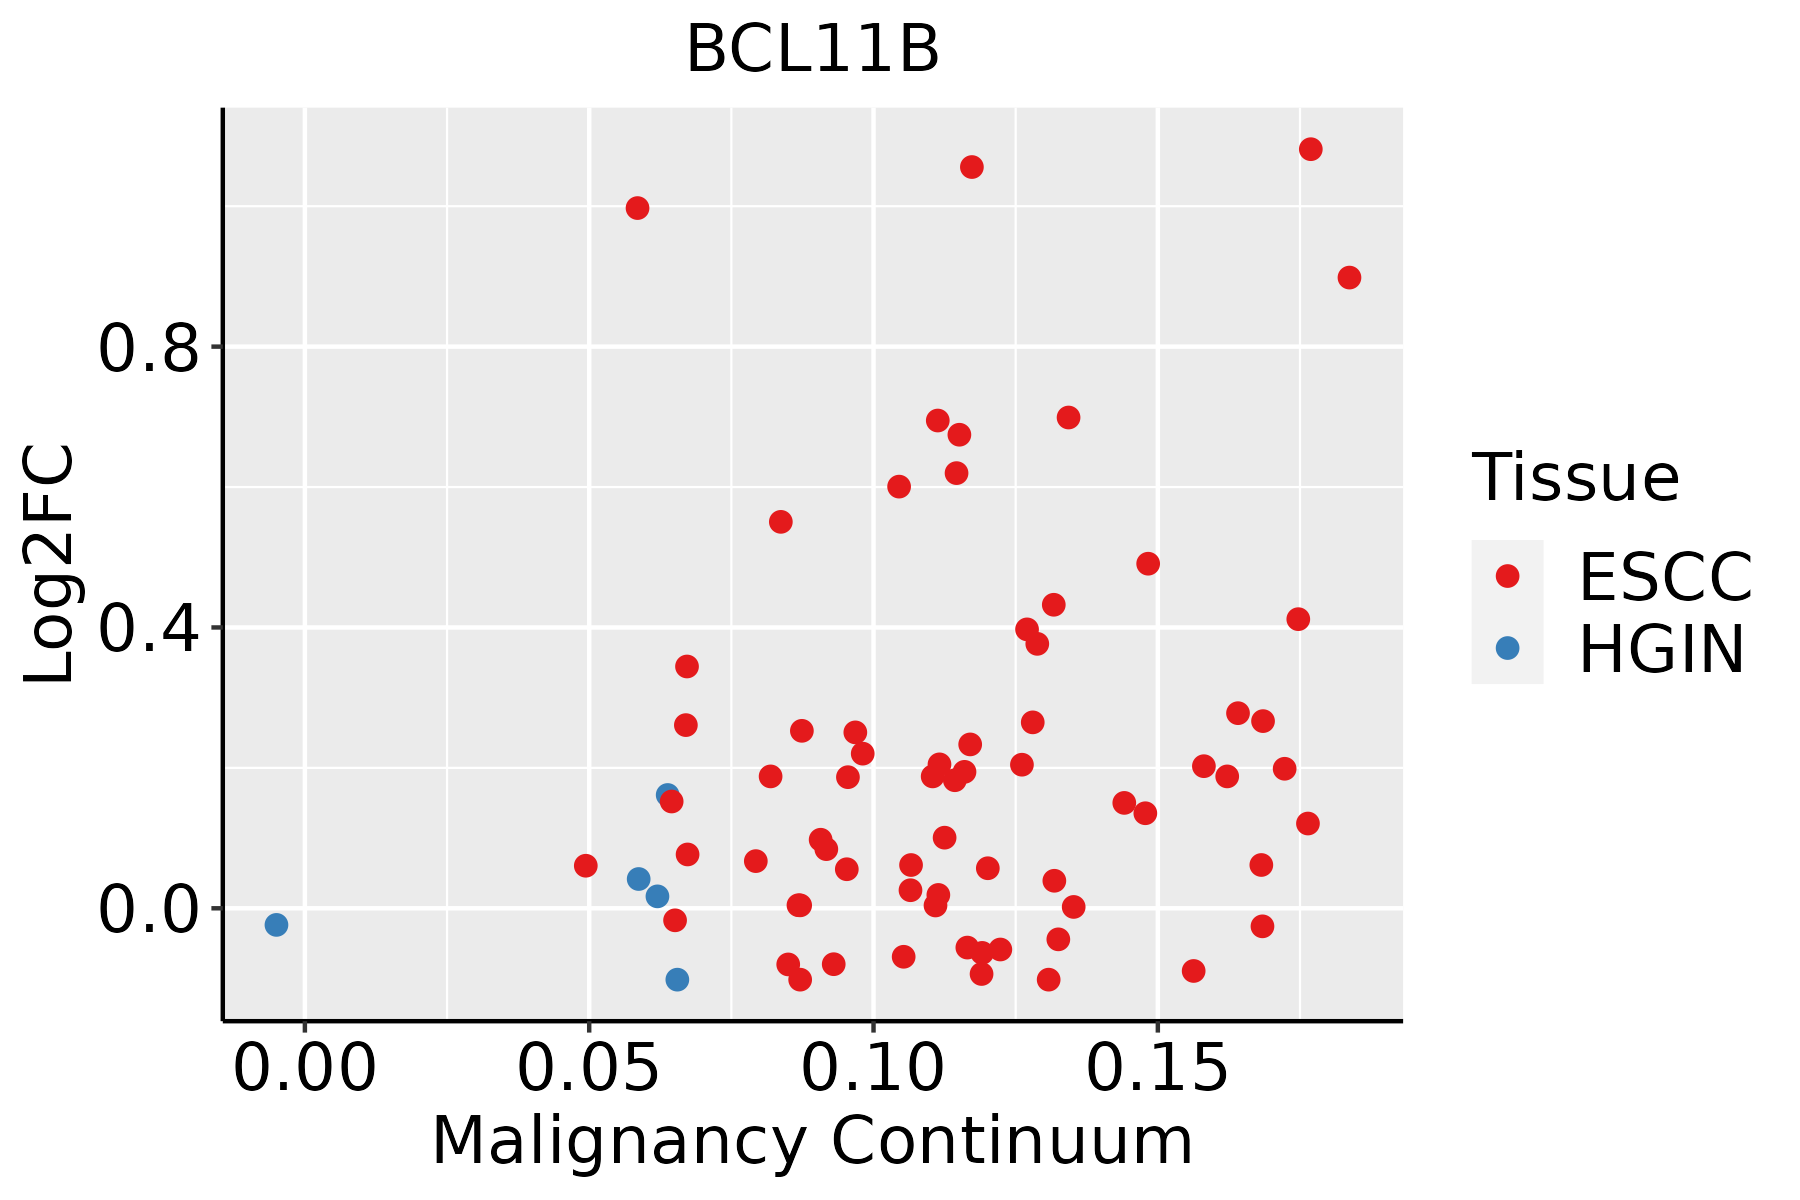 | ESCC: Esophageal squamous cell carcinoma |
| HGIN: High-grade intraepithelial neoplasias | ||
| LGIN: Low-grade intraepithelial neoplasias | ||
| Oral Cavity | 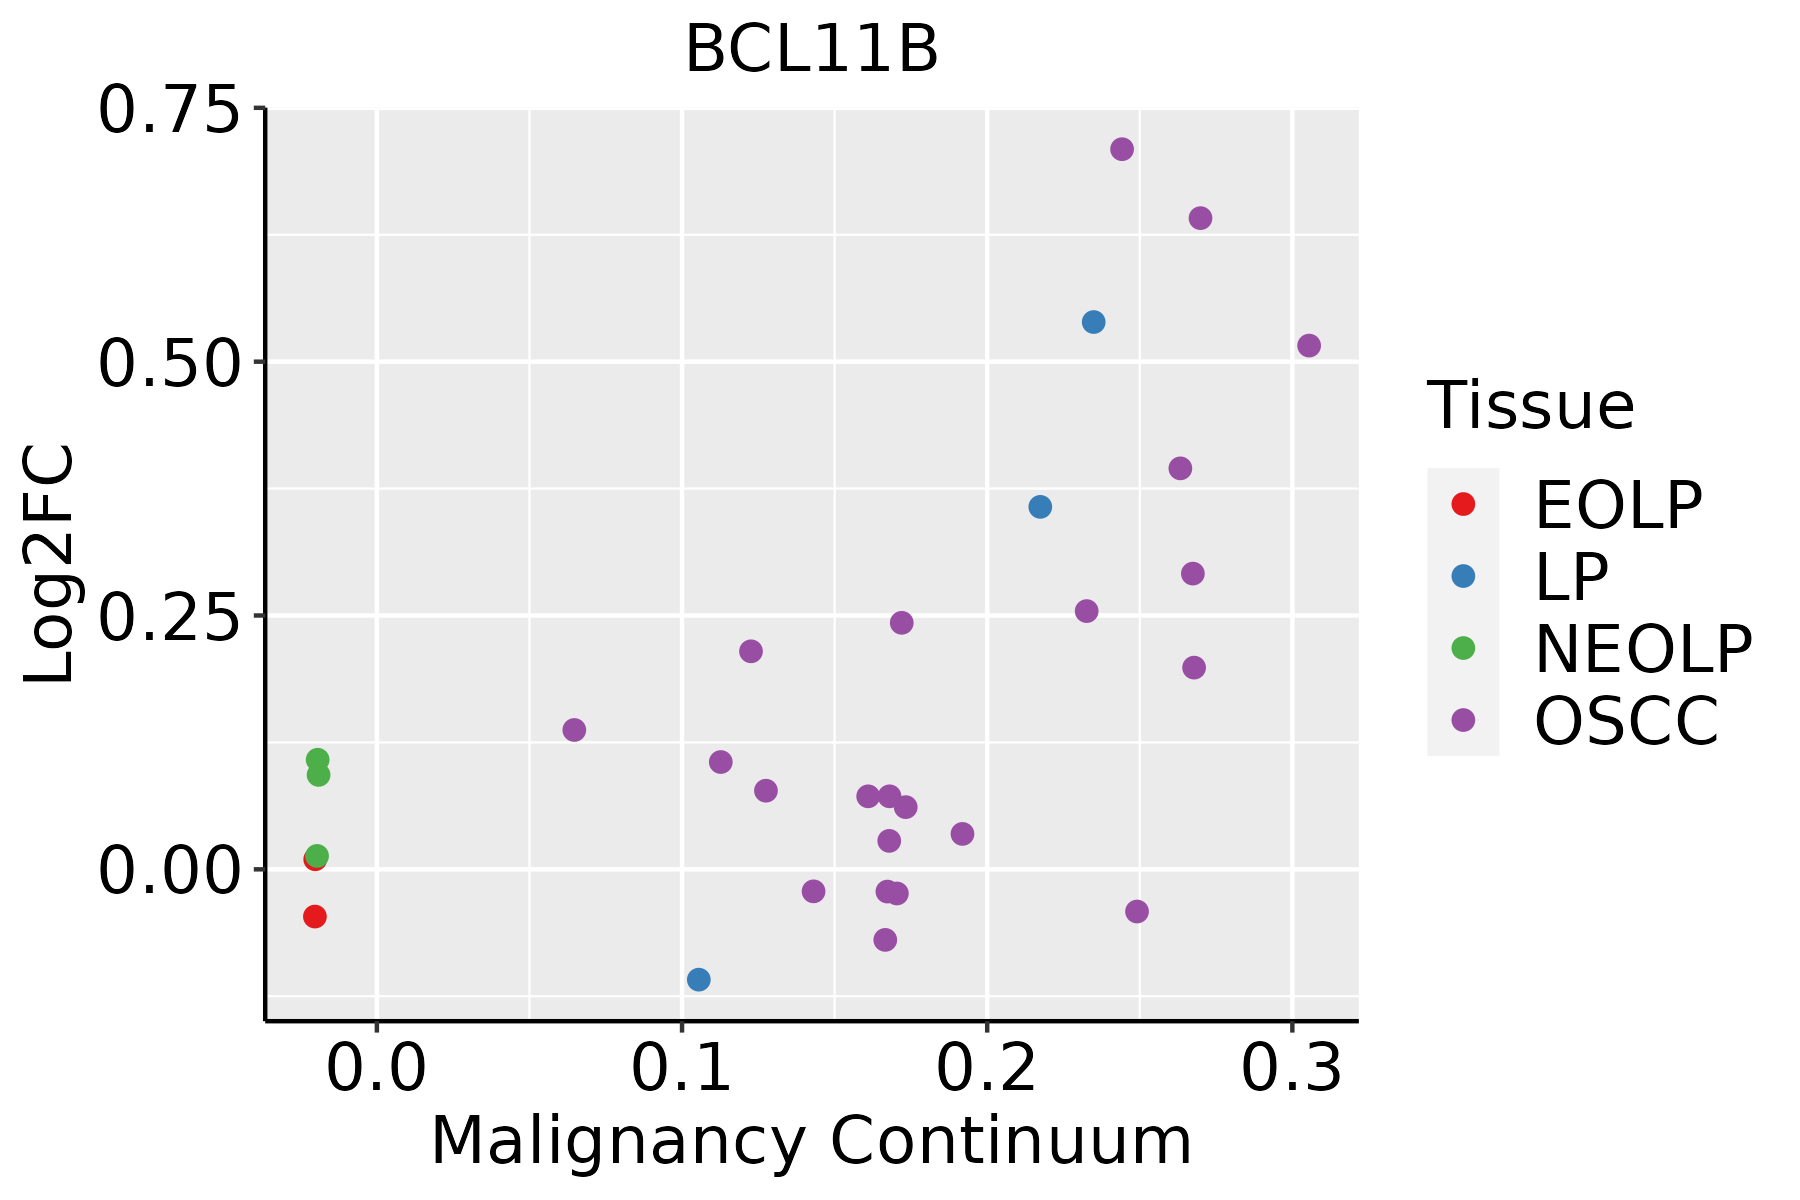 | EOLP: Erosive Oral lichen planus |
| LP: leukoplakia | ||
| NEOLP: Non-erosive oral lichen planus | ||
| OSCC: Oral squamous cell carcinoma | ||
| Skin |  | AK: Actinic keratosis |
| cSCC: Cutaneous squamous cell carcinoma | ||
| SCCIS:squamous cell carcinoma in situ |
| ∗log2FC in expression of this searched gene in stem-like cells from each diseased tissue sample relative to stem-like cells in normal samples in each tissue plotted against the malignancy continuum. Samples are colored based on if they are from different disease stage. |
Top |
Malignant transformation related pathway analysis |
| Find out the enriched GO biological processes and KEGG pathways involved in transition from healthy to precancer to cancer |
| Tissue | Disease Stage | Enriched GO biological Processes |
| Colorectum | AD |  |
| Colorectum | SER |  |
| Colorectum | MSS |  |
| Colorectum | MSI-H |  |
| Colorectum | FAP |  |
| ∗Top 15 enriched GO BP terms are showed in the bar plot of each disease state in each tissue. Each row represents a significant GO biological process which is colored according to the -log10(p.adjust). |
| Page: 1 2 3 4 5 6 7 8 9 |
| GO ID | Tissue | Disease Stage | Description | Gene Ratio | Bg Ratio | pvalue | p.adjust | Count |
| GO:0048732111 | Esophagus | ESCC | gland development | 269/8552 | 436/18723 | 7.81e-12 | 2.95e-10 | 269 |
| GO:00435888 | Esophagus | ESCC | skin development | 163/8552 | 263/18723 | 6.48e-08 | 1.14e-06 | 163 |
| GO:000854410 | Esophagus | ESCC | epidermis development | 193/8552 | 324/18723 | 2.87e-07 | 4.19e-06 | 193 |
| GO:000206420 | Esophagus | ESCC | epithelial cell development | 136/8552 | 220/18723 | 9.50e-07 | 1.21e-05 | 136 |
| GO:00097919 | Esophagus | ESCC | post-embryonic development | 56/8552 | 80/18723 | 9.08e-06 | 8.71e-05 | 56 |
| GO:000991310 | Esophagus | ESCC | epidermal cell differentiation | 122/8552 | 202/18723 | 1.69e-05 | 1.51e-04 | 122 |
| GO:00302167 | Esophagus | ESCC | keratinocyte differentiation | 86/8552 | 139/18723 | 8.53e-05 | 6.19e-04 | 86 |
| GO:005067318 | Esophagus | ESCC | epithelial cell proliferation | 238/8552 | 437/18723 | 1.19e-04 | 8.20e-04 | 238 |
| GO:00485386 | Esophagus | ESCC | thymus development | 33/8552 | 45/18723 | 1.54e-04 | 1.02e-03 | 33 |
| GO:006156415 | Esophagus | ESCC | axon development | 251/8552 | 467/18723 | 2.41e-04 | 1.49e-03 | 251 |
| GO:005067817 | Esophagus | ESCC | regulation of epithelial cell proliferation | 206/8552 | 381/18723 | 5.51e-04 | 3.02e-03 | 206 |
| GO:00063101 | Esophagus | ESCC | DNA recombination | 168/8552 | 305/18723 | 5.58e-04 | 3.05e-03 | 168 |
| GO:00025622 | Esophagus | ESCC | somatic diversification of immune receptors via germline recombination within a single locus | 43/8552 | 66/18723 | 1.10e-03 | 5.53e-03 | 43 |
| GO:00164442 | Esophagus | ESCC | somatic cell DNA recombination | 43/8552 | 66/18723 | 1.10e-03 | 5.53e-03 | 43 |
| GO:00022003 | Esophagus | ESCC | somatic diversification of immune receptors | 49/8552 | 77/18723 | 1.12e-03 | 5.60e-03 | 49 |
| GO:004211018 | Esophagus | ESCC | T cell activation | 256/8552 | 487/18723 | 1.18e-03 | 5.87e-03 | 256 |
| GO:19031317 | Esophagus | ESCC | mononuclear cell differentiation | 226/8552 | 426/18723 | 1.20e-03 | 5.88e-03 | 226 |
| GO:000740915 | Esophagus | ESCC | axonogenesis | 219/8552 | 418/18723 | 3.14e-03 | 1.31e-02 | 219 |
| GO:00436167 | Esophagus | ESCC | keratinocyte proliferation | 30/8552 | 46/18723 | 5.91e-03 | 2.18e-02 | 30 |
| GO:00485694 | Esophagus | ESCC | post-embryonic animal organ development | 12/8552 | 15/18723 | 7.31e-03 | 2.63e-02 | 12 |
| Page: 1 2 3 4 5 6 7 |
| Pathway ID | Tissue | Disease Stage | Description | Gene Ratio | Bg Ratio | pvalue | p.adjust | qvalue | Count |
| hsa052028 | Esophagus | ESCC | Transcriptional misregulation in cancer | 116/4205 | 193/8465 | 2.08e-03 | 5.95e-03 | 3.05e-03 | 116 |
| hsa0520213 | Esophagus | ESCC | Transcriptional misregulation in cancer | 116/4205 | 193/8465 | 2.08e-03 | 5.95e-03 | 3.05e-03 | 116 |
| Page: 1 |
Top |
Cell-cell communication analysis |
| Identification of potential cell-cell interactions between two cell types and their ligand-receptor pairs for different disease states |
| Ligand | Receptor | LRpair | Pathway | Tissue | Disease Stage |
| Page: 1 |
Top |
Single-cell gene regulatory network inference analysis |
| Find out the significant the regulons (TFs) and the target genes of each regulon across cell types for different disease states |
| TF | Cell Type | Tissue | Disease Stage | Target Gene | RSS | Regulon Activity |
| BCL11B | CD8TRM | Cervix | ADJ | CD2,PTPRC,RESF1, etc. | 2.92e-01 |  |
| BCL11B | CD4TN | Cervix | ADJ | CD2,PTPRC,RESF1, etc. | 3.88e-01 | |
| BCL11B | CD8TRM | Cervix | Healthy | CD2,PTPRC,RESF1, etc. | 9.54e-02 |  |
| BCL11B | CD4TN | Cervix | Healthy | CD2,PTPRC,RESF1, etc. | 1.66e-01 | |
| BCL11B | CD8TCM | Cervix | Healthy | CD2,PTPRC,RESF1, etc. | 2.28e-01 | |
| BCL11B | TFH | Cervix | Healthy | CD2,PTPRC,RESF1, etc. | 1.24e-01 | |
| BCL11B | CD8TCM | Cervix | HSIL_HPV | CD2,PTPRC,RESF1, etc. | 2.39e-01 |  |
| BCL11B | CD8TEXP | Cervix | HSIL_HPV | CD2,PTPRC,RESF1, etc. | 1.12e-01 | |
| BCL11B | TFH | Cervix | HSIL_HPV | CD2,PTPRC,RESF1, etc. | 1.46e-01 | |
| BCL11B | CD4TN | Cervix | N_HPV | CD2,PTPRC,RESF1, etc. | 2.57e-01 |  |
| ∗The dot plots of a searched regulon are shown for all cell subpopulations in each disease state of each tissue based on the regulon specific score inferred using pySCENIC and by calculating the average expression. |
| Page: 1 2 3 |
Top |
Somatic mutation of malignant transformation related genes |
| Annotation of somatic variants for genes involved in malignant transformation |
| Hugo Symbol | Variant Class | Variant Classification | dbSNP RS | HGVSc | HGVSp | HGVSp Short | SWISSPROT | BIOTYPE | SIFT | PolyPhen | Tumor Sample Barcode | Tissue | Histology | Sex | Age | Stage | Therapy Types | Drugs | Outcome |
| BCL11B | SNV | Missense_Mutation | rs748592687 | c.335N>T | p.Pro112Leu | p.P112L | Q9C0K0 | protein_coding | deleterious(0) | possibly_damaging(0.46) | TCGA-A2-A4RW-01 | Breast | breast invasive carcinoma | Female | <65 | III/IV | Unknown | Unknown | SD |
| BCL11B | SNV | Missense_Mutation | rs554329351 | c.2587T>C | p.Phe863Leu | p.F863L | Q9C0K0 | protein_coding | deleterious(0) | possibly_damaging(0.836) | TCGA-A8-A09Z-01 | Breast | breast invasive carcinoma | Female | >=65 | I/II | Unknown | Unknown | SD |
| BCL11B | SNV | Missense_Mutation | novel | c.2495N>T | p.Ala832Val | p.A832V | Q9C0K0 | protein_coding | deleterious(0) | probably_damaging(1) | TCGA-AC-A62V-01 | Breast | breast invasive carcinoma | Male | <65 | III/IV | Targeted Molecular therapy | denosumab | PD |
| BCL11B | SNV | Missense_Mutation | c.2500N>A | p.Ala834Thr | p.A834T | Q9C0K0 | protein_coding | deleterious(0.02) | probably_damaging(1) | TCGA-AN-A046-01 | Breast | breast invasive carcinoma | Female | >=65 | I/II | Unknown | Unknown | SD | |
| BCL11B | SNV | Missense_Mutation | c.2648N>A | p.Thr883Asn | p.T883N | Q9C0K0 | protein_coding | tolerated(0.43) | benign(0.05) | TCGA-D8-A1JL-01 | Breast | breast invasive carcinoma | Female | >=65 | I/II | Unknown | Unknown | SD | |
| BCL11B | SNV | Missense_Mutation | rs748264333 | c.740N>A | p.Arg247His | p.R247H | Q9C0K0 | protein_coding | deleterious(0.01) | probably_damaging(0.998) | TCGA-VS-A8EI-01 | Cervix | cervical & endocervical cancer | Female | <65 | I/II | Chemotherapy | cisplatin | CR |
| BCL11B | SNV | Missense_Mutation | rs749262405 | c.2564N>A | p.Arg855His | p.R855H | Q9C0K0 | protein_coding | deleterious(0) | possibly_damaging(0.648) | TCGA-AA-3973-01 | Colorectum | colon adenocarcinoma | Male | >=65 | III/IV | Targeted Molecular therapy | bevacizumab | SD |
| BCL11B | SNV | Missense_Mutation | c.593G>A | p.Gly198Asp | p.G198D | Q9C0K0 | protein_coding | tolerated(0.12) | benign(0.247) | TCGA-CK-5913-01 | Colorectum | colon adenocarcinoma | Female | <65 | I/II | Unknown | Unknown | SD | |
| BCL11B | SNV | Missense_Mutation | c.2386G>A | p.Asp796Asn | p.D796N | Q9C0K0 | protein_coding | deleterious(0) | probably_damaging(1) | TCGA-CK-6746-01 | Colorectum | colon adenocarcinoma | Female | >=65 | I/II | Unknown | Unknown | SD | |
| BCL11B | SNV | Missense_Mutation | c.2501N>T | p.Ala834Val | p.A834V | Q9C0K0 | protein_coding | deleterious(0) | probably_damaging(1) | TCGA-CM-4743-01 | Colorectum | colon adenocarcinoma | Male | >=65 | I/II | Chemotherapy | capecitabine | SD |
| Page: 1 2 3 4 5 6 7 8 9 |
Top |
Related drugs of malignant transformation related genes |
| Identification of chemicals and drugs interact with genes involved in malignant transfromation |
| (DGIdb 4.0) |
| Entrez ID | Symbol | Category | Interaction Types | Drug Claim Name | Drug Name | PMIDs |
| Page: 1 |

Copyright 2023-Present -The University of Texas Health Science Center at Houston |