
|
|||||
|
 | |
| |
| |
| |
| |
| |
|
Gene: BCL11A |
Gene summary for BCL11A |
| Gene information | Species | Human | Gene symbol | BCL11A | Gene ID | 53335 |
| Gene name | BAF chromatin remodeling complex subunit BCL11A | |
| Gene Alias | BCL11A-L | |
| Cytomap | 2p16.1 | |
| Gene Type | protein-coding | GO ID | GO:0000122 | UniProtAcc | D9YZV9 |
Top |
Malignant transformation analysis |
| Identification of the aberrant gene expression in precancerous and cancerous lesions by comparing the gene expression of stem-like cells in diseased tissues with normal stem cells |
| Entrez ID | Symbol | Replicates | Species | Organ | Tissue | Adj P-value | Log2FC | Malignancy |
| 53335 | BCL11A | CA_HPV_1 | Human | Cervix | CC | 2.49e-07 | 3.83e-01 | 0.0264 |
| 53335 | BCL11A | CA_HPV_3 | Human | Cervix | CC | 1.12e-13 | 2.93e-01 | 0.0414 |
| 53335 | BCL11A | N_HPV_2 | Human | Cervix | N_HPV | 2.86e-02 | 7.32e-02 | -0.0131 |
| 53335 | BCL11A | CCI_2 | Human | Cervix | CC | 1.60e-10 | 1.56e+00 | 0.5249 |
| 53335 | BCL11A | CCI_3 | Human | Cervix | CC | 6.44e-11 | 1.03e+00 | 0.516 |
| 53335 | BCL11A | HTA11_3410_2000001011 | Human | Colorectum | AD | 6.44e-12 | -4.47e-01 | 0.0155 |
| 53335 | BCL11A | HTA11_2487_2000001011 | Human | Colorectum | SER | 1.09e-03 | -4.47e-01 | -0.1808 |
| 53335 | BCL11A | HTA11_3361_2000001011 | Human | Colorectum | AD | 7.90e-04 | -5.37e-01 | -0.1207 |
| 53335 | BCL11A | HTA11_696_2000001011 | Human | Colorectum | AD | 4.44e-08 | -4.33e-01 | -0.1464 |
| 53335 | BCL11A | HTA11_866_2000001011 | Human | Colorectum | AD | 2.64e-02 | -3.41e-01 | -0.1001 |
| 53335 | BCL11A | HTA11_5212_2000001011 | Human | Colorectum | AD | 3.98e-03 | -6.72e-01 | -0.2061 |
| 53335 | BCL11A | A001-C-207 | Human | Colorectum | FAP | 4.33e-02 | -1.64e-01 | 0.1278 |
| 53335 | BCL11A | A015-C-203 | Human | Colorectum | FAP | 4.35e-23 | -3.29e-01 | -0.1294 |
| 53335 | BCL11A | A015-C-204 | Human | Colorectum | FAP | 5.94e-04 | -1.71e-01 | -0.0228 |
| 53335 | BCL11A | A014-C-040 | Human | Colorectum | FAP | 6.11e-04 | -4.20e-01 | -0.1184 |
| 53335 | BCL11A | A002-C-201 | Human | Colorectum | FAP | 2.38e-14 | -4.11e-01 | 0.0324 |
| 53335 | BCL11A | A001-C-119 | Human | Colorectum | FAP | 3.29e-12 | -5.95e-01 | -0.1557 |
| 53335 | BCL11A | A001-C-108 | Human | Colorectum | FAP | 1.60e-21 | -4.22e-01 | -0.0272 |
| 53335 | BCL11A | A002-C-205 | Human | Colorectum | FAP | 7.55e-30 | -6.79e-01 | -0.1236 |
| 53335 | BCL11A | A001-C-104 | Human | Colorectum | FAP | 1.88e-03 | -2.37e-01 | 0.0184 |
| Page: 1 2 3 4 5 6 7 |
| Tissue | Expression Dynamics | Abbreviation |
| Cervix | 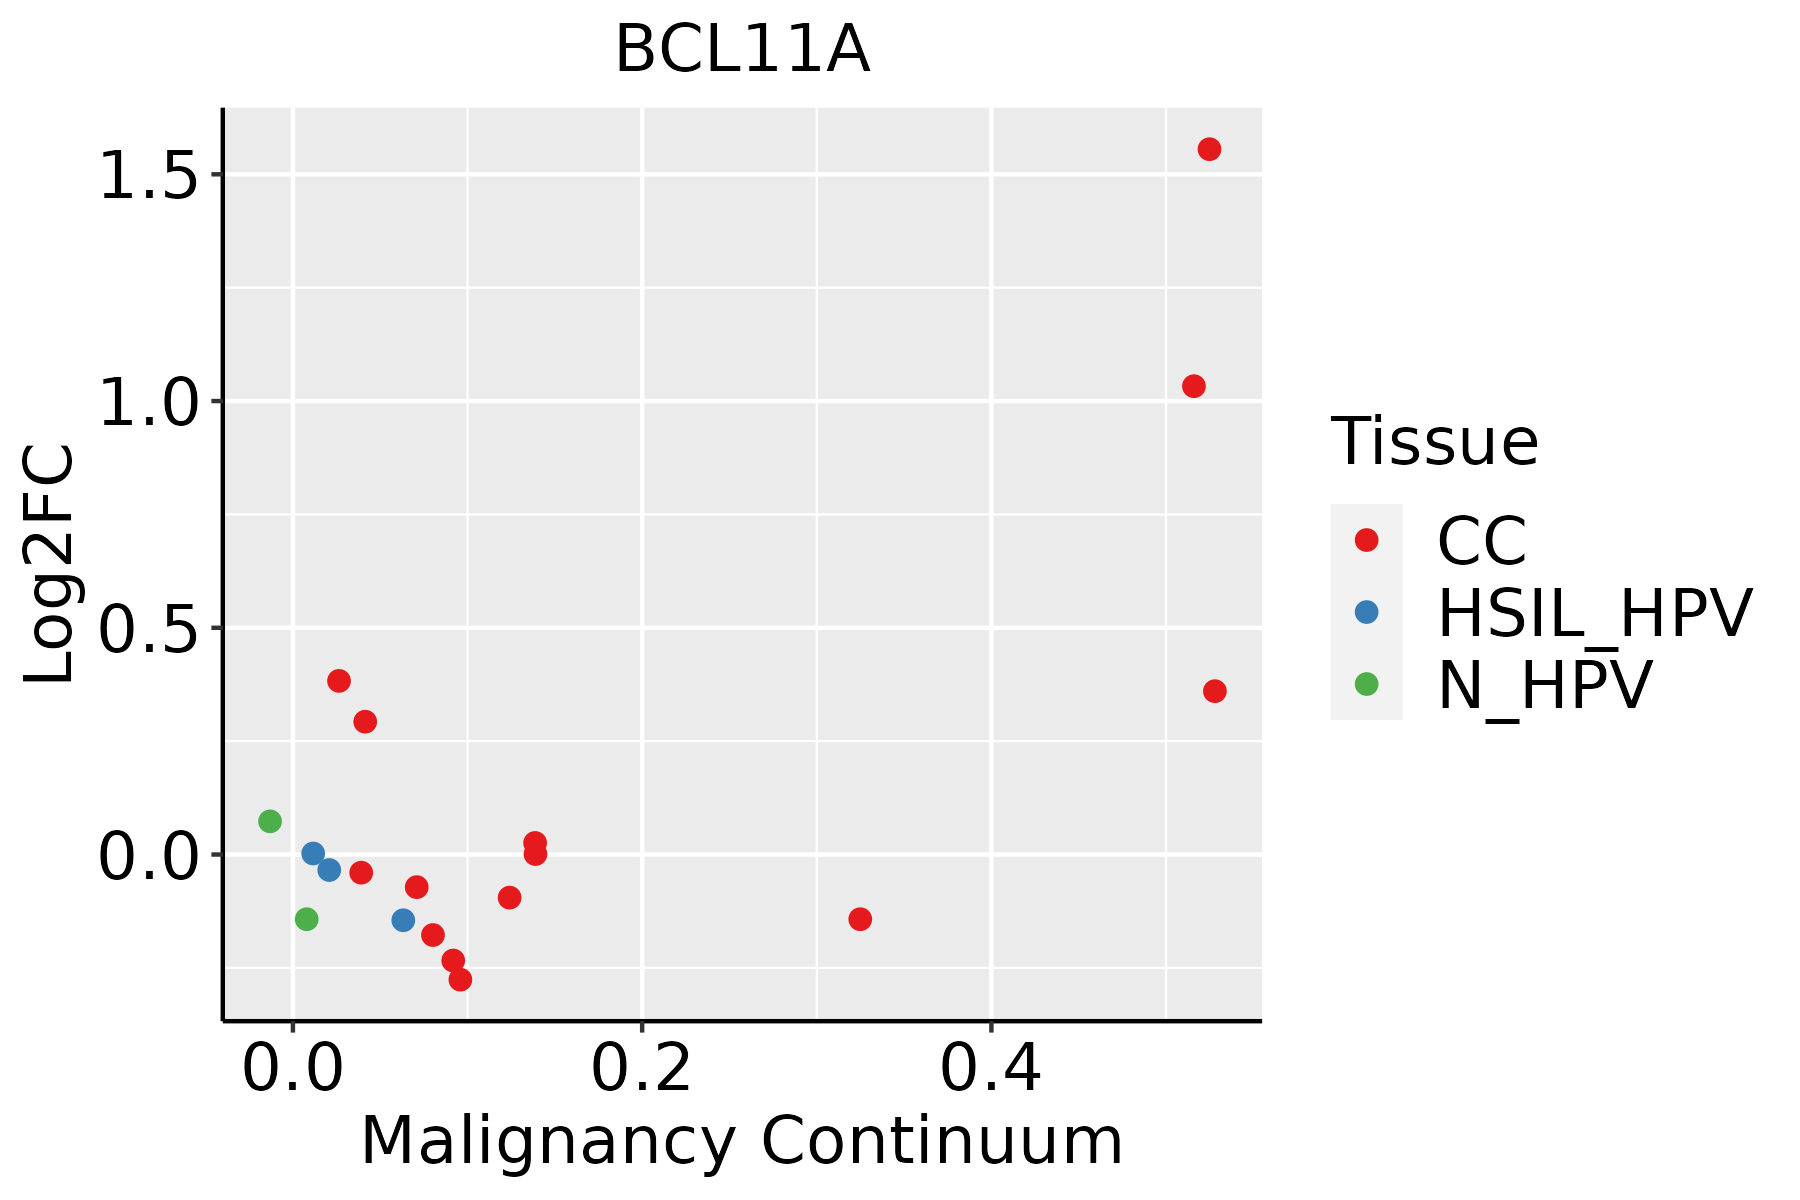 | CC: Cervix cancer |
| HSIL_HPV: HPV-infected high-grade squamous intraepithelial lesions | ||
| N_HPV: HPV-infected normal cervix | ||
| Colorectum (GSE201348) |  | FAP: Familial adenomatous polyposis |
| CRC: Colorectal cancer | ||
| Colorectum (HTA11) |  | AD: Adenomas |
| SER: Sessile serrated lesions | ||
| MSI-H: Microsatellite-high colorectal cancer | ||
| MSS: Microsatellite stable colorectal cancer | ||
| Esophagus | 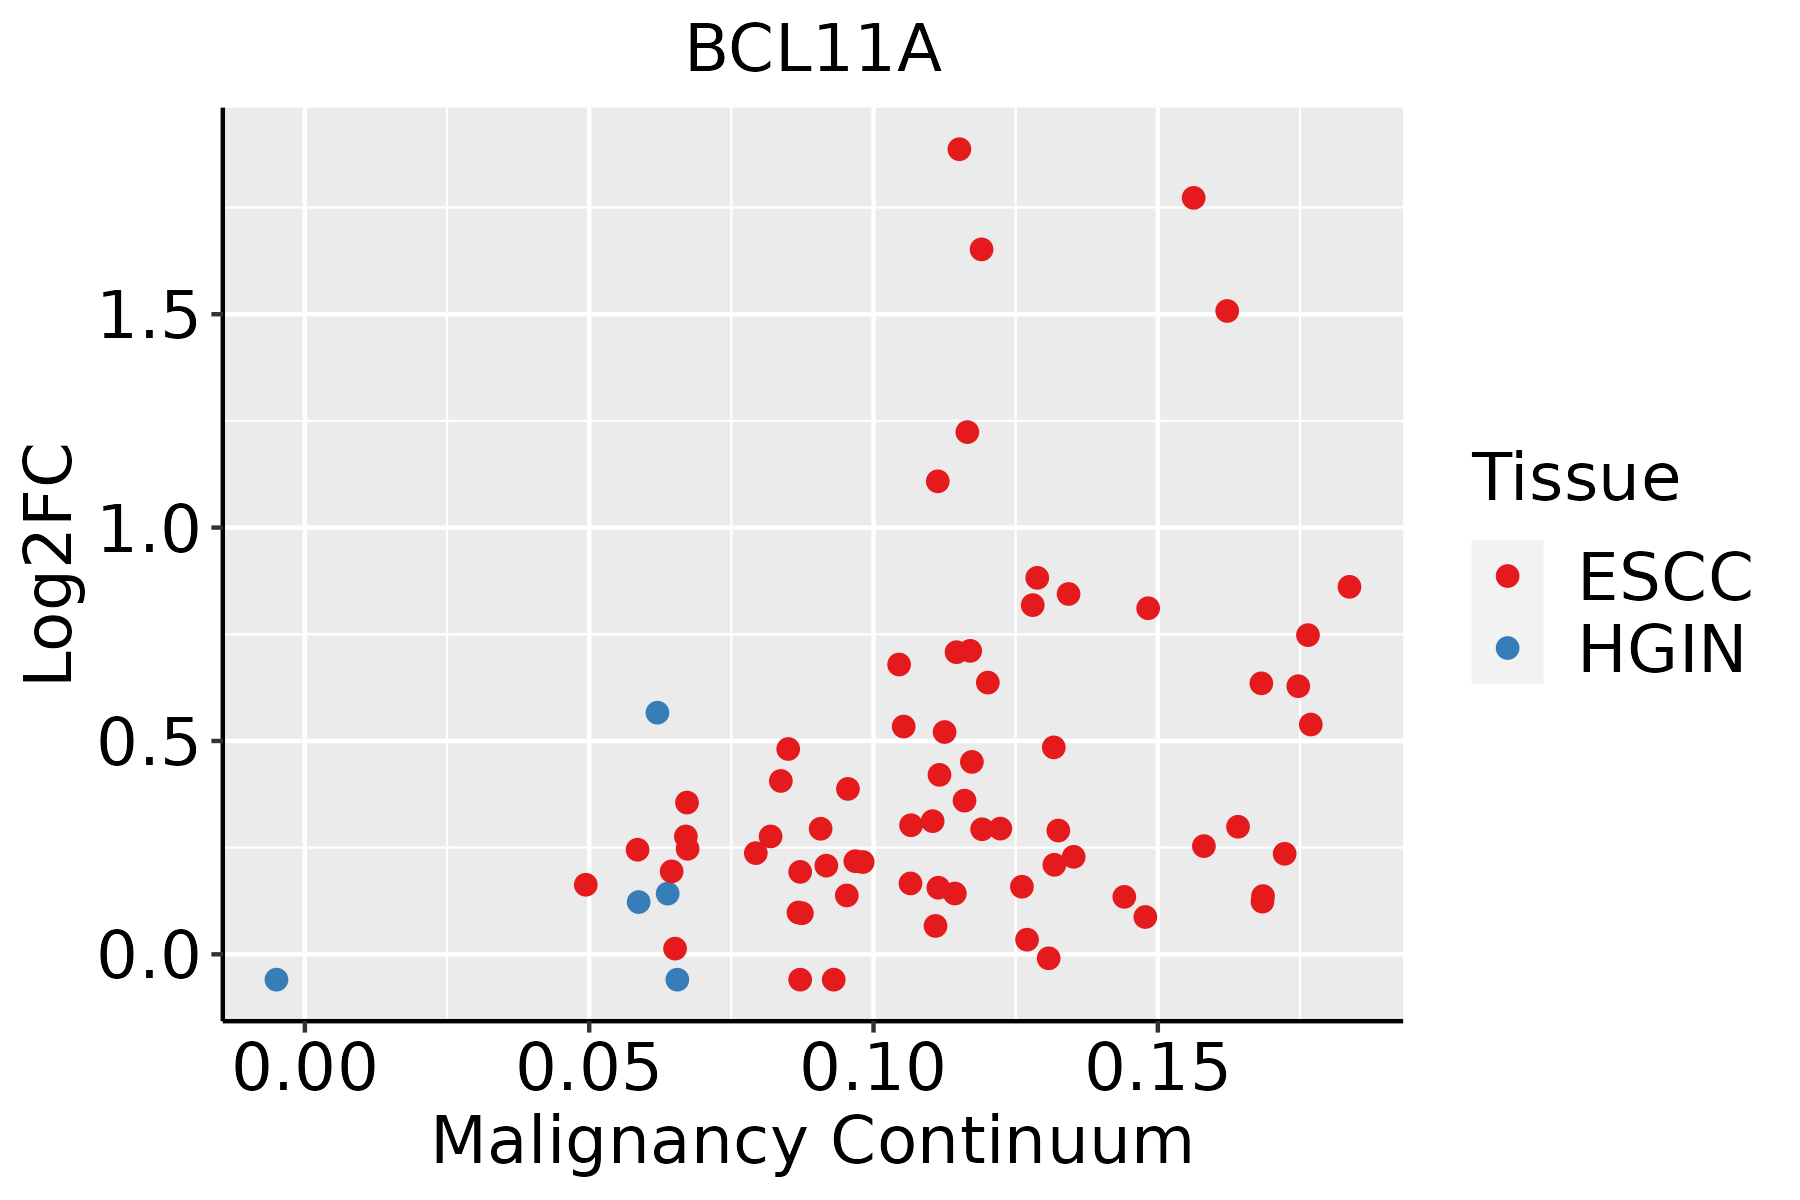 | ESCC: Esophageal squamous cell carcinoma |
| HGIN: High-grade intraepithelial neoplasias | ||
| LGIN: Low-grade intraepithelial neoplasias | ||
| Lung |  | AAH: Atypical adenomatous hyperplasia |
| AIS: Adenocarcinoma in situ | ||
| IAC: Invasive lung adenocarcinoma | ||
| MIA: Minimally invasive adenocarcinoma | ||
| Oral Cavity | 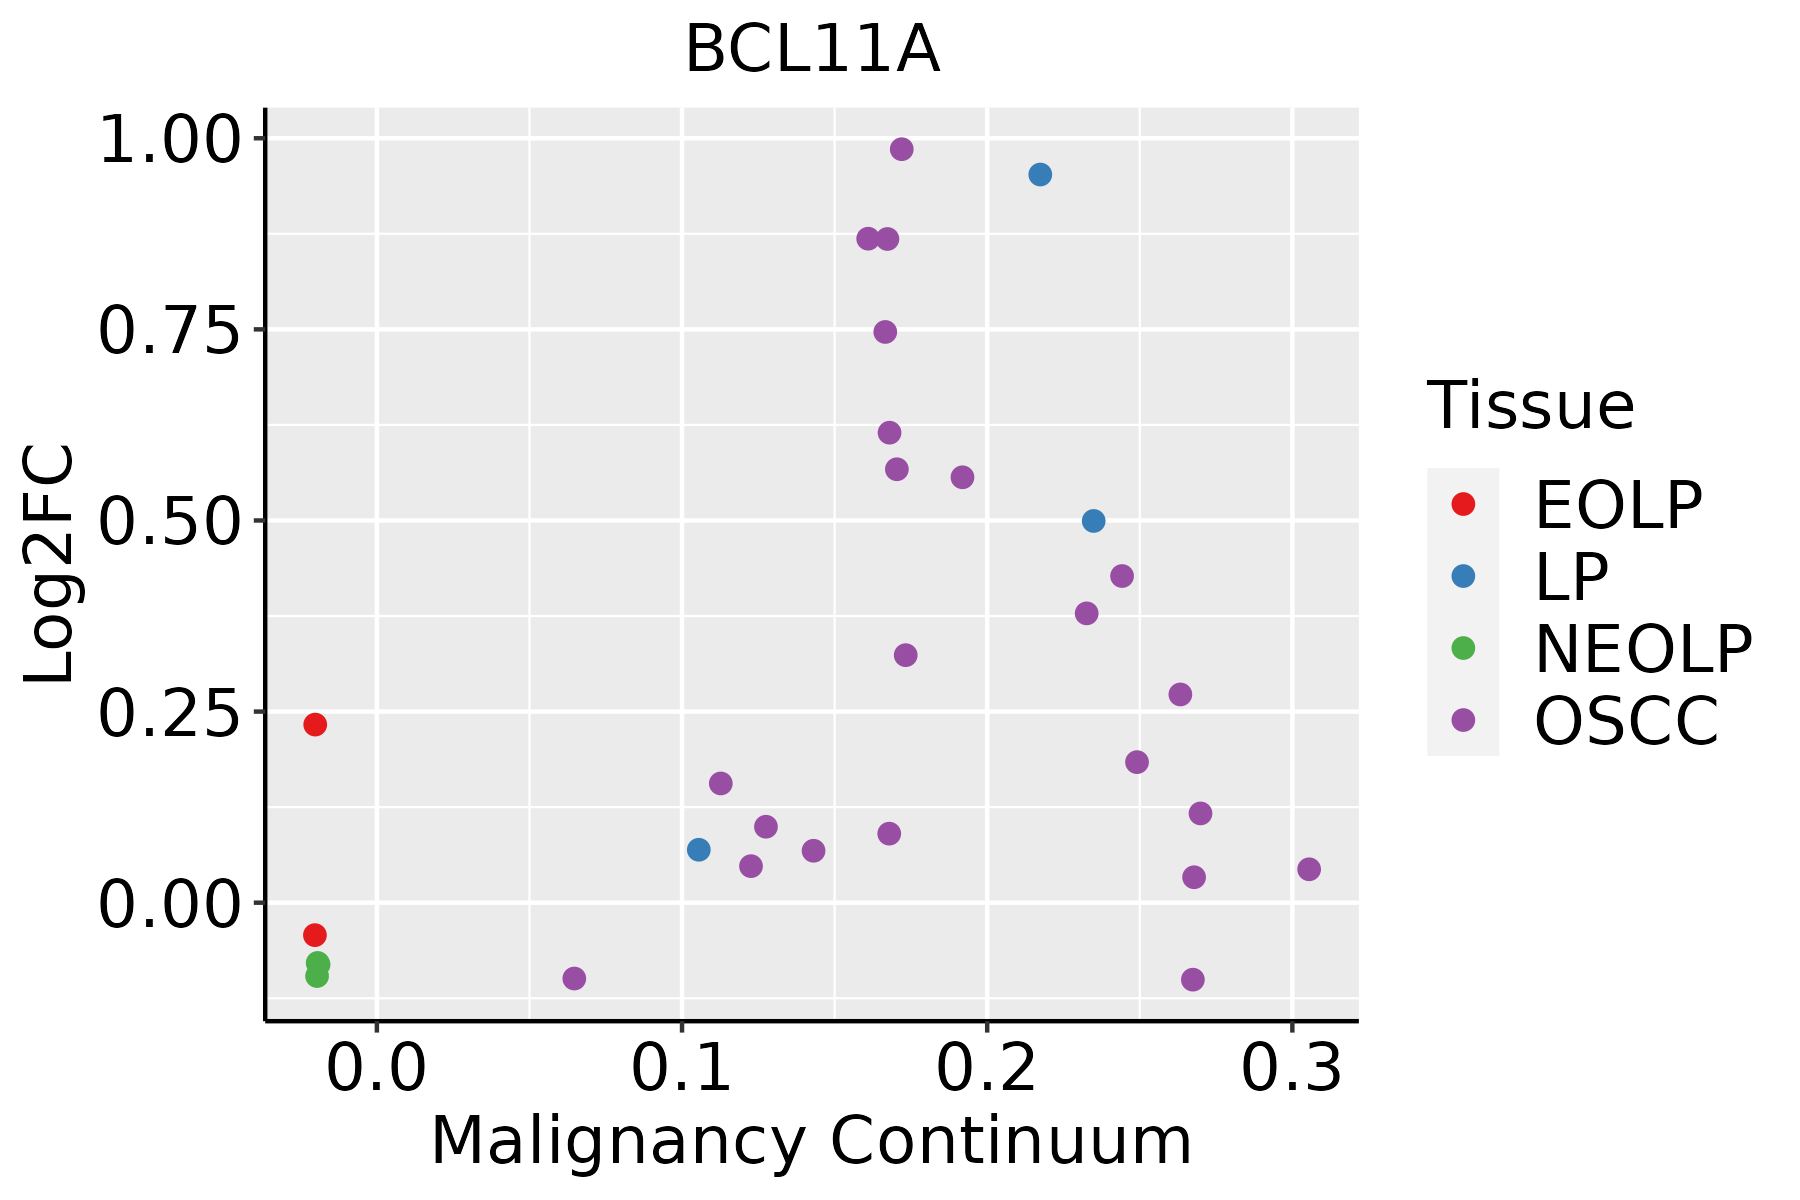 | EOLP: Erosive Oral lichen planus |
| LP: leukoplakia | ||
| NEOLP: Non-erosive oral lichen planus | ||
| OSCC: Oral squamous cell carcinoma | ||
| Skin |  | AK: Actinic keratosis |
| cSCC: Cutaneous squamous cell carcinoma | ||
| SCCIS:squamous cell carcinoma in situ |
| ∗log2FC in expression of this searched gene in stem-like cells from each diseased tissue sample relative to stem-like cells in normal samples in each tissue plotted against the malignancy continuum. Samples are colored based on if they are from different disease stage. |
Top |
Malignant transformation related pathway analysis |
| Find out the enriched GO biological processes and KEGG pathways involved in transition from healthy to precancer to cancer |
| Tissue | Disease Stage | Enriched GO biological Processes |
| Colorectum | AD |  |
| Colorectum | SER |  |
| Colorectum | MSS |  |
| Colorectum | MSI-H |  |
| Colorectum | FAP |  |
| ∗Top 15 enriched GO BP terms are showed in the bar plot of each disease state in each tissue. Each row represents a significant GO biological process which is colored according to the -log10(p.adjust). |
| Page: 1 2 3 4 5 6 7 8 9 |
| GO ID | Tissue | Disease Stage | Description | Gene Ratio | Bg Ratio | pvalue | p.adjust | Count |
| GO:002260410 | Cervix | CC | regulation of cell morphogenesis | 84/2311 | 309/18723 | 1.00e-12 | 4.29e-10 | 84 |
| GO:00163587 | Cervix | CC | dendrite development | 58/2311 | 243/18723 | 4.52e-07 | 1.76e-05 | 58 |
| GO:00109757 | Cervix | CC | regulation of neuron projection development | 88/2311 | 445/18723 | 4.26e-06 | 1.09e-04 | 88 |
| GO:00160498 | Cervix | CC | cell growth | 92/2311 | 482/18723 | 1.16e-05 | 2.49e-04 | 92 |
| GO:00015588 | Cervix | CC | regulation of cell growth | 77/2311 | 414/18723 | 1.40e-04 | 1.70e-03 | 77 |
| GO:00011016 | Cervix | CC | response to acid chemical | 31/2311 | 135/18723 | 4.16e-04 | 4.22e-03 | 31 |
| GO:00313456 | Cervix | CC | negative regulation of cell projection organization | 39/2311 | 186/18723 | 5.86e-04 | 5.57e-03 | 39 |
| GO:00486386 | Cervix | CC | regulation of developmental growth | 61/2311 | 330/18723 | 7.69e-04 | 6.85e-03 | 61 |
| GO:00605606 | Cervix | CC | developmental growth involved in morphogenesis | 46/2311 | 234/18723 | 8.82e-04 | 7.63e-03 | 46 |
| GO:00712292 | Cervix | CC | cellular response to acid chemical | 20/2311 | 80/18723 | 1.40e-03 | 1.10e-02 | 20 |
| GO:00712301 | Cervix | CC | cellular response to amino acid stimulus | 18/2311 | 71/18723 | 2.01e-03 | 1.47e-02 | 18 |
| GO:19901385 | Cervix | CC | neuron projection extension | 34/2311 | 172/18723 | 3.52e-03 | 2.27e-02 | 34 |
| GO:00432004 | Cervix | CC | response to amino acid | 25/2311 | 116/18723 | 3.59e-03 | 2.30e-02 | 25 |
| GO:00487552 | Cervix | CC | branching morphogenesis of a nerve | 5/2311 | 10/18723 | 4.20e-03 | 2.58e-02 | 5 |
| GO:00109775 | Cervix | CC | negative regulation of neuron projection development | 28/2311 | 137/18723 | 4.74e-03 | 2.83e-02 | 28 |
| GO:00017636 | Cervix | CC | morphogenesis of a branching structure | 37/2311 | 196/18723 | 5.36e-03 | 3.10e-02 | 37 |
| GO:00507733 | Cervix | CC | regulation of dendrite development | 22/2311 | 103/18723 | 6.75e-03 | 3.71e-02 | 22 |
| GO:00485886 | Cervix | CC | developmental cell growth | 42/2311 | 234/18723 | 7.88e-03 | 4.15e-02 | 42 |
| GO:00182054 | Cervix | CC | peptidyl-lysine modification | 62/2311 | 376/18723 | 1.04e-02 | 4.97e-02 | 62 |
| GO:002260424 | Cervix | N_HPV | regulation of cell morphogenesis | 20/534 | 309/18723 | 5.98e-04 | 7.85e-03 | 20 |
| Page: 1 2 3 4 5 6 7 8 9 |
| Pathway ID | Tissue | Disease Stage | Description | Gene Ratio | Bg Ratio | pvalue | p.adjust | qvalue | Count |
| Page: 1 |
Top |
Cell-cell communication analysis |
| Identification of potential cell-cell interactions between two cell types and their ligand-receptor pairs for different disease states |
| Ligand | Receptor | LRpair | Pathway | Tissue | Disease Stage |
| Page: 1 |
Top |
Single-cell gene regulatory network inference analysis |
| Find out the significant the regulons (TFs) and the target genes of each regulon across cell types for different disease states |
| TF | Cell Type | Tissue | Disease Stage | Target Gene | RSS | Regulon Activity |
| BCL11A | BMEM | Colorectum | ADJ | BANK1,EBF1,BLK, etc. | 2.72e-01 |  |
| BCL11A | BMEM | Colorectum | FAP | BANK1,EBF1,BLK, etc. | 2.24e-01 |  |
| BCL11A | BMEM | Colorectum | Healthy | BANK1,EBF1,BLK, etc. | 1.89e-01 |  |
| BCL11A | BMEM | Colorectum | MSI-H | BANK1,EBF1,BLK, etc. | 2.06e-01 |  |
| BCL11A | MYOFIB | Colorectum | ADJ | HDAC4,NRP2,LIMS2, etc. | 3.25e-01 | |
| BCL11A | MYOFIB | Colorectum | FAP | HDAC4,NRP2,LIMS2, etc. | 2.78e-01 | |
| BCL11A | MYOFIB | Colorectum | Healthy | HDAC4,NRP2,LIMS2, etc. | 7.08e-01 | |
| BCL11A | MYOFIB | Colorectum | MSI-H | HDAC4,NRP2,LIMS2, etc. | 3.76e-01 | |
| BCL11A | MVA | Endometrium | ADJ | SHOC1,PAPLN,KCNC2, etc. | 1.68e-02 |  |
| BCL11A | LYMEND | Endometrium | EEC | SHOC1,PAPLN,KCNC2, etc. | 2.64e-02 |  |
| ∗The dot plots of a searched regulon are shown for all cell subpopulations in each disease state of each tissue based on the regulon specific score inferred using pySCENIC and by calculating the average expression. |
| Page: 1 2 3 |
Top |
Somatic mutation of malignant transformation related genes |
| Annotation of somatic variants for genes involved in malignant transformation |
| Hugo Symbol | Variant Class | Variant Classification | dbSNP RS | HGVSc | HGVSp | HGVSp Short | SWISSPROT | BIOTYPE | SIFT | PolyPhen | Tumor Sample Barcode | Tissue | Histology | Sex | Age | Stage | Therapy Types | Drugs | Outcome |
| BCL11A | SNV | Missense_Mutation | c.2431G>A | p.Val811Met | p.V811M | Q9H165 | protein_coding | deleterious(0) | probably_damaging(1) | TCGA-AR-A1AS-01 | Breast | breast invasive carcinoma | Female | <65 | I/II | Chemotherapy | doxorubicin | SD | |
| BCL11A | SNV | Missense_Mutation | novel | c.2029G>A | p.Gly677Arg | p.G677R | Q9H165 | protein_coding | deleterious(0.01) | possibly_damaging(0.827) | TCGA-E2-A14P-01 | Breast | breast invasive carcinoma | Female | >=65 | III/IV | Targeted Molecular therapy | trastuzumab | SD |
| BCL11A | SNV | Missense_Mutation | rs371309905 | c.1417N>A | p.Glu473Lys | p.E473K | Q9H165 | protein_coding | deleterious(0.01) | possibly_damaging(0.652) | TCGA-E2-A14Z-01 | Breast | breast invasive carcinoma | Female | <65 | I/II | Hormone Therapy | arimidex | PD |
| BCL11A | insertion | Nonsense_Mutation | novel | c.526_527insTACCATTAAATAATGCATAATGCA | p.Cys175_Lys176insIleProLeuAsnAsnAlaTerCys | p.C175_K176insIPLNNA*C | Q9H165 | protein_coding | TCGA-A8-A092-01 | Breast | breast invasive carcinoma | Female | <65 | III/IV | Chemotherapy | paclitaxel | CR | ||
| BCL11A | insertion | Frame_Shift_Ins | novel | c.58_59insGTGGTAAAGAAAAGAGGTT | p.Glu20GlyfsTer10 | p.E20Gfs*10 | Q9H165 | protein_coding | TCGA-AN-A041-01 | Breast | breast invasive carcinoma | Female | <65 | I/II | Unknown | Unknown | SD | ||
| BCL11A | insertion | In_Frame_Ins | novel | c.1152_1153insTCAATGTTTTCTGAA | p.Lys384_Thr385insSerMetPheSerGlu | p.K384_T385insSMFSE | Q9H165 | protein_coding | TCGA-AO-A03T-01 | Breast | breast invasive carcinoma | Female | <65 | I/II | Chemotherapy | cyclophosphamide | SD | ||
| BCL11A | insertion | Frame_Shift_Ins | novel | c.1150_1151insTCTTTCTAAAGTATAAAGAA | p.Lys384IlefsTer44 | p.K384Ifs*44 | Q9H165 | protein_coding | TCGA-AO-A03T-01 | Breast | breast invasive carcinoma | Female | <65 | I/II | Chemotherapy | cyclophosphamide | SD | ||
| BCL11A | insertion | In_Frame_Ins | novel | c.1137_1138insCTCCTCGTCGGAGCACTCCTCGGA | p.Cys379_Glu380insLeuLeuValGlyAlaLeuLeuGly | p.C379_E380insLLVGALLG | Q9H165 | protein_coding | TCGA-AO-A0J9-01 | Breast | breast invasive carcinoma | Female | <65 | III/IV | Chemotherapy | cyclophosphamide | PD | ||
| BCL11A | insertion | Nonsense_Mutation | novel | c.348_349insATATGCAGCTAGTCTGGGGAATTGTATAAACTTAGATAGCCCAG | p.Ser117IlefsTer4 | p.S117Ifs*4 | Q9H165 | protein_coding | TCGA-B6-A0I8-01 | Breast | breast invasive carcinoma | Female | <65 | I/II | Unknown | Unknown | PD | ||
| BCL11A | insertion | Frame_Shift_Ins | novel | c.296_297insCGATTTTGGATTTCTTTTC | p.Glu100AspfsTer17 | p.E100Dfs*17 | Q9H165 | protein_coding | TCGA-BH-A0HO-01 | Breast | breast invasive carcinoma | Female | <65 | I/II | Chemotherapy | cyclophosphamide | SD |
| Page: 1 2 3 4 5 6 7 8 9 10 11 12 13 14 15 16 |
Top |
Related drugs of malignant transformation related genes |
| Identification of chemicals and drugs interact with genes involved in malignant transfromation |
| (DGIdb 4.0) |
| Entrez ID | Symbol | Category | Interaction Types | Drug Claim Name | Drug Name | PMIDs |
| Page: 1 |

Copyright 2023-Present -The University of Texas Health Science Center at Houston |