Schematic overview of the cellular and molecular mechanisms involved in the cancer progression, including the proposed cellular and molecular mechanisms in cancer cells trajectory. AT1: alveolar type 1 cells; AT2: alveolar type 2 cells; AAH: atypical adenomatous hyperplasia; AIS: adenocarcinoma in situ; MIA: minimally invasive adenocarcinoma; IA: invasive adenocarcinoma; EMT: epithelial-mesenchymal transition

Home

Download

Statistics

Help

Contact

Center for Computational Systems Medicine
leaf

Gene summary

leaf

Malignant transformation analysis

leaf

Malignant transformation related pathway analysis

leaf

Cell-cell communication analysis

leaf

Single-cell gene regulatory network inference analysis

leaf

Somatic mutation of malignant transformation related genes

leaf

Related drugs of malignant transformation related genes

Gene: BCKDK

Gene summary for BCKDK

check button Gene summary.

Gene informationSpeciesHuman
Gene symbol

BCKDK

Gene ID

10295

Gene namebranched chain keto acid dehydrogenase kinase
Gene AliasBCKDKD
Cytomap16p11.2
Gene Typeprotein-coding
GO ID

GO:0000003

UniProtAcc

O14874


Top

Malignant transformation analysis

check button Identification of the aberrant gene expression in precancerous and cancerous lesions by comparing the gene expression of stem-like cells in diseased tissues with normal stem cells
check button Malignant transformation involving gene list.
Entrez IDSymbolReplicatesSpeciesOrganTissueAdj P-valueLog2FCMalignancy
10295BCKDKLZE2THumanEsophagusESCC3.82e-064.86e-010.082
10295BCKDKLZE4THumanEsophagusESCC8.01e-103.13e-010.0811
10295BCKDKLZE7THumanEsophagusESCC1.94e-084.30e-010.0667
10295BCKDKLZE8THumanEsophagusESCC1.18e-092.31e-010.067
10295BCKDKLZE20THumanEsophagusESCC7.60e-102.05e-010.0662
10295BCKDKLZE22THumanEsophagusESCC7.85e-053.13e-010.068
10295BCKDKLZE24THumanEsophagusESCC1.74e-331.06e+000.0596
10295BCKDKLZE6THumanEsophagusESCC1.21e-085.74e-010.0845
10295BCKDKP1T-EHumanEsophagusESCC2.07e-114.79e-010.0875
10295BCKDKP2T-EHumanEsophagusESCC1.09e-681.10e+000.1177
10295BCKDKP4T-EHumanEsophagusESCC1.14e-287.53e-010.1323
10295BCKDKP5T-EHumanEsophagusESCC2.16e-265.43e-010.1327
10295BCKDKP8T-EHumanEsophagusESCC2.54e-294.88e-010.0889
10295BCKDKP9T-EHumanEsophagusESCC6.37e-132.56e-010.1131
10295BCKDKP10T-EHumanEsophagusESCC4.47e-111.32e-010.116
10295BCKDKP11T-EHumanEsophagusESCC6.24e-257.60e-010.1426
10295BCKDKP12T-EHumanEsophagusESCC6.39e-377.22e-010.1122
10295BCKDKP15T-EHumanEsophagusESCC1.83e-184.18e-010.1149
10295BCKDKP16T-EHumanEsophagusESCC1.28e-326.43e-010.1153
10295BCKDKP17T-EHumanEsophagusESCC4.79e-177.78e-010.1278
Page: 1 2 3 4 5 6 

check button Transcriptomic changes along malignancy continuum.
TissueExpression DynamicsAbbreviation
EsophagusThe image shows the transcriptomic changes along malignancy continuum.log2FC in expression of this searched gene in stem-like cells from each diseased tissue sample relative to stem-like cells in normal samples in each tissue plotted against the malignancy continuum. Samples are colored based on if they are from different disease stage.
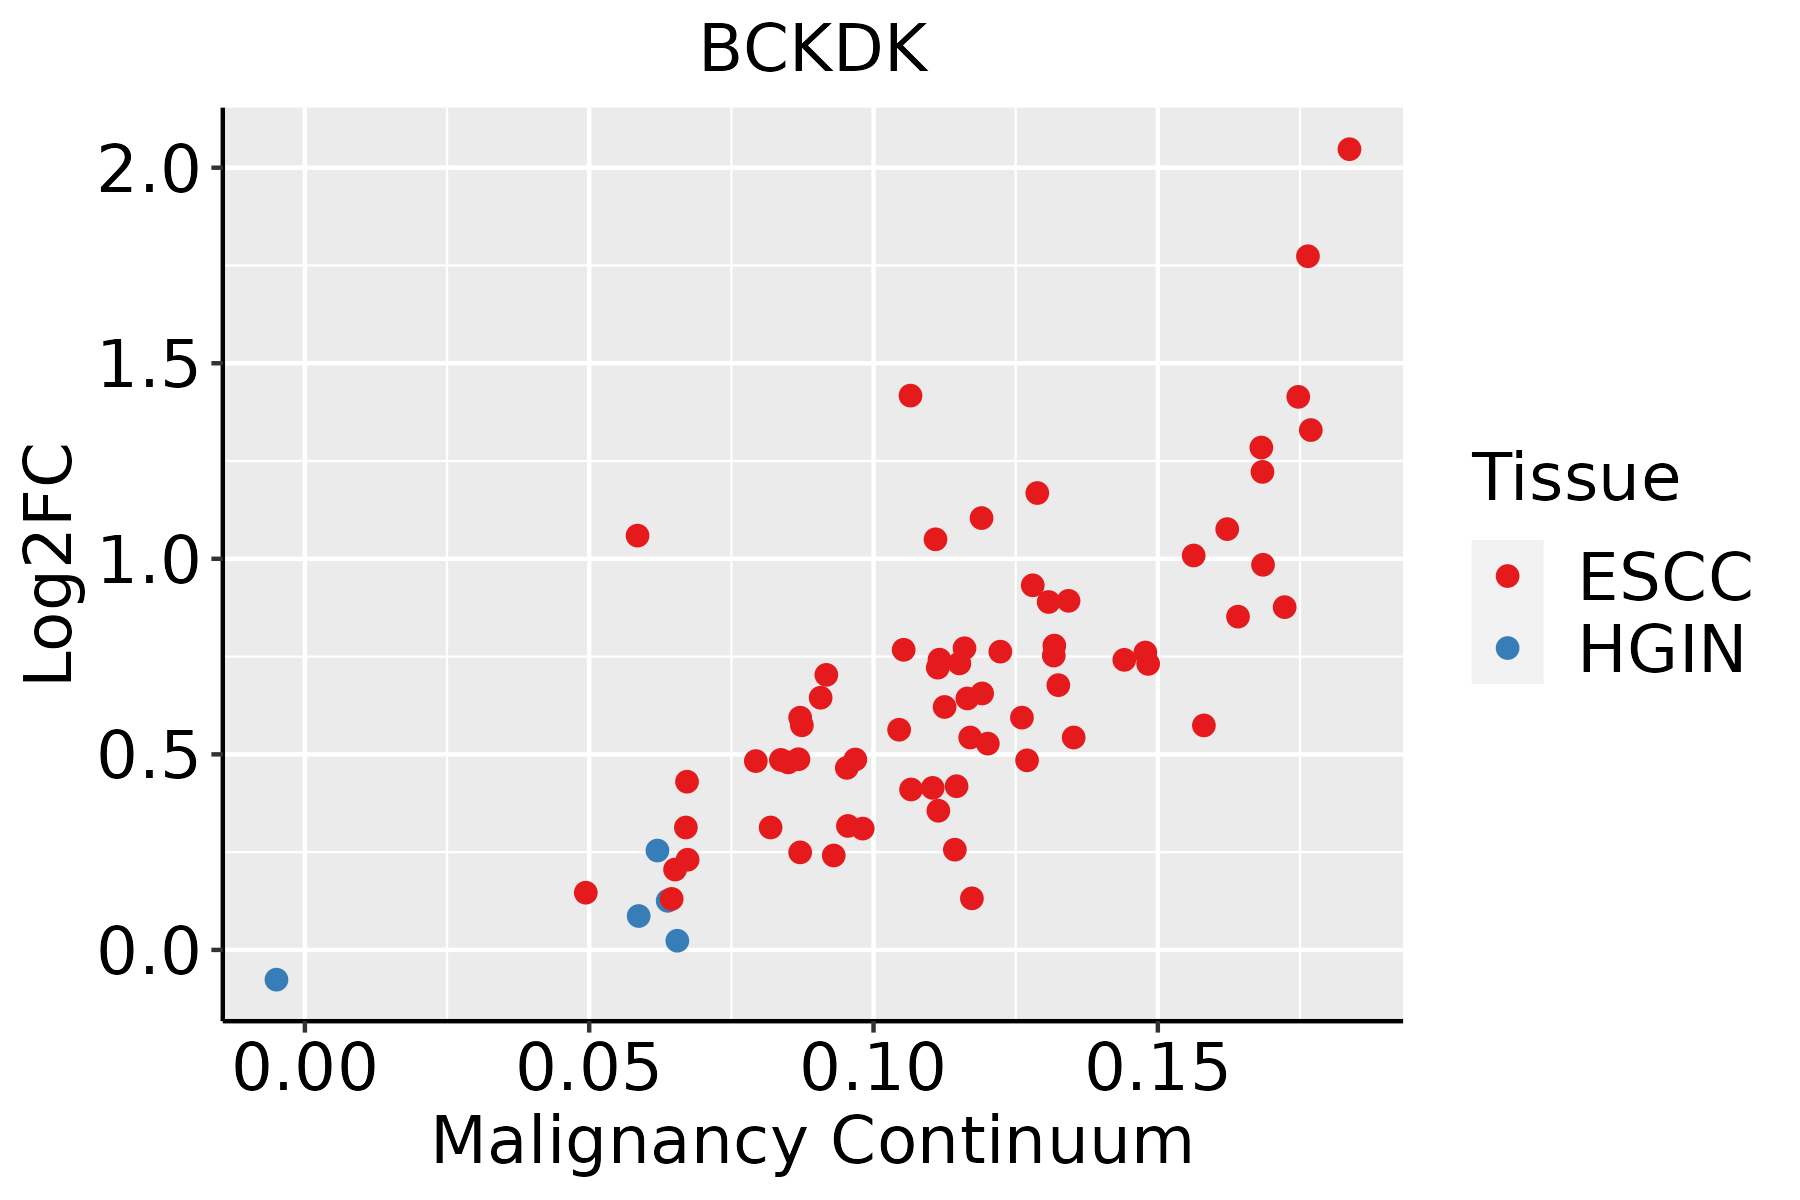
ESCC: Esophageal squamous cell carcinoma
HGIN: High-grade intraepithelial neoplasias
LGIN: Low-grade intraepithelial neoplasias
LiverThe image shows the transcriptomic changes along malignancy continuum.log2FC in expression of this searched gene in stem-like cells from each diseased tissue sample relative to stem-like cells in normal samples in each tissue plotted against the malignancy continuum. Samples are colored based on if they are from different disease stage.
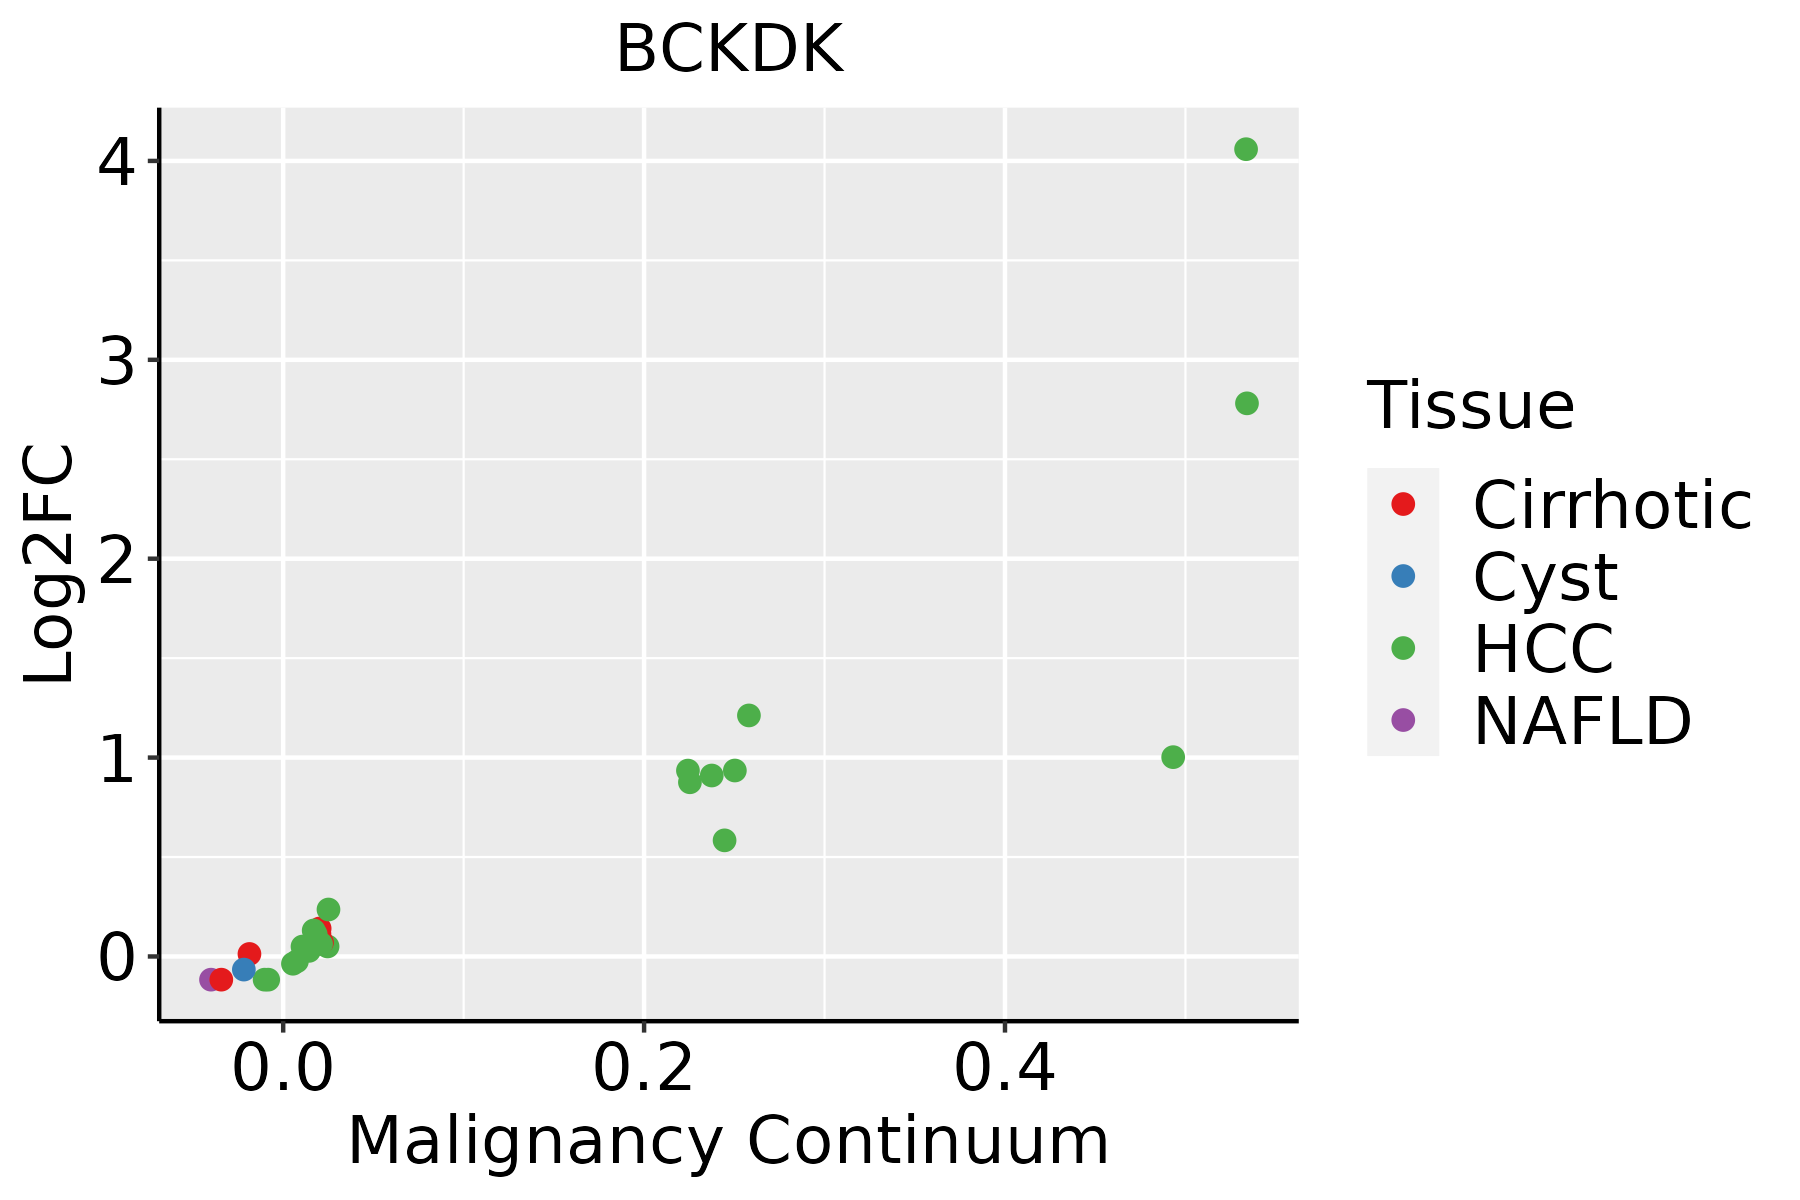
HCC: Hepatocellular carcinoma
NAFLD: Non-alcoholic fatty liver disease
Oral CavityThe image shows the transcriptomic changes along malignancy continuum.log2FC in expression of this searched gene in stem-like cells from each diseased tissue sample relative to stem-like cells in normal samples in each tissue plotted against the malignancy continuum. Samples are colored based on if they are from different disease stage.
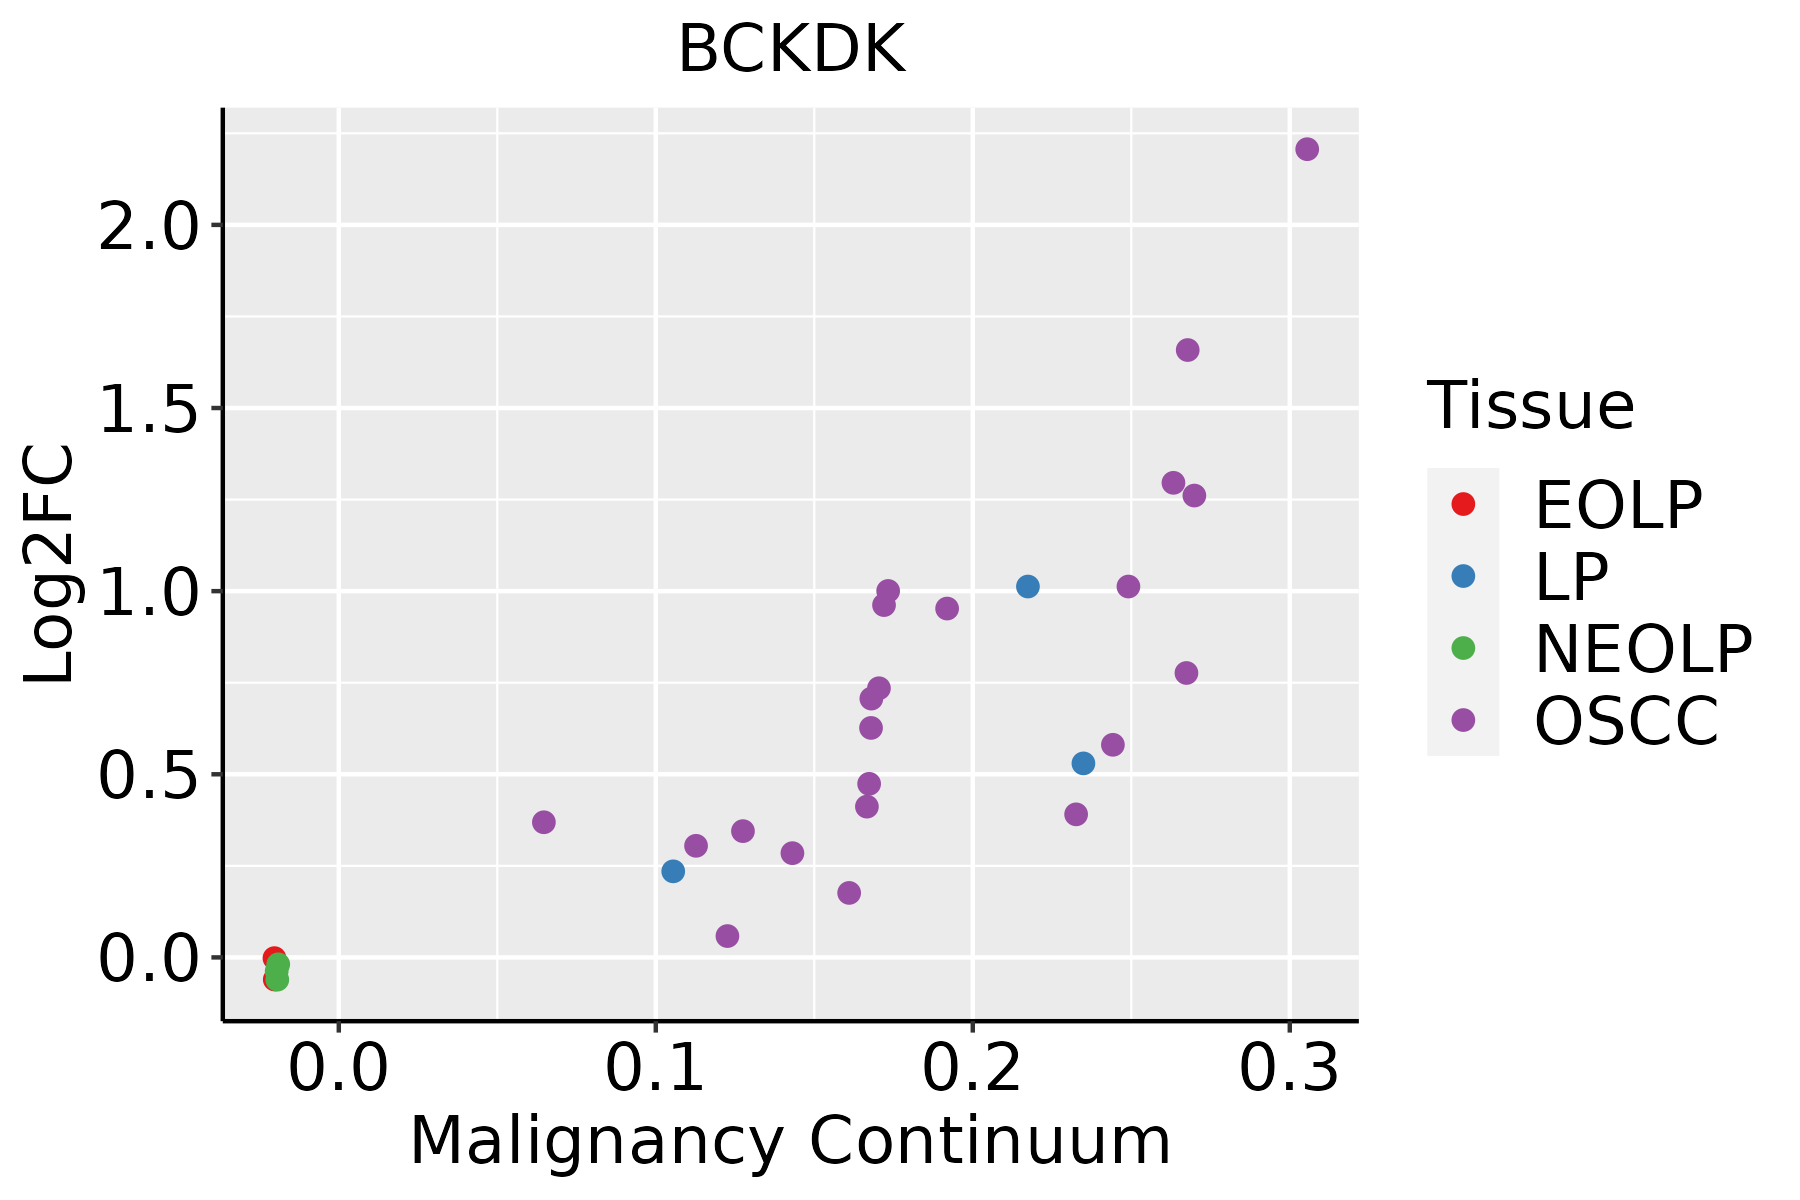
EOLP: Erosive Oral lichen planus
LP: leukoplakia
NEOLP: Non-erosive oral lichen planus
OSCC: Oral squamous cell carcinoma
SkinThe image shows the transcriptomic changes along malignancy continuum.log2FC in expression of this searched gene in stem-like cells from each diseased tissue sample relative to stem-like cells in normal samples in each tissue plotted against the malignancy continuum. Samples are colored based on if they are from different disease stage.AK: Actinic keratosis
cSCC: Cutaneous squamous cell carcinoma
SCCIS:squamous cell carcinoma in situ
∗log2FC in expression of this searched gene in stem-like cells from each diseased tissue sample relative to stem-like cells in normal samples in each tissue plotted against the malignancy continuum. Samples are colored based on if they are from different disease stage.

Top

Malignant transformation related pathway analysis

check buttonFind out the enriched GO biological processes and KEGG pathways involved in transition from healthy to precancer to cancer
check button Figure of enriched GO biological processes.
TissueDisease StageEnriched GO biological Processes
ColorectumADGO analysis - Figure of enriched GO biological processes: Top 15 enriched GO BP terms are showed in the bar plot of each disease state in each tissue. Each row represents a significant GO biological process which is colored according to the -log10(p.adjust).
ColorectumSERGO analysis - Figure of enriched GO biological processes: Top 15 enriched GO BP terms are showed in the bar plot of each disease state in each tissue. Each row represents a significant GO biological process which is colored according to the -log10(p.adjust).
ColorectumMSSGO analysis - Figure of enriched GO biological processes: Top 15 enriched GO BP terms are showed in the bar plot of each disease state in each tissue. Each row represents a significant GO biological process which is colored according to the -log10(p.adjust).
ColorectumMSI-HGO analysis - Figure of enriched GO biological processes: Top 15 enriched GO BP terms are showed in the bar plot of each disease state in each tissue. Each row represents a significant GO biological process which is colored according to the -log10(p.adjust).
ColorectumFAPGO analysis - Figure of enriched GO biological processes: Top 15 enriched GO BP terms are showed in the bar plot of each disease state in each tissue. Each row represents a significant GO biological process which is colored according to the -log10(p.adjust).
∗Top 15 enriched GO BP terms are showed in the bar plot of each disease state in each tissue. Each row represents a significant GO biological process which is colored according to the -log10(p.adjust).
Page: 1 2 3 4 5 6 7 8 9 

check button Enriched GO biological processes.
GO IDTissueDisease StageDescriptionGene RatioBg Ratiopvaluep.adjustCount
GO:00059969EsophagusESCCmonosaccharide metabolic process159/8552257/187231.11e-071.81e-06159
GO:00193189EsophagusESCChexose metabolic process147/8552237/187232.63e-073.94e-06147
GO:00060069EsophagusESCCglucose metabolic process119/8552196/187231.51e-051.36e-04119
GO:00442626EsophagusESCCcellular carbohydrate metabolic process160/8552283/187231.43e-049.66e-04160
GO:00620129EsophagusESCCregulation of small molecule metabolic process184/8552334/187233.11e-041.85e-03184
GO:00421805EsophagusESCCcellular ketone metabolic process120/8552211/187236.70e-043.55e-03120
GO:00442827EsophagusESCCsmall molecule catabolic process201/8552376/187231.35e-036.41e-03201
GO:00109065EsophagusESCCregulation of glucose metabolic process71/8552119/187231.46e-036.92e-0371
GO:00061096EsophagusESCCregulation of carbohydrate metabolic process101/8552178/187231.89e-038.52e-03101
GO:00106755EsophagusESCCregulation of cellular carbohydrate metabolic process83/8552146/187234.24e-031.69e-0283
GO:00090836EsophagusESCCbranched-chain amino acid catabolic process12/855215/187237.31e-032.63e-0212
GO:00090815EsophagusESCCbranched-chain amino acid metabolic process14/855219/187231.27e-024.21e-0214
GO:004428211LiverCirrhoticsmall molecule catabolic process151/4634376/187232.20e-111.34e-09151
GO:001605411LiverCirrhoticorganic acid catabolic process104/4634240/187231.91e-109.53e-09104
GO:004639511LiverCirrhoticcarboxylic acid catabolic process102/4634236/187233.41e-101.63e-08102
GO:000599612LiverCirrhoticmonosaccharide metabolic process104/4634257/187231.74e-086.32e-07104
GO:001931812LiverCirrhotichexose metabolic process97/4634237/187232.67e-089.16e-0797
GO:19016051LiverCirrhoticalpha-amino acid metabolic process82/4634195/187237.72e-082.30e-0682
GO:000600611LiverCirrhoticglucose metabolic process82/4634196/187231.01e-072.93e-0682
GO:006201212LiverCirrhoticregulation of small molecule metabolic process124/4634334/187232.74e-076.79e-06124
Page: 1 2 3 4 

check button Enriched KEGG pathways.
Pathway IDTissueDisease StageDescriptionGene RatioBg Ratiopvaluep.adjustqvalueCount
Page: 1 

Top

Cell-cell communication analysis

check buttonIdentification of potential cell-cell interactions between two cell types and their ligand-receptor pairs for different disease states
LigandReceptorLRpairPathwayTissueDisease Stage
Page: 1 

Top

Single-cell gene regulatory network inference analysis

check buttonFind out the significant the regulons (TFs) and the target genes of each regulon across cell types for different disease states
TFCell TypeTissueDisease StageTarget GeneRSSRegulon Activity
∗The dot plots of a searched regulon are shown for all cell subpopulations in each disease state of each tissue based on the regulon specific score inferred using pySCENIC and by calculating the average expression.
Page: 1 

Top

Somatic mutation of malignant transformation related genes

check buttonAnnotation of somatic variants for genes involved in malignant transformation
Hugo SymbolVariant ClassVariant ClassificationdbSNP RSHGVScHGVSpHGVSp ShortSWISSPROTBIOTYPESIFTPolyPhenTumor Sample BarcodeTissueHistologySexAgeStageTherapy TypesDrugsOutcome
BCKDKSNVMissense_Mutationnovelc.244C>Gp.Gln82Glup.Q82EO14874protein_codingtolerated(0.19)benign(0.01)TCGA-A2-A0CL-01Breastbreast invasive carcinomaFemale<65III/IVChemotherapycytoxanSD
BCKDKSNVMissense_Mutationnovelc.490G>Cp.Asp164Hisp.D164HO14874protein_codingtolerated(0.13)benign(0.157)TCGA-A7-A0DA-01Breastbreast invasive carcinomaFemale<65I/IIChemotherapyadriamycinSD
BCKDKSNVMissense_Mutationc.100N>Tp.Ala34Serp.A34SO14874protein_codingtolerated_low_confidence(0.59)benign(0.003)TCGA-AR-A251-01Breastbreast invasive carcinomaFemale<65III/IVChemotherapydoxorubicinSD
BCKDKSNVMissense_Mutationc.924N>Ap.Asp308Glup.D308EO14874protein_codingdeleterious(0.01)probably_damaging(0.975)TCGA-BH-A0DK-01Breastbreast invasive carcinomaFemale<65I/IIHormone TherapytamoxiphenSD
BCKDKSNVMissense_Mutationc.523N>Ap.Glu175Lysp.E175KO14874protein_codingdeleterious(0.01)possibly_damaging(0.869)TCGA-D8-A1X9-01Breastbreast invasive carcinomaFemale>=65I/IIChemotherapyadriamycin+cyclophosphamideSD
BCKDKSNVMissense_Mutationc.559N>Tp.Arg187Cysp.R187CO14874protein_codingdeleterious(0.01)possibly_damaging(0.663)TCGA-EW-A1OY-01Breastbreast invasive carcinomaFemale<65I/IIChemotherapydoxorubicinSD
BCKDKdeletionIn_Frame_Delnovelc.655_657delGGCp.Gly219delp.G219delO14874protein_codingTCGA-B6-A0RE-01Breastbreast invasive carcinomaFemale<65I/IIUnknownUnknownSD
BCKDKSNVMissense_Mutationrs553956491c.587C>Tp.Ser196Leup.S196LO14874protein_codingdeleterious(0)probably_damaging(0.973)TCGA-IR-A3LH-01Cervixcervical & endocervical cancerFemale<65I/IIChemotherapycisplatinCR
BCKDKSNVMissense_Mutationrs766922526c.1196N>Ap.Arg399Glnp.R399QO14874protein_codingdeleterious(0.01)probably_damaging(0.917)TCGA-AA-3715-01Colorectumcolon adenocarcinomaMale>=65I/IIUnknownUnknownPD
BCKDKSNVMissense_Mutationc.392N>Ap.Arg131Hisp.R131HO14874protein_codingdeleterious(0.05)benign(0.36)TCGA-AA-3815-01Colorectumcolon adenocarcinomaFemale>=65I/IIUnknownUnknownSD
Page: 1 2 3 4 5 

Top

Related drugs of malignant transformation related genes

check buttonIdentification of chemicals and drugs interact with genes involved in malignant transfromation
(DGIdb 4.0)
Entrez IDSymbolCategoryInteraction TypesDrug Claim NameDrug NamePMIDs
Page: 1