
|
|||||
|
 | |
| |
| |
| |
| |
| |
|
Gene: BCKDHB |
Gene summary for BCKDHB |
| Gene information | Species | Human | Gene symbol | BCKDHB | Gene ID | 594 |
| Gene name | branched chain keto acid dehydrogenase E1 subunit beta | |
| Gene Alias | BCKDE1B | |
| Cytomap | 6q14.1 | |
| Gene Type | protein-coding | GO ID | GO:0006082 | UniProtAcc | A0A140VKB3 |
Top |
Malignant transformation analysis |
| Identification of the aberrant gene expression in precancerous and cancerous lesions by comparing the gene expression of stem-like cells in diseased tissues with normal stem cells |
| Entrez ID | Symbol | Replicates | Species | Organ | Tissue | Adj P-value | Log2FC | Malignancy |
| 594 | BCKDHB | HTA11_3410_2000001011 | Human | Colorectum | AD | 3.38e-09 | -5.14e-01 | 0.0155 |
| 594 | BCKDHB | HTA11_3361_2000001011 | Human | Colorectum | AD | 4.23e-05 | -5.15e-01 | -0.1207 |
| 594 | BCKDHB | HTA11_696_2000001011 | Human | Colorectum | AD | 1.73e-03 | -3.09e-01 | -0.1464 |
| 594 | BCKDHB | HTA11_866_2000001011 | Human | Colorectum | AD | 1.24e-04 | -3.77e-01 | -0.1001 |
| 594 | BCKDHB | HTA11_866_3004761011 | Human | Colorectum | AD | 3.21e-08 | -5.34e-01 | 0.096 |
| 594 | BCKDHB | HTA11_7696_3000711011 | Human | Colorectum | AD | 3.61e-03 | -3.41e-01 | 0.0674 |
| 594 | BCKDHB | HTA11_99999970781_79442 | Human | Colorectum | MSS | 1.96e-02 | -2.91e-01 | 0.294 |
| 594 | BCKDHB | HTA11_99999971662_82457 | Human | Colorectum | MSS | 1.71e-02 | -3.57e-01 | 0.3859 |
| 594 | BCKDHB | HTA11_99999974143_84620 | Human | Colorectum | MSS | 1.74e-11 | -4.84e-01 | 0.3005 |
| 594 | BCKDHB | A001-C-207 | Human | Colorectum | FAP | 6.61e-04 | -2.70e-01 | 0.1278 |
| 594 | BCKDHB | A015-C-203 | Human | Colorectum | FAP | 6.07e-36 | -5.87e-01 | -0.1294 |
| 594 | BCKDHB | A015-C-204 | Human | Colorectum | FAP | 1.92e-07 | -3.67e-01 | -0.0228 |
| 594 | BCKDHB | A014-C-040 | Human | Colorectum | FAP | 2.57e-05 | -4.30e-01 | -0.1184 |
| 594 | BCKDHB | A002-C-201 | Human | Colorectum | FAP | 2.58e-16 | -3.94e-01 | 0.0324 |
| 594 | BCKDHB | A002-C-203 | Human | Colorectum | FAP | 8.94e-04 | -1.69e-01 | 0.2786 |
| 594 | BCKDHB | A001-C-119 | Human | Colorectum | FAP | 9.15e-14 | -6.21e-01 | -0.1557 |
| 594 | BCKDHB | A001-C-108 | Human | Colorectum | FAP | 1.70e-24 | -5.73e-01 | -0.0272 |
| 594 | BCKDHB | A002-C-205 | Human | Colorectum | FAP | 4.88e-31 | -6.50e-01 | -0.1236 |
| 594 | BCKDHB | A001-C-104 | Human | Colorectum | FAP | 2.51e-08 | -3.83e-01 | 0.0184 |
| 594 | BCKDHB | A015-C-005 | Human | Colorectum | FAP | 4.14e-07 | -3.81e-01 | -0.0336 |
| Page: 1 2 3 4 5 |
| Tissue | Expression Dynamics | Abbreviation |
| Colorectum (GSE201348) |  | FAP: Familial adenomatous polyposis |
| CRC: Colorectal cancer | ||
| Colorectum (HTA11) |  | AD: Adenomas |
| SER: Sessile serrated lesions | ||
| MSI-H: Microsatellite-high colorectal cancer | ||
| MSS: Microsatellite stable colorectal cancer | ||
| Esophagus | 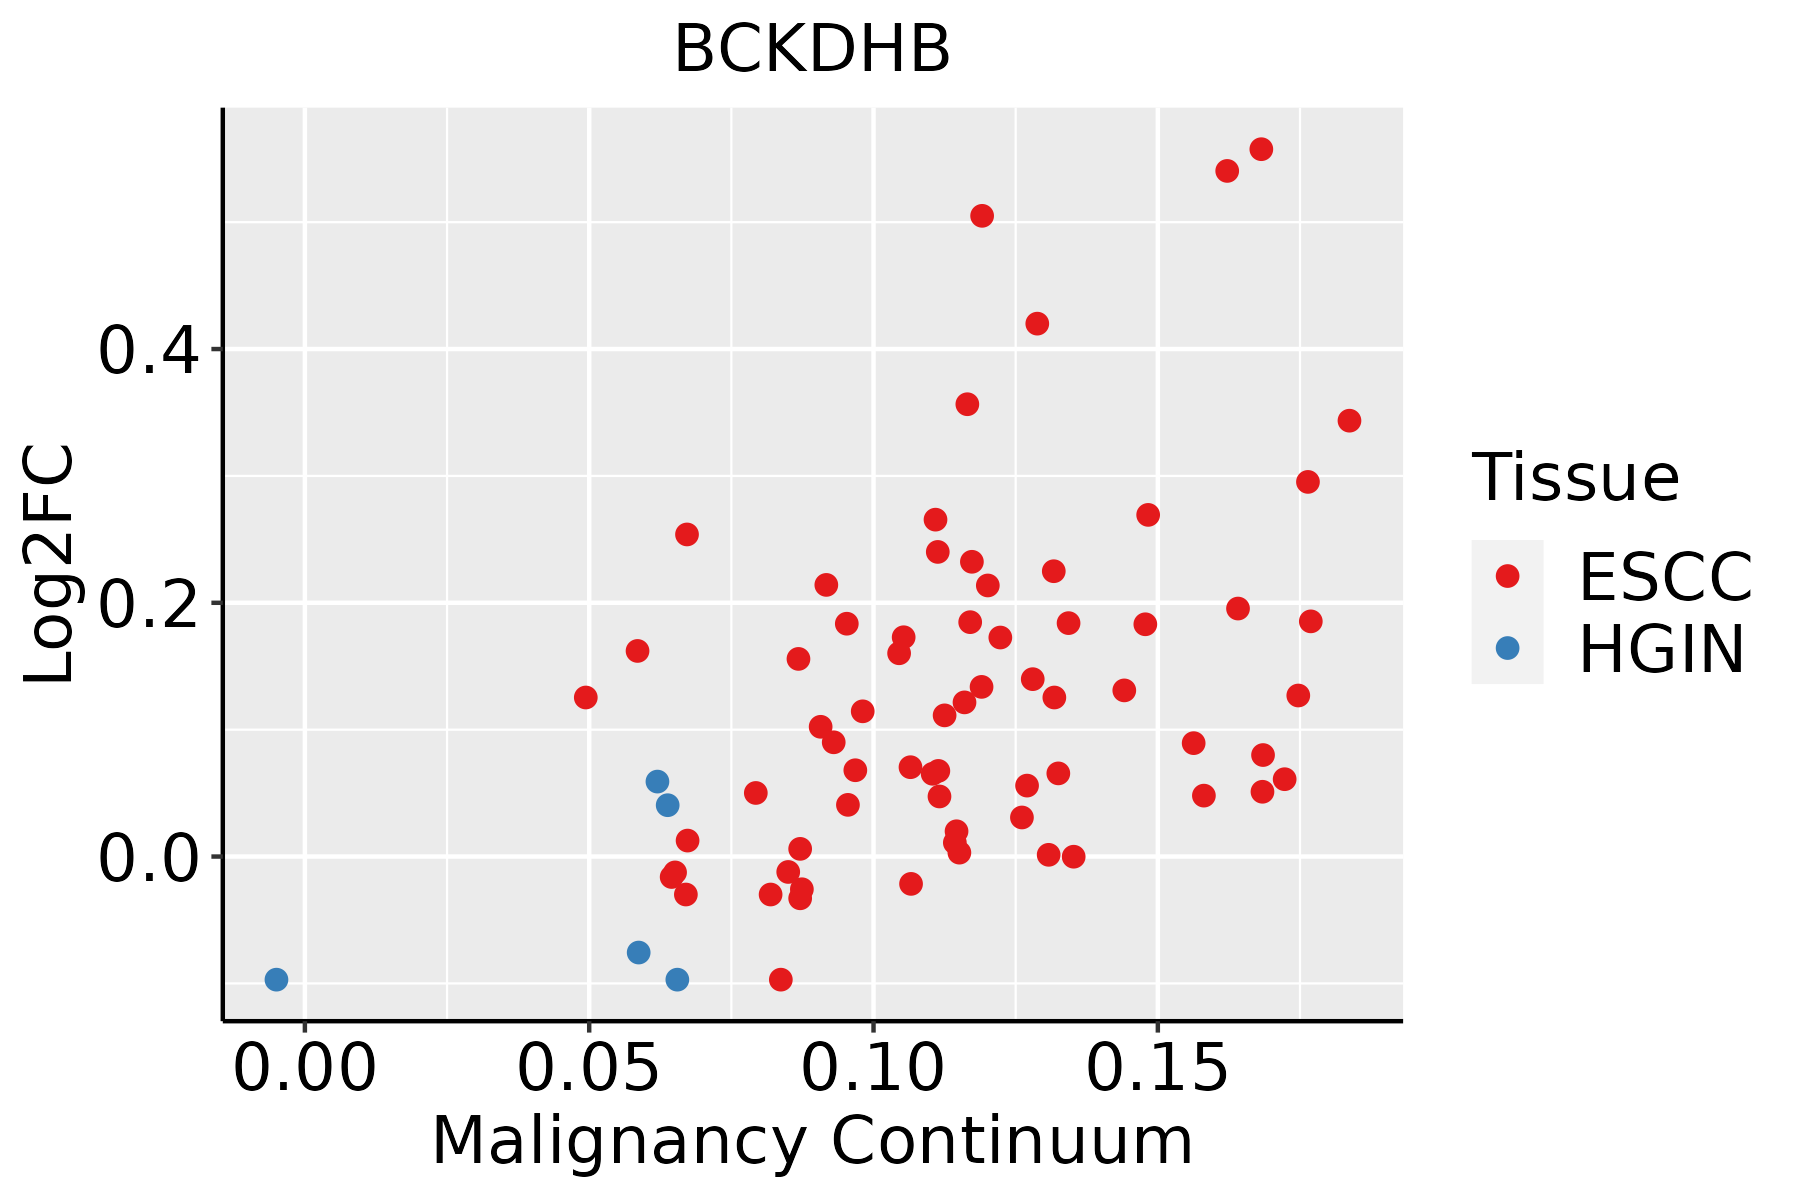 | ESCC: Esophageal squamous cell carcinoma |
| HGIN: High-grade intraepithelial neoplasias | ||
| LGIN: Low-grade intraepithelial neoplasias | ||
| Liver |  | HCC: Hepatocellular carcinoma |
| NAFLD: Non-alcoholic fatty liver disease | ||
| Lung | 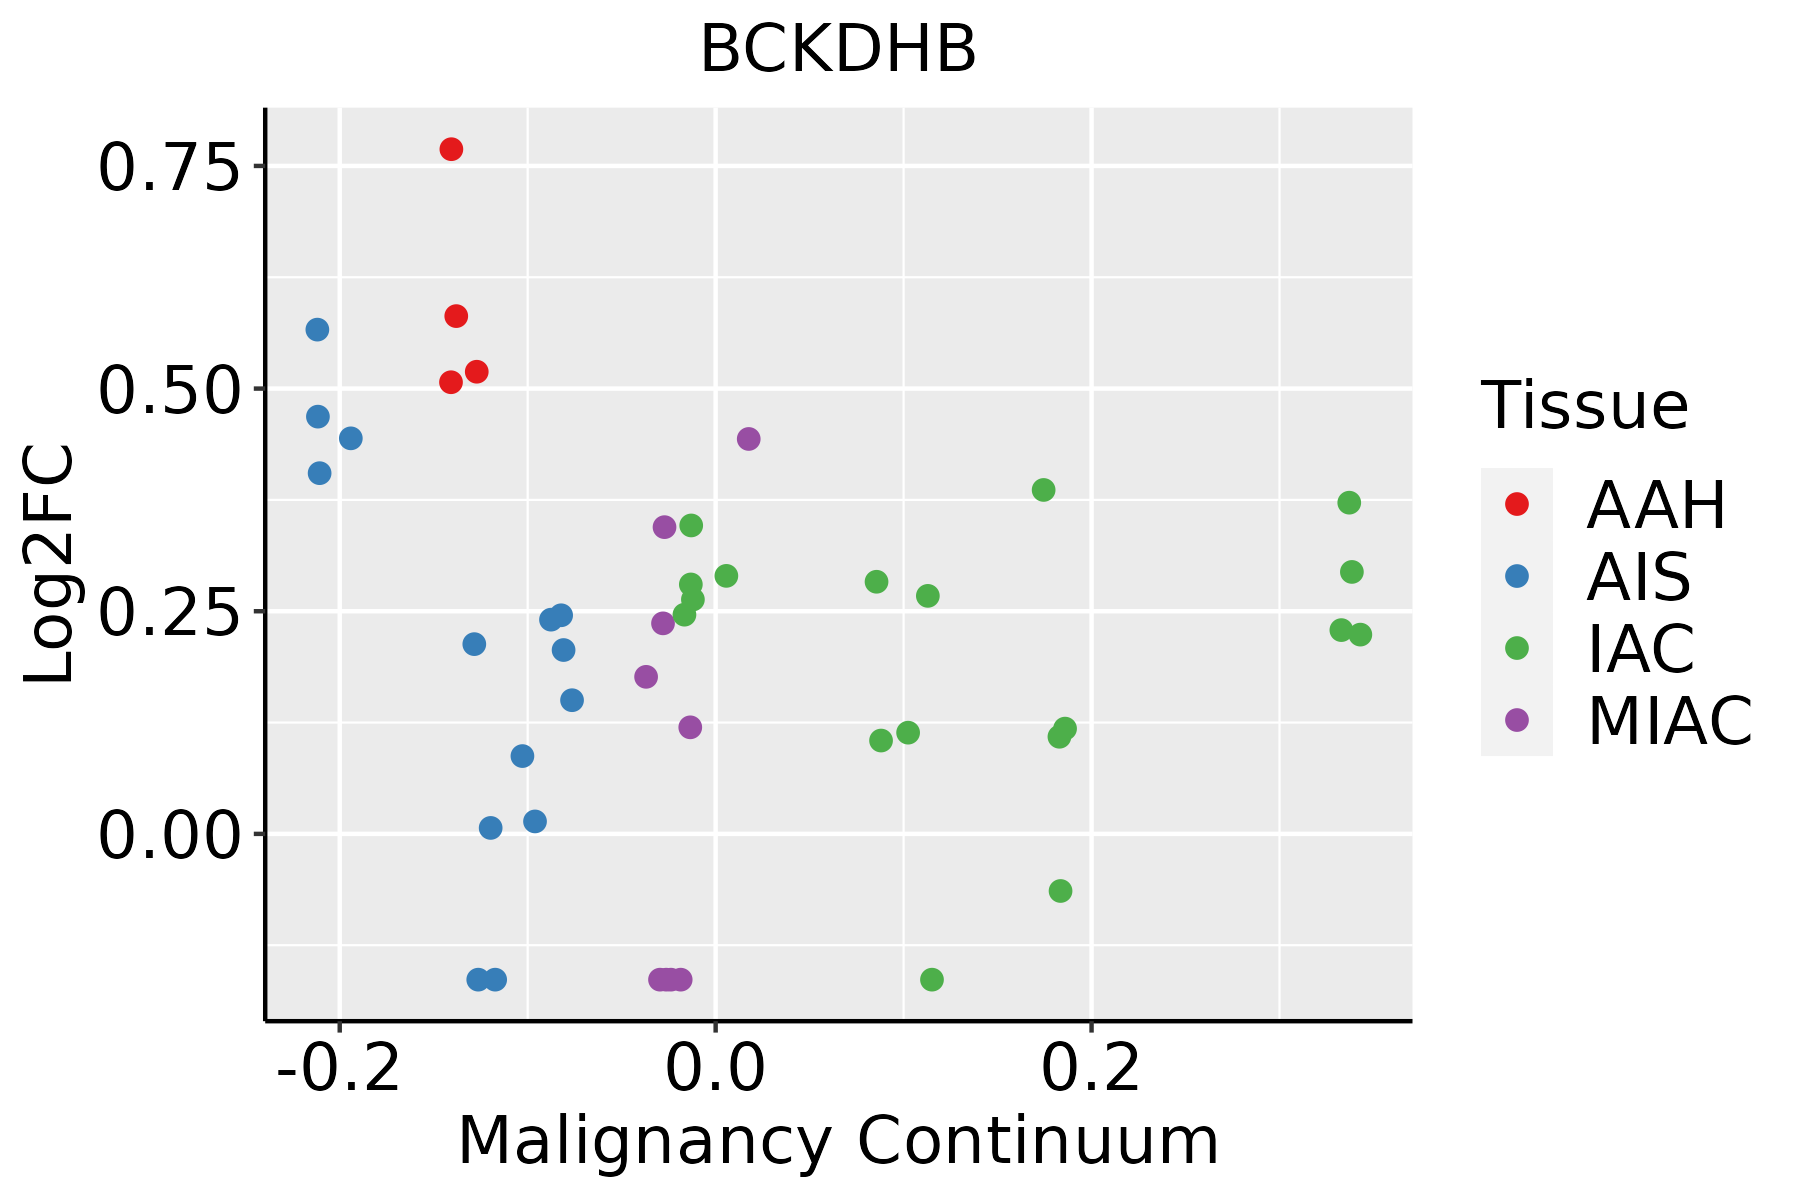 | AAH: Atypical adenomatous hyperplasia |
| AIS: Adenocarcinoma in situ | ||
| IAC: Invasive lung adenocarcinoma | ||
| MIA: Minimally invasive adenocarcinoma |
| ∗log2FC in expression of this searched gene in stem-like cells from each diseased tissue sample relative to stem-like cells in normal samples in each tissue plotted against the malignancy continuum. Samples are colored based on if they are from different disease stage. |
Top |
Malignant transformation related pathway analysis |
| Find out the enriched GO biological processes and KEGG pathways involved in transition from healthy to precancer to cancer |
| Tissue | Disease Stage | Enriched GO biological Processes |
| Colorectum | AD |  |
| Colorectum | SER |  |
| Colorectum | MSS |  |
| Colorectum | MSI-H |  |
| Colorectum | FAP |  |
| ∗Top 15 enriched GO BP terms are showed in the bar plot of each disease state in each tissue. Each row represents a significant GO biological process which is colored according to the -log10(p.adjust). |
| Page: 1 2 3 4 5 6 7 8 9 |
| GO ID | Tissue | Disease Stage | Description | Gene Ratio | Bg Ratio | pvalue | p.adjust | Count |
| GO:0044282 | Colorectum | AD | small molecule catabolic process | 118/3918 | 376/18723 | 1.05e-06 | 3.55e-05 | 118 |
| GO:0031667 | Colorectum | AD | response to nutrient levels | 138/3918 | 474/18723 | 1.22e-05 | 2.68e-04 | 138 |
| GO:0009083 | Colorectum | AD | branched-chain amino acid catabolic process | 10/3918 | 15/18723 | 1.68e-04 | 2.29e-03 | 10 |
| GO:0016054 | Colorectum | AD | organic acid catabolic process | 73/3918 | 240/18723 | 3.20e-04 | 3.81e-03 | 73 |
| GO:0046395 | Colorectum | AD | carboxylic acid catabolic process | 70/3918 | 236/18723 | 9.06e-04 | 8.71e-03 | 70 |
| GO:0006520 | Colorectum | AD | cellular amino acid metabolic process | 81/3918 | 284/18723 | 1.37e-03 | 1.19e-02 | 81 |
| GO:0009081 | Colorectum | AD | branched-chain amino acid metabolic process | 10/3918 | 19/18723 | 2.25e-03 | 1.77e-02 | 10 |
| GO:00316672 | Colorectum | MSS | response to nutrient levels | 125/3467 | 474/18723 | 1.24e-05 | 2.88e-04 | 125 |
| GO:00090831 | Colorectum | MSS | branched-chain amino acid catabolic process | 10/3467 | 15/18723 | 5.64e-05 | 9.87e-04 | 10 |
| GO:00090811 | Colorectum | MSS | branched-chain amino acid metabolic process | 10/3467 | 19/18723 | 8.39e-04 | 8.68e-03 | 10 |
| GO:00442822 | Colorectum | MSS | small molecule catabolic process | 94/3467 | 376/18723 | 9.85e-04 | 9.86e-03 | 94 |
| GO:00160542 | Colorectum | MSS | organic acid catabolic process | 61/3467 | 240/18723 | 4.72e-03 | 3.31e-02 | 61 |
| GO:00316673 | Colorectum | FAP | response to nutrient levels | 95/2622 | 474/18723 | 1.59e-04 | 2.43e-03 | 95 |
| GO:00442823 | Colorectum | FAP | small molecule catabolic process | 77/2622 | 376/18723 | 3.25e-04 | 4.16e-03 | 77 |
| GO:00160543 | Colorectum | FAP | organic acid catabolic process | 50/2622 | 240/18723 | 2.30e-03 | 1.85e-02 | 50 |
| GO:00090832 | Colorectum | FAP | branched-chain amino acid catabolic process | 7/2622 | 15/18723 | 2.40e-03 | 1.90e-02 | 7 |
| GO:00463951 | Colorectum | FAP | carboxylic acid catabolic process | 48/2622 | 236/18723 | 4.53e-03 | 3.08e-02 | 48 |
| GO:00090833 | Colorectum | CRC | branched-chain amino acid catabolic process | 6/2078 | 15/18723 | 3.82e-03 | 3.19e-02 | 6 |
| GO:0031667111 | Esophagus | ESCC | response to nutrient levels | 289/8552 | 474/18723 | 9.25e-12 | 3.47e-10 | 289 |
| GO:000758410 | Esophagus | ESCC | response to nutrient | 114/8552 | 174/18723 | 9.43e-08 | 1.56e-06 | 114 |
| Page: 1 2 3 |
| Pathway ID | Tissue | Disease Stage | Description | Gene Ratio | Bg Ratio | pvalue | p.adjust | qvalue | Count |
| hsa00280 | Colorectum | AD | Valine, leucine and isoleucine degradation | 25/2092 | 48/8465 | 3.97e-05 | 3.41e-04 | 2.18e-04 | 25 |
| hsa00640 | Colorectum | AD | Propanoate metabolism | 18/2092 | 32/8465 | 1.33e-04 | 1.11e-03 | 7.08e-04 | 18 |
| hsa002801 | Colorectum | AD | Valine, leucine and isoleucine degradation | 25/2092 | 48/8465 | 3.97e-05 | 3.41e-04 | 2.18e-04 | 25 |
| hsa006401 | Colorectum | AD | Propanoate metabolism | 18/2092 | 32/8465 | 1.33e-04 | 1.11e-03 | 7.08e-04 | 18 |
| hsa002802 | Colorectum | MSS | Valine, leucine and isoleucine degradation | 21/1875 | 48/8465 | 6.73e-04 | 4.51e-03 | 2.76e-03 | 21 |
| hsa006404 | Colorectum | MSS | Propanoate metabolism | 15/1875 | 32/8465 | 1.68e-03 | 9.05e-03 | 5.55e-03 | 15 |
| hsa002803 | Colorectum | MSS | Valine, leucine and isoleucine degradation | 21/1875 | 48/8465 | 6.73e-04 | 4.51e-03 | 2.76e-03 | 21 |
| hsa006405 | Colorectum | MSS | Propanoate metabolism | 15/1875 | 32/8465 | 1.68e-03 | 9.05e-03 | 5.55e-03 | 15 |
| hsa006406 | Colorectum | FAP | Propanoate metabolism | 15/1404 | 32/8465 | 6.21e-05 | 6.10e-04 | 3.71e-04 | 15 |
| hsa002804 | Colorectum | FAP | Valine, leucine and isoleucine degradation | 18/1404 | 48/8465 | 3.94e-04 | 3.06e-03 | 1.86e-03 | 18 |
| hsa006407 | Colorectum | FAP | Propanoate metabolism | 15/1404 | 32/8465 | 6.21e-05 | 6.10e-04 | 3.71e-04 | 15 |
| hsa002805 | Colorectum | FAP | Valine, leucine and isoleucine degradation | 18/1404 | 48/8465 | 3.94e-04 | 3.06e-03 | 1.86e-03 | 18 |
| hsa006408 | Colorectum | CRC | Propanoate metabolism | 11/1091 | 32/8465 | 1.51e-03 | 1.17e-02 | 7.94e-03 | 11 |
| hsa006409 | Colorectum | CRC | Propanoate metabolism | 11/1091 | 32/8465 | 1.51e-03 | 1.17e-02 | 7.94e-03 | 11 |
| hsa002809 | Esophagus | ESCC | Valine, leucine and isoleucine degradation | 34/4205 | 48/8465 | 2.34e-03 | 6.54e-03 | 3.35e-03 | 34 |
| hsa0028014 | Esophagus | ESCC | Valine, leucine and isoleucine degradation | 34/4205 | 48/8465 | 2.34e-03 | 6.54e-03 | 3.35e-03 | 34 |
| hsa002806 | Liver | NAFLD | Valine, leucine and isoleucine degradation | 20/1043 | 48/8465 | 3.03e-07 | 1.65e-05 | 1.33e-05 | 20 |
| hsa0064010 | Liver | NAFLD | Propanoate metabolism | 12/1043 | 32/8465 | 2.44e-04 | 4.45e-03 | 3.58e-03 | 12 |
| hsa0028011 | Liver | NAFLD | Valine, leucine and isoleucine degradation | 20/1043 | 48/8465 | 3.03e-07 | 1.65e-05 | 1.33e-05 | 20 |
| hsa0064011 | Liver | NAFLD | Propanoate metabolism | 12/1043 | 32/8465 | 2.44e-04 | 4.45e-03 | 3.58e-03 | 12 |
| Page: 1 2 |
Top |
Cell-cell communication analysis |
| Identification of potential cell-cell interactions between two cell types and their ligand-receptor pairs for different disease states |
| Ligand | Receptor | LRpair | Pathway | Tissue | Disease Stage |
| Page: 1 |
Top |
Single-cell gene regulatory network inference analysis |
| Find out the significant the regulons (TFs) and the target genes of each regulon across cell types for different disease states |
| TF | Cell Type | Tissue | Disease Stage | Target Gene | RSS | Regulon Activity |
| ∗The dot plots of a searched regulon are shown for all cell subpopulations in each disease state of each tissue based on the regulon specific score inferred using pySCENIC and by calculating the average expression. |
| Page: 1 |
Top |
Somatic mutation of malignant transformation related genes |
| Annotation of somatic variants for genes involved in malignant transformation |
| Hugo Symbol | Variant Class | Variant Classification | dbSNP RS | HGVSc | HGVSp | HGVSp Short | SWISSPROT | BIOTYPE | SIFT | PolyPhen | Tumor Sample Barcode | Tissue | Histology | Sex | Age | Stage | Therapy Types | Drugs | Outcome |
| BCKDHB | SNV | Missense_Mutation | c.289G>T | p.Asp97Tyr | p.D97Y | P21953 | protein_coding | deleterious(0) | probably_damaging(1) | TCGA-AN-A046-01 | Breast | breast invasive carcinoma | Female | >=65 | I/II | Unknown | Unknown | SD | |
| BCKDHB | insertion | Nonsense_Mutation | novel | c.1159_1160insCAAGCCCCTTCCTCATCTGCCCTGTAGGGCTGGGGAGGTGCT | p.Arg387delinsProSerProPheLeuIleCysProValGlyLeuGlyArgCysTer | p.R387delinsPSPFLICPVGLGRC* | P21953 | protein_coding | TCGA-AR-A0TY-01 | Breast | breast invasive carcinoma | Female | <65 | I/II | Unspecific | Paclitaxel | PD | ||
| BCKDHB | SNV | Missense_Mutation | rs779150907 | c.971N>A | p.Arg324Gln | p.R324Q | P21953 | protein_coding | deleterious(0) | probably_damaging(0.991) | TCGA-AA-3812-01 | Colorectum | colon adenocarcinoma | Female | >=65 | I/II | Unknown | Unknown | PD |
| BCKDHB | SNV | Missense_Mutation | rs755159101 | c.1160N>A | p.Arg387Gln | p.R387Q | P21953 | protein_coding | tolerated(0.09) | benign(0.012) | TCGA-AZ-6605-01 | Colorectum | colon adenocarcinoma | Male | >=65 | III/IV | Chemotherapy | folfox | SD |
| BCKDHB | SNV | Missense_Mutation | c.620G>A | p.Cys207Tyr | p.C207Y | P21953 | protein_coding | deleterious(0.01) | possibly_damaging(0.874) | TCGA-CK-5913-01 | Colorectum | colon adenocarcinoma | Female | <65 | I/II | Unknown | Unknown | SD | |
| BCKDHB | SNV | Missense_Mutation | rs398124561 | c.1016N>T | p.Ser339Leu | p.S339L | P21953 | protein_coding | deleterious(0) | possibly_damaging(0.526) | TCGA-CM-4746-01 | Colorectum | colon adenocarcinoma | Male | <65 | I/II | Unknown | Unknown | SD |
| BCKDHB | SNV | Missense_Mutation | c.790N>A | p.Glu264Lys | p.E264K | P21953 | protein_coding | deleterious(0.01) | possibly_damaging(0.631) | TCGA-EI-6917-01 | Colorectum | rectum adenocarcinoma | Male | <65 | III/IV | Chemotherapy | 5fluorouracil+oxaciplatina+l-folinian | SD | |
| BCKDHB | deletion | Frame_Shift_Del | novel | c.199delC | p.Gln67LysfsTer5 | p.Q67Kfs*5 | P21953 | protein_coding | TCGA-F4-6805-01 | Colorectum | colon adenocarcinoma | Female | <65 | I/II | Chemotherapy | xeloda | CR | ||
| BCKDHB | SNV | Missense_Mutation | novel | c.427G>T | p.Ala143Ser | p.A143S | P21953 | protein_coding | deleterious(0.05) | benign(0.321) | TCGA-AJ-A2QO-01 | Endometrium | uterine corpus endometrioid carcinoma | Female | >=65 | I/II | Unknown | Unknown | SD |
| BCKDHB | SNV | Missense_Mutation | novel | c.518A>G | p.Asp173Gly | p.D173G | P21953 | protein_coding | tolerated(0.91) | benign(0.005) | TCGA-AJ-A3EL-01 | Endometrium | uterine corpus endometrioid carcinoma | Female | <65 | I/II | Unknown | Unknown | SD |
| Page: 1 2 3 4 5 |
Top |
Related drugs of malignant transformation related genes |
| Identification of chemicals and drugs interact with genes involved in malignant transfromation |
| (DGIdb 4.0) |
| Entrez ID | Symbol | Category | Interaction Types | Drug Claim Name | Drug Name | PMIDs |
| Page: 1 |

Copyright 2023-Present -The University of Texas Health Science Center at Houston |