
|
|||||
|
 | |
| |
| |
| |
| |
| |
|
Gene: BCKDHA |
Gene summary for BCKDHA |
| Gene information | Species | Human | Gene symbol | BCKDHA | Gene ID | 593 |
| Gene name | branched chain keto acid dehydrogenase E1 subunit alpha | |
| Gene Alias | BCKDE1A | |
| Cytomap | 19q13.2 | |
| Gene Type | protein-coding | GO ID | GO:0006082 | UniProtAcc | A0A024R0K3 |
Top |
Malignant transformation analysis |
| Identification of the aberrant gene expression in precancerous and cancerous lesions by comparing the gene expression of stem-like cells in diseased tissues with normal stem cells |
| Entrez ID | Symbol | Replicates | Species | Organ | Tissue | Adj P-value | Log2FC | Malignancy |
| 593 | BCKDHA | sample3 | Human | Cervix | CC | 8.09e-39 | 5.02e-01 | 0.1387 |
| 593 | BCKDHA | H2 | Human | Cervix | HSIL_HPV | 4.00e-05 | 1.12e-01 | 0.0632 |
| 593 | BCKDHA | T3 | Human | Cervix | CC | 2.68e-36 | 5.13e-01 | 0.1389 |
| 593 | BCKDHA | LZE2T | Human | Esophagus | ESCC | 4.73e-03 | 4.66e-01 | 0.082 |
| 593 | BCKDHA | LZE4T | Human | Esophagus | ESCC | 1.25e-18 | 4.82e-01 | 0.0811 |
| 593 | BCKDHA | LZE7T | Human | Esophagus | ESCC | 8.50e-13 | 5.78e-01 | 0.0667 |
| 593 | BCKDHA | LZE8T | Human | Esophagus | ESCC | 8.94e-21 | 5.59e-01 | 0.067 |
| 593 | BCKDHA | LZE20T | Human | Esophagus | ESCC | 2.37e-09 | 3.02e-01 | 0.0662 |
| 593 | BCKDHA | LZE22D1 | Human | Esophagus | HGIN | 1.24e-04 | 2.19e-01 | 0.0595 |
| 593 | BCKDHA | LZE22T | Human | Esophagus | ESCC | 1.54e-04 | 2.52e-01 | 0.068 |
| 593 | BCKDHA | LZE24T | Human | Esophagus | ESCC | 1.12e-55 | 1.32e+00 | 0.0596 |
| 593 | BCKDHA | LZE21T | Human | Esophagus | ESCC | 9.73e-05 | 2.54e-01 | 0.0655 |
| 593 | BCKDHA | LZE6T | Human | Esophagus | ESCC | 7.17e-11 | 3.54e-01 | 0.0845 |
| 593 | BCKDHA | P1T-E | Human | Esophagus | ESCC | 4.53e-14 | 7.10e-01 | 0.0875 |
| 593 | BCKDHA | P2T-E | Human | Esophagus | ESCC | 1.57e-53 | 7.20e-01 | 0.1177 |
| 593 | BCKDHA | P4T-E | Human | Esophagus | ESCC | 7.53e-29 | 5.55e-01 | 0.1323 |
| 593 | BCKDHA | P5T-E | Human | Esophagus | ESCC | 3.19e-23 | 3.76e-01 | 0.1327 |
| 593 | BCKDHA | P8T-E | Human | Esophagus | ESCC | 3.90e-66 | 1.05e+00 | 0.0889 |
| 593 | BCKDHA | P9T-E | Human | Esophagus | ESCC | 1.69e-18 | 4.08e-01 | 0.1131 |
| 593 | BCKDHA | P10T-E | Human | Esophagus | ESCC | 3.86e-76 | 1.20e+00 | 0.116 |
| Page: 1 2 3 4 |
| Tissue | Expression Dynamics | Abbreviation |
| Cervix |  | CC: Cervix cancer |
| HSIL_HPV: HPV-infected high-grade squamous intraepithelial lesions | ||
| N_HPV: HPV-infected normal cervix | ||
| Esophagus | 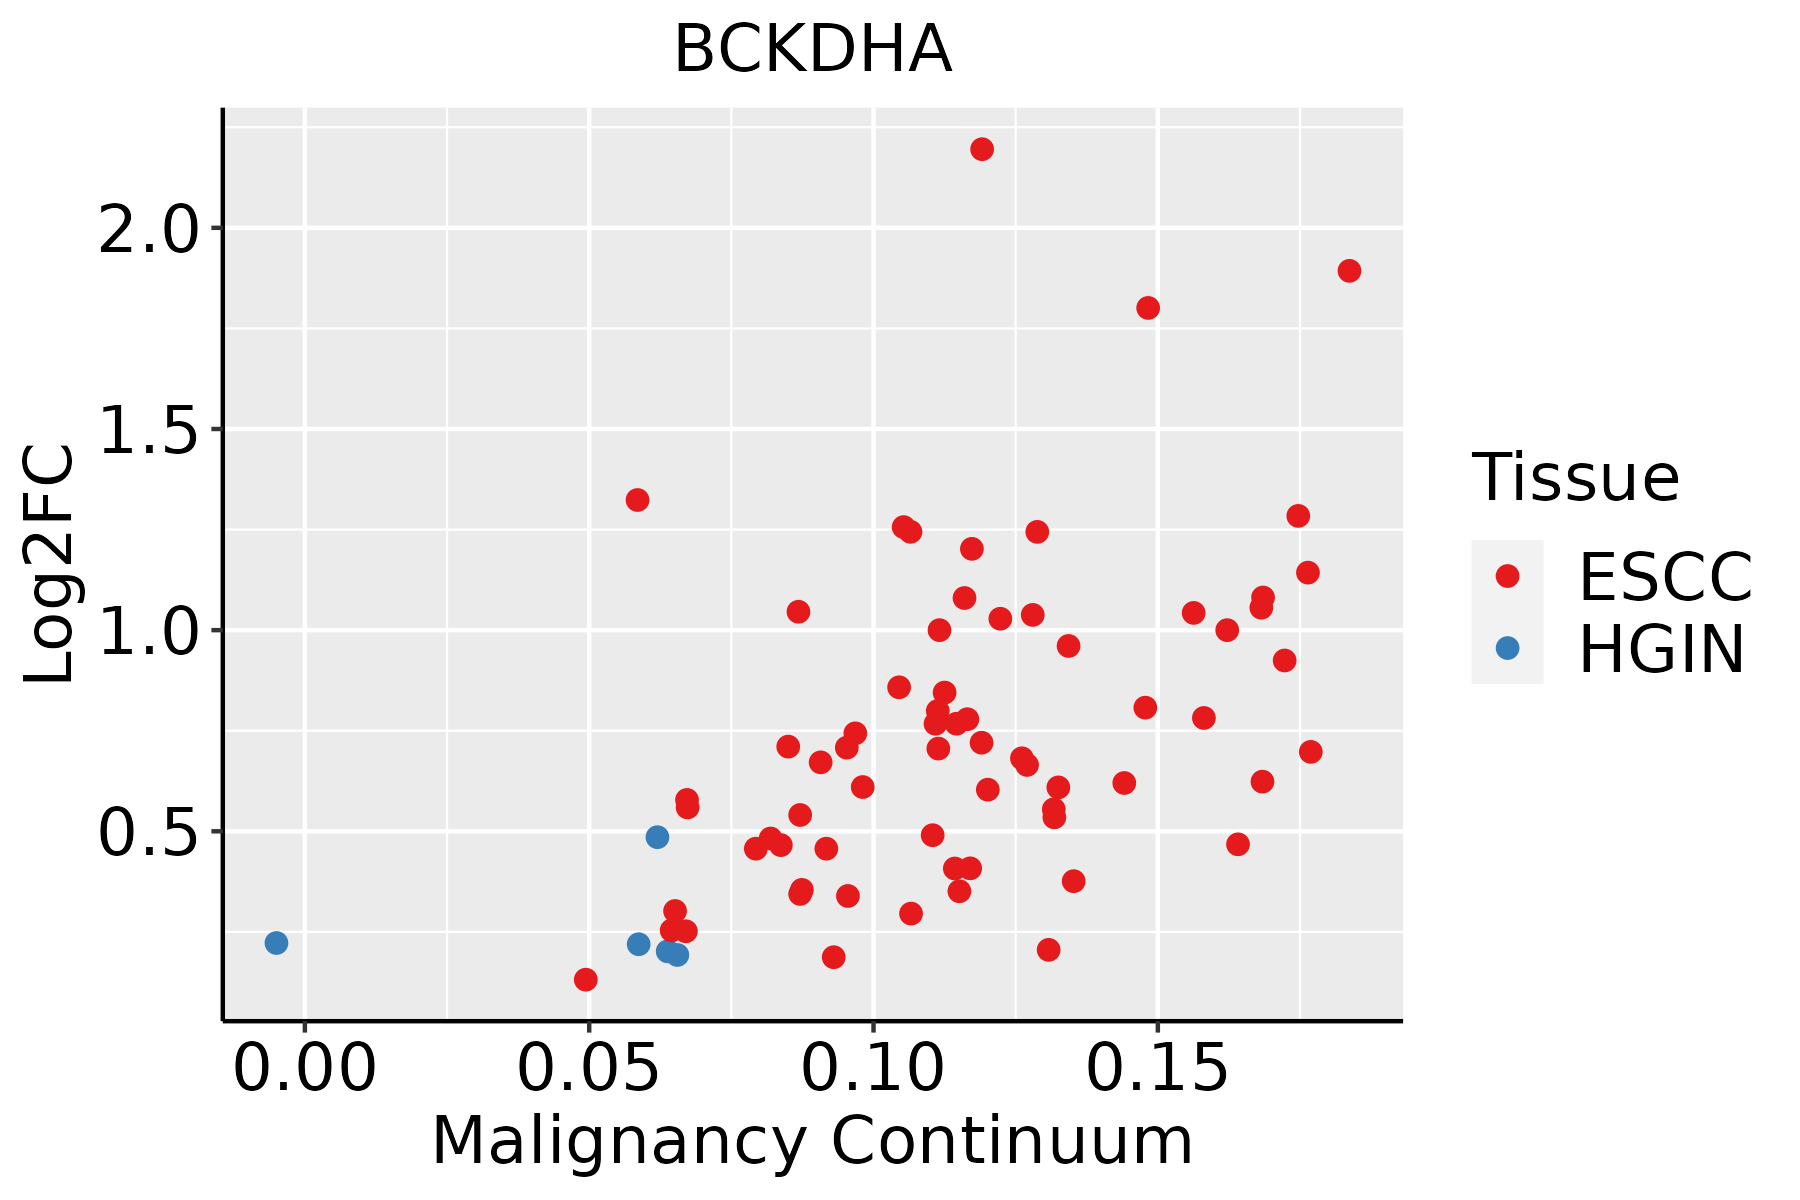 | ESCC: Esophageal squamous cell carcinoma |
| HGIN: High-grade intraepithelial neoplasias | ||
| LGIN: Low-grade intraepithelial neoplasias | ||
| Liver | 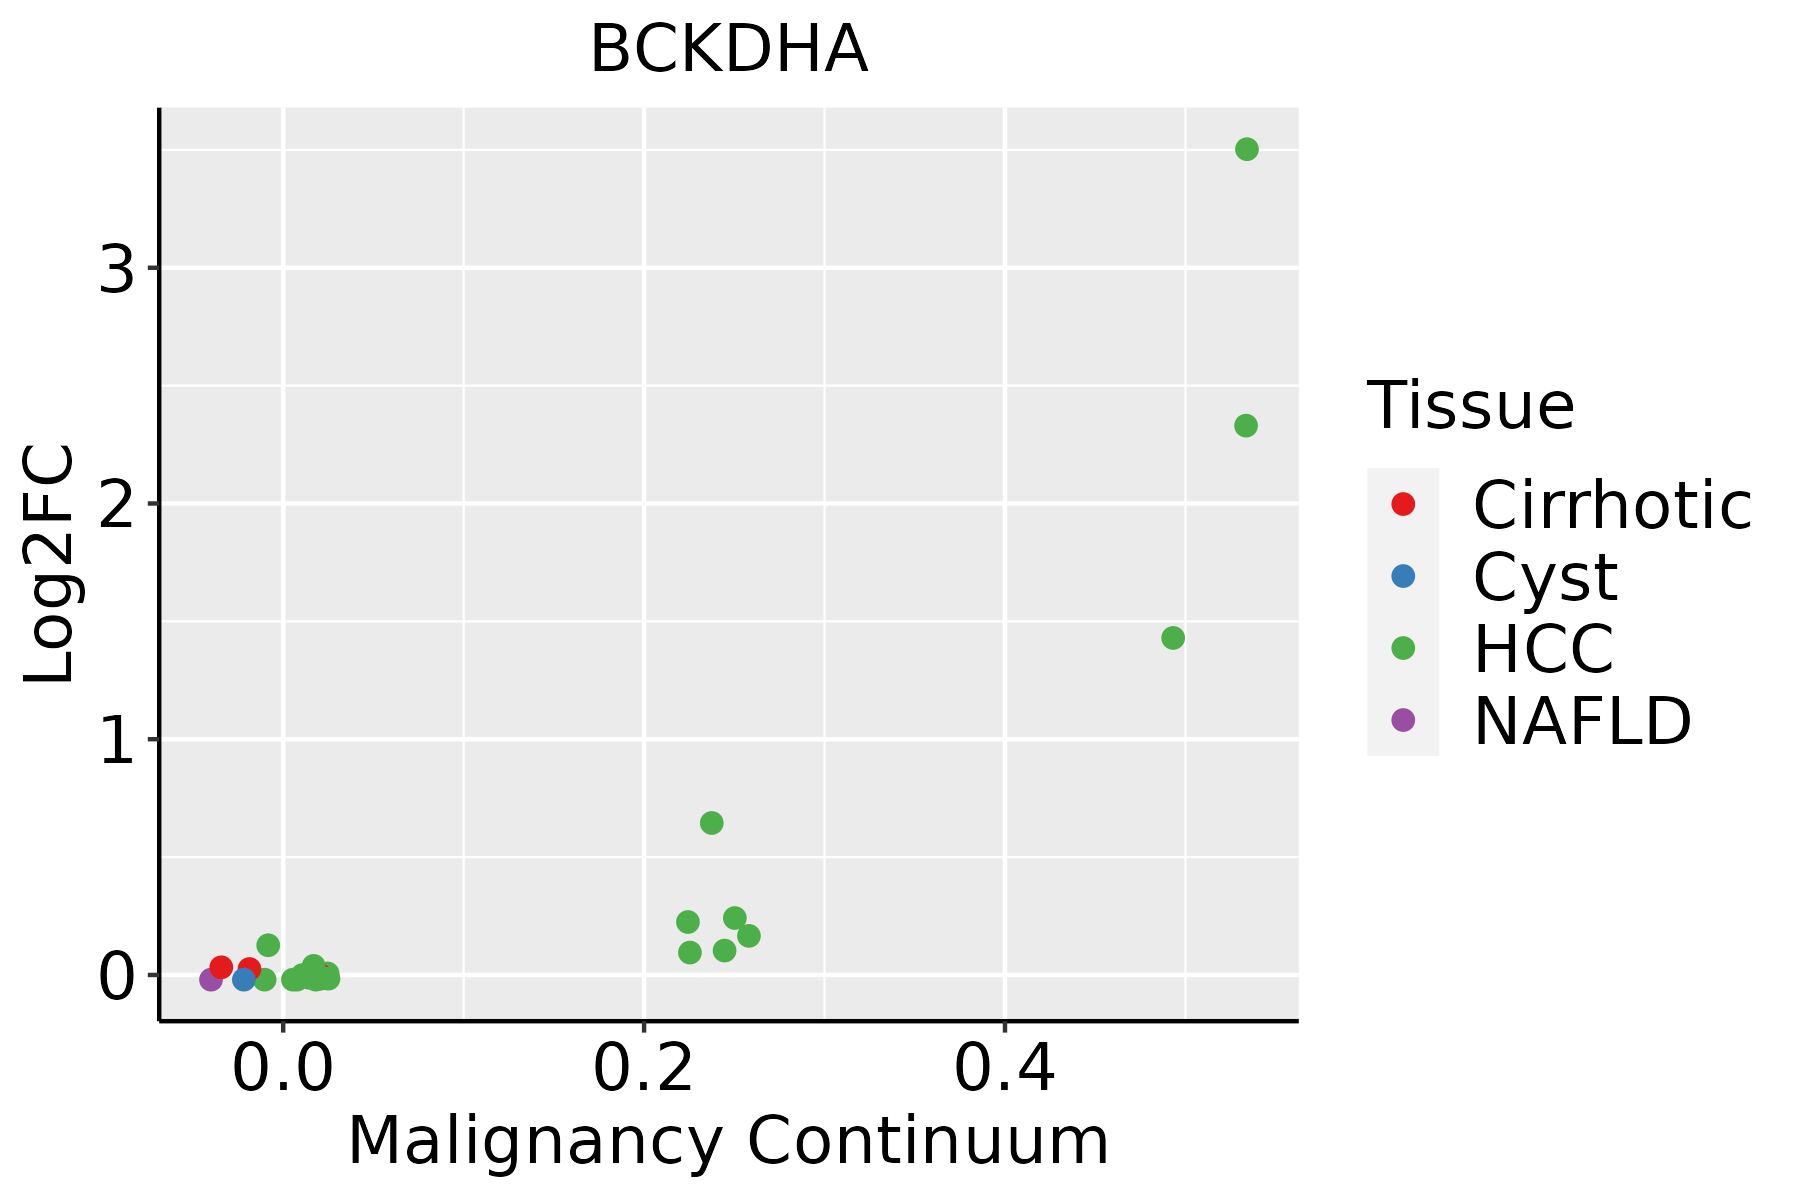 | HCC: Hepatocellular carcinoma |
| NAFLD: Non-alcoholic fatty liver disease |
| ∗log2FC in expression of this searched gene in stem-like cells from each diseased tissue sample relative to stem-like cells in normal samples in each tissue plotted against the malignancy continuum. Samples are colored based on if they are from different disease stage. |
Top |
Malignant transformation related pathway analysis |
| Find out the enriched GO biological processes and KEGG pathways involved in transition from healthy to precancer to cancer |
| Tissue | Disease Stage | Enriched GO biological Processes |
| Colorectum | AD |  |
| Colorectum | SER |  |
| Colorectum | MSS |  |
| Colorectum | MSI-H |  |
| Colorectum | FAP |  |
| ∗Top 15 enriched GO BP terms are showed in the bar plot of each disease state in each tissue. Each row represents a significant GO biological process which is colored according to the -log10(p.adjust). |
| Page: 1 2 3 4 5 6 7 8 9 |
| GO ID | Tissue | Disease Stage | Description | Gene Ratio | Bg Ratio | pvalue | p.adjust | Count |
| GO:00442827 | Esophagus | ESCC | small molecule catabolic process | 201/8552 | 376/18723 | 1.35e-03 | 6.41e-03 | 201 |
| GO:00090836 | Esophagus | ESCC | branched-chain amino acid catabolic process | 12/8552 | 15/18723 | 7.31e-03 | 2.63e-02 | 12 |
| GO:00090815 | Esophagus | ESCC | branched-chain amino acid metabolic process | 14/8552 | 19/18723 | 1.27e-02 | 4.21e-02 | 14 |
| GO:004428221 | Liver | HCC | small molecule catabolic process | 225/7958 | 376/18723 | 6.50e-12 | 2.80e-10 | 225 |
| GO:001605421 | Liver | HCC | organic acid catabolic process | 152/7958 | 240/18723 | 5.11e-11 | 1.92e-09 | 152 |
| GO:00463952 | Liver | HCC | carboxylic acid catabolic process | 149/7958 | 236/18723 | 1.11e-10 | 3.87e-09 | 149 |
| GO:00065202 | Liver | HCC | cellular amino acid metabolic process | 167/7958 | 284/18723 | 1.91e-08 | 4.56e-07 | 167 |
| GO:00090632 | Liver | HCC | cellular amino acid catabolic process | 70/7958 | 110/18723 | 6.12e-06 | 7.52e-05 | 70 |
| GO:00090812 | Liver | HCC | branched-chain amino acid metabolic process | 16/7958 | 19/18723 | 2.37e-04 | 1.79e-03 | 16 |
| GO:000908321 | Liver | HCC | branched-chain amino acid catabolic process | 13/7958 | 15/18723 | 5.67e-04 | 3.61e-03 | 13 |
| Page: 1 |
| Pathway ID | Tissue | Disease Stage | Description | Gene Ratio | Bg Ratio | pvalue | p.adjust | qvalue | Count |
| hsa002809 | Esophagus | ESCC | Valine, leucine and isoleucine degradation | 34/4205 | 48/8465 | 2.34e-03 | 6.54e-03 | 3.35e-03 | 34 |
| hsa0028014 | Esophagus | ESCC | Valine, leucine and isoleucine degradation | 34/4205 | 48/8465 | 2.34e-03 | 6.54e-03 | 3.35e-03 | 34 |
| hsa0028041 | Liver | HCC | Valine, leucine and isoleucine degradation | 41/4020 | 48/8465 | 4.84e-08 | 7.05e-07 | 3.92e-07 | 41 |
| hsa0064041 | Liver | HCC | Propanoate metabolism | 24/4020 | 32/8465 | 1.42e-03 | 5.07e-03 | 2.82e-03 | 24 |
| hsa00785 | Liver | HCC | Lipoic acid metabolism | 14/4020 | 19/8465 | 1.89e-02 | 4.40e-02 | 2.45e-02 | 14 |
| hsa0028051 | Liver | HCC | Valine, leucine and isoleucine degradation | 41/4020 | 48/8465 | 4.84e-08 | 7.05e-07 | 3.92e-07 | 41 |
| hsa0064051 | Liver | HCC | Propanoate metabolism | 24/4020 | 32/8465 | 1.42e-03 | 5.07e-03 | 2.82e-03 | 24 |
| hsa007851 | Liver | HCC | Lipoic acid metabolism | 14/4020 | 19/8465 | 1.89e-02 | 4.40e-02 | 2.45e-02 | 14 |
| Page: 1 |
Top |
Cell-cell communication analysis |
| Identification of potential cell-cell interactions between two cell types and their ligand-receptor pairs for different disease states |
| Ligand | Receptor | LRpair | Pathway | Tissue | Disease Stage |
| Page: 1 |
Top |
Single-cell gene regulatory network inference analysis |
| Find out the significant the regulons (TFs) and the target genes of each regulon across cell types for different disease states |
| TF | Cell Type | Tissue | Disease Stage | Target Gene | RSS | Regulon Activity |
| ∗The dot plots of a searched regulon are shown for all cell subpopulations in each disease state of each tissue based on the regulon specific score inferred using pySCENIC and by calculating the average expression. |
| Page: 1 |
Top |
Somatic mutation of malignant transformation related genes |
| Annotation of somatic variants for genes involved in malignant transformation |
| Hugo Symbol | Variant Class | Variant Classification | dbSNP RS | HGVSc | HGVSp | HGVSp Short | SWISSPROT | BIOTYPE | SIFT | PolyPhen | Tumor Sample Barcode | Tissue | Histology | Sex | Age | Stage | Therapy Types | Drugs | Outcome |
| BCKDHA | SNV | Missense_Mutation | c.750N>A | p.Phe250Leu | p.F250L | P12694 | protein_coding | tolerated(1) | benign(0.149) | TCGA-A8-A09G-01 | Breast | breast invasive carcinoma | Female | >=65 | III/IV | Unknown | Unknown | SD | |
| BCKDHA | SNV | Missense_Mutation | c.506N>G | p.Tyr169Cys | p.Y169C | P12694 | protein_coding | deleterious(0) | probably_damaging(0.942) | TCGA-BH-A18G-01 | Breast | breast invasive carcinoma | Female | >=65 | I/II | Unknown | Unknown | SD | |
| BCKDHA | insertion | Frame_Shift_Ins | novel | c.481_482insCT | p.Gly162GlnfsTer4 | p.G162Qfs*4 | P12694 | protein_coding | TCGA-AR-A0TT-01 | Breast | breast invasive carcinoma | Female | <65 | III/IV | Chemotherapy | doxorubicin | SD | ||
| BCKDHA | insertion | Nonsense_Mutation | novel | c.483_484insGAGAAGGGAAGTGACTTGCCCAAAACCTGACAACT | p.Gly162GlufsTer10 | p.G162Efs*10 | P12694 | protein_coding | TCGA-AR-A0TT-01 | Breast | breast invasive carcinoma | Female | <65 | III/IV | Chemotherapy | doxorubicin | SD | ||
| BCKDHA | SNV | Missense_Mutation | c.280N>C | p.Asp94His | p.D94H | P12694 | protein_coding | deleterious(0.01) | probably_damaging(0.969) | TCGA-UC-A7PF-01 | Cervix | cervical & endocervical cancer | Female | <65 | I/II | Unknown | Unknown | SD | |
| BCKDHA | SNV | Missense_Mutation | rs749876943 | c.1303N>A | p.Gly435Arg | p.G435R | P12694 | protein_coding | tolerated(0.19) | benign(0.036) | TCGA-A6-2686-01 | Colorectum | colon adenocarcinoma | Female | >=65 | I/II | Unknown | Unknown | SD |
| BCKDHA | SNV | Missense_Mutation | rs768944277 | c.239N>A | p.Arg80His | p.R80H | P12694 | protein_coding | deleterious(0) | probably_damaging(0.967) | TCGA-A6-3808-01 | Colorectum | colon adenocarcinoma | Male | >=65 | I/II | Unknown | Unknown | SD |
| BCKDHA | SNV | Missense_Mutation | rs764481217 | c.169N>A | p.Ala57Thr | p.A57T | P12694 | protein_coding | tolerated(0.07) | benign(0.021) | TCGA-AA-3715-01 | Colorectum | colon adenocarcinoma | Male | >=65 | I/II | Unknown | Unknown | PD |
| BCKDHA | SNV | Missense_Mutation | rs536540966 | c.736G>A | p.Ala246Thr | p.A246T | P12694 | protein_coding | tolerated(0.28) | possibly_damaging(0.678) | TCGA-AA-3864-01 | Colorectum | colon adenocarcinoma | Male | >=65 | I/II | Unknown | Unknown | SD |
| BCKDHA | SNV | Missense_Mutation | c.256G>T | p.Gly86Cys | p.G86C | P12694 | protein_coding | deleterious(0) | possibly_damaging(0.872) | TCGA-AA-A010-01 | Colorectum | colon adenocarcinoma | Female | <65 | I/II | Chemotherapy | folinic | CR |
| Page: 1 2 3 4 5 |
Top |
Related drugs of malignant transformation related genes |
| Identification of chemicals and drugs interact with genes involved in malignant transfromation |
| (DGIdb 4.0) |
| Entrez ID | Symbol | Category | Interaction Types | Drug Claim Name | Drug Name | PMIDs |
| Page: 1 |

Copyright 2023-Present -The University of Texas Health Science Center at Houston |