
|
|||||
|
 | |
| |
| |
| |
| |
| |
|
Gene: BCHE |
Gene summary for BCHE |
| Gene information | Species | Human | Gene symbol | BCHE | Gene ID | 590 |
| Gene name | butyrylcholinesterase | |
| Gene Alias | BCHED | |
| Cytomap | 3q26.1 | |
| Gene Type | protein-coding | GO ID | GO:0001505 | UniProtAcc | P06276 |
Top |
Malignant transformation analysis |
| Identification of the aberrant gene expression in precancerous and cancerous lesions by comparing the gene expression of stem-like cells in diseased tissues with normal stem cells |
| Entrez ID | Symbol | Replicates | Species | Organ | Tissue | Adj P-value | Log2FC | Malignancy |
| 590 | BCHE | P2T-E | Human | Esophagus | ESCC | 7.90e-03 | 1.18e-01 | 0.1177 |
| 590 | BCHE | P10T-E | Human | Esophagus | ESCC | 1.43e-42 | 8.10e-01 | 0.116 |
| 590 | BCHE | P11T-E | Human | Esophagus | ESCC | 9.07e-04 | 2.52e-01 | 0.1426 |
| 590 | BCHE | P12T-E | Human | Esophagus | ESCC | 7.90e-03 | 1.01e-01 | 0.1122 |
| 590 | BCHE | P22T-E | Human | Esophagus | ESCC | 1.66e-02 | 8.07e-02 | 0.1236 |
| 590 | BCHE | P26T-E | Human | Esophagus | ESCC | 9.20e-06 | 1.52e-01 | 0.1276 |
| 590 | BCHE | P30T-E | Human | Esophagus | ESCC | 4.84e-02 | 1.61e-01 | 0.137 |
| 590 | BCHE | P32T-E | Human | Esophagus | ESCC | 1.85e-18 | 4.01e-01 | 0.1666 |
| 590 | BCHE | P37T-E | Human | Esophagus | ESCC | 5.37e-05 | 1.69e-01 | 0.1371 |
| 590 | BCHE | P40T-E | Human | Esophagus | ESCC | 6.35e-03 | 1.42e-01 | 0.109 |
| 590 | BCHE | P61T-E | Human | Esophagus | ESCC | 3.65e-02 | 1.04e-01 | 0.099 |
| 590 | BCHE | P62T-E | Human | Esophagus | ESCC | 1.16e-21 | 4.38e-01 | 0.1302 |
| 590 | BCHE | P74T-E | Human | Esophagus | ESCC | 8.96e-18 | 5.31e-01 | 0.1479 |
| 590 | BCHE | P89T-E | Human | Esophagus | ESCC | 3.35e-02 | 3.46e-01 | 0.1752 |
| 590 | BCHE | P107T-E | Human | Esophagus | ESCC | 4.67e-06 | 1.52e-01 | 0.171 |
| 590 | BCHE | HTA12-23-1 | Human | Pancreas | PDAC | 1.44e-05 | 5.53e-01 | 0.3405 |
| 590 | BCHE | HTA12-25-1 | Human | Pancreas | PDAC | 3.07e-08 | 5.45e-01 | 0.313 |
| 590 | BCHE | HTA12-26-1 | Human | Pancreas | PDAC | 7.59e-10 | 5.37e-01 | 0.3728 |
| 590 | BCHE | HTA12-29-1 | Human | Pancreas | PDAC | 5.86e-19 | 5.00e-01 | 0.3722 |
| Page: 1 |
| Tissue | Expression Dynamics | Abbreviation |
| Esophagus | 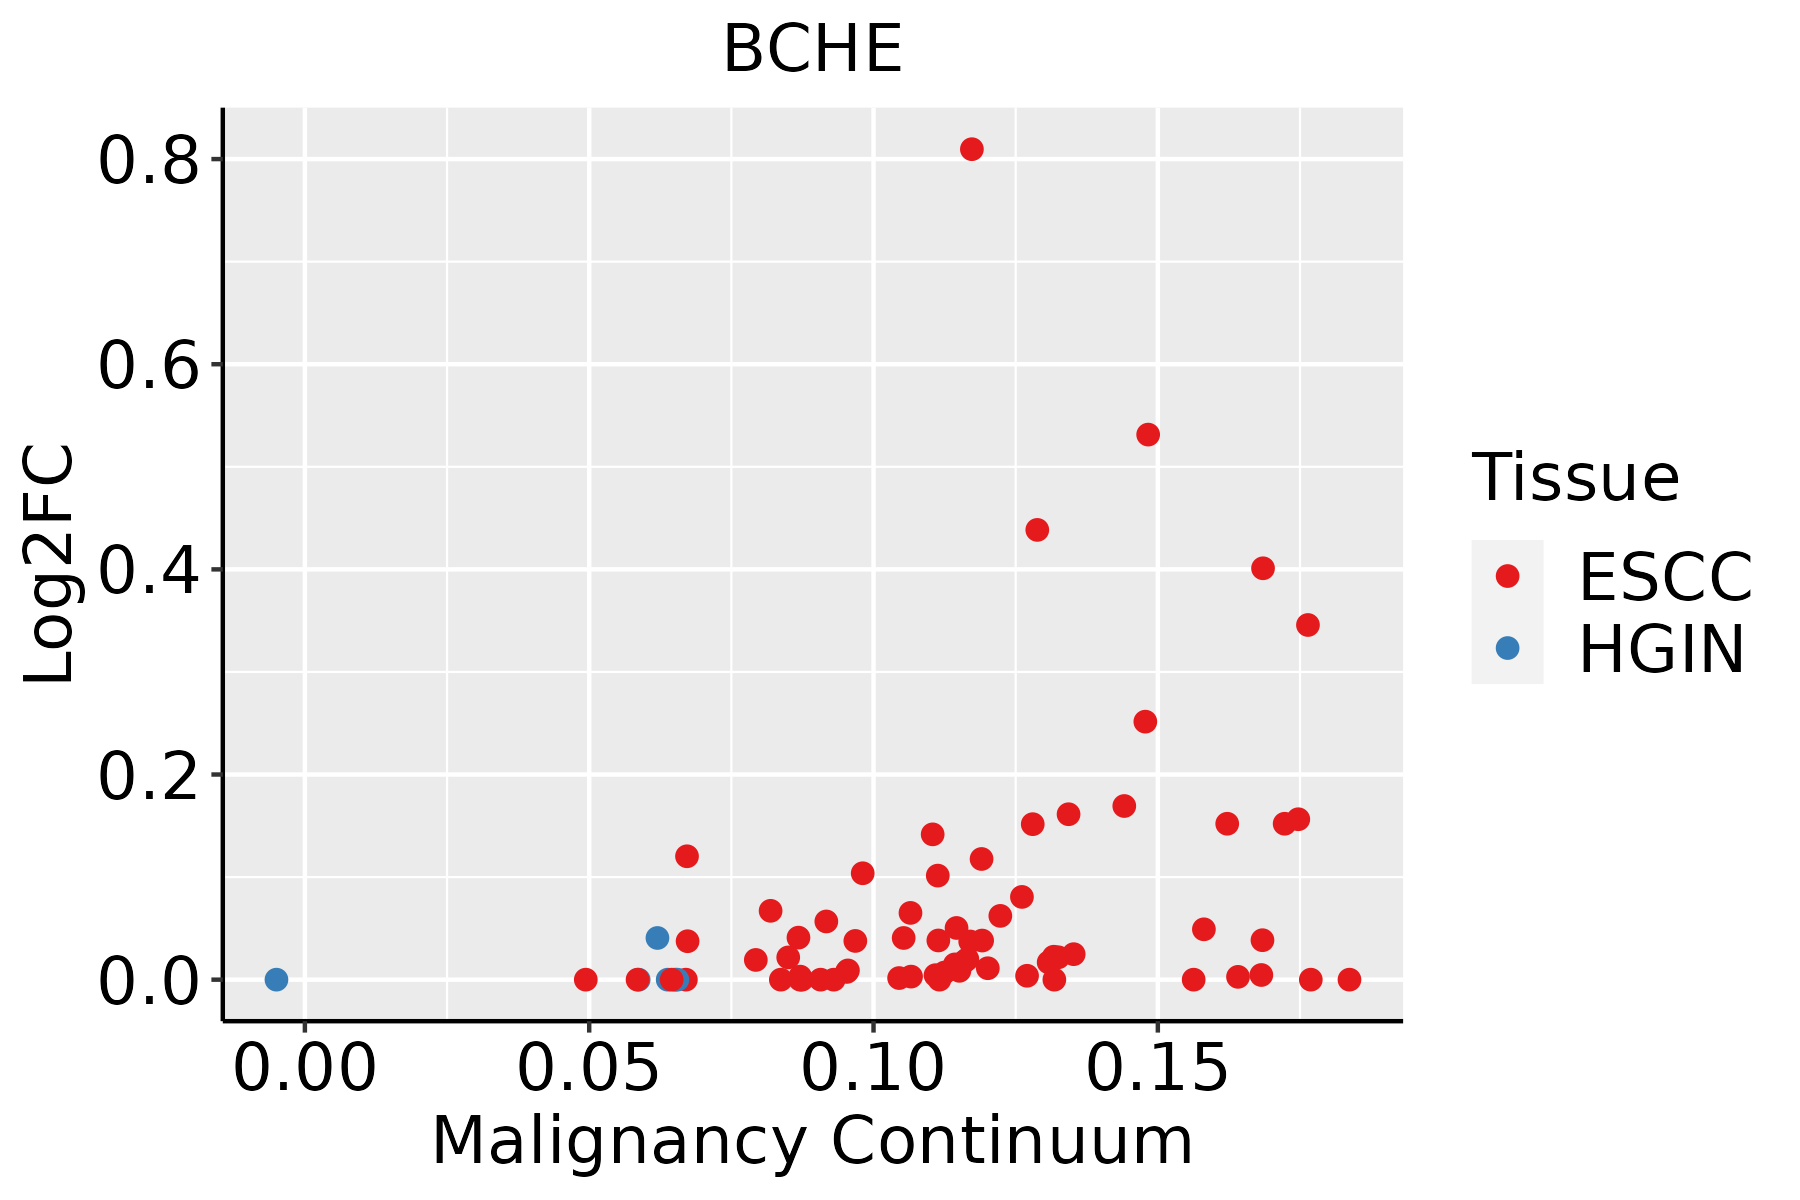 | ESCC: Esophageal squamous cell carcinoma |
| HGIN: High-grade intraepithelial neoplasias | ||
| LGIN: Low-grade intraepithelial neoplasias |
| ∗log2FC in expression of this searched gene in stem-like cells from each diseased tissue sample relative to stem-like cells in normal samples in each tissue plotted against the malignancy continuum. Samples are colored based on if they are from different disease stage. |
Top |
Malignant transformation related pathway analysis |
| Find out the enriched GO biological processes and KEGG pathways involved in transition from healthy to precancer to cancer |
| Tissue | Disease Stage | Enriched GO biological Processes |
| Colorectum | AD |  |
| Colorectum | SER |  |
| Colorectum | MSS |  |
| Colorectum | MSI-H |  |
| Colorectum | FAP |  |
| ∗Top 15 enriched GO BP terms are showed in the bar plot of each disease state in each tissue. Each row represents a significant GO biological process which is colored according to the -log10(p.adjust). |
| Page: 1 2 3 4 5 6 7 8 9 |
| GO ID | Tissue | Disease Stage | Description | Gene Ratio | Bg Ratio | pvalue | p.adjust | Count |
| GO:0031667111 | Esophagus | ESCC | response to nutrient levels | 289/8552 | 474/18723 | 9.25e-12 | 3.47e-10 | 289 |
| GO:0048545111 | Esophagus | ESCC | response to steroid hormone | 204/8552 | 339/18723 | 4.47e-08 | 8.11e-07 | 204 |
| GO:000758410 | Esophagus | ESCC | response to nutrient | 114/8552 | 174/18723 | 9.43e-08 | 1.56e-06 | 114 |
| GO:000941020 | Esophagus | ESCC | response to xenobiotic stimulus | 253/8552 | 462/18723 | 4.55e-05 | 3.58e-04 | 253 |
| GO:00332734 | Esophagus | ESCC | response to vitamin | 60/8552 | 93/18723 | 1.89e-04 | 1.21e-03 | 60 |
| GO:003196020 | Esophagus | ESCC | response to corticosteroid | 95/8552 | 167/18723 | 2.27e-03 | 9.99e-03 | 95 |
| GO:005138420 | Esophagus | ESCC | response to glucocorticoid | 85/8552 | 148/18723 | 2.60e-03 | 1.11e-02 | 85 |
| Page: 1 |
| Pathway ID | Tissue | Disease Stage | Description | Gene Ratio | Bg Ratio | pvalue | p.adjust | qvalue | Count |
| Page: 1 |
Top |
Cell-cell communication analysis |
| Identification of potential cell-cell interactions between two cell types and their ligand-receptor pairs for different disease states |
| Ligand | Receptor | LRpair | Pathway | Tissue | Disease Stage |
| Page: 1 |
Top |
Single-cell gene regulatory network inference analysis |
| Find out the significant the regulons (TFs) and the target genes of each regulon across cell types for different disease states |
| TF | Cell Type | Tissue | Disease Stage | Target Gene | RSS | Regulon Activity |
| ∗The dot plots of a searched regulon are shown for all cell subpopulations in each disease state of each tissue based on the regulon specific score inferred using pySCENIC and by calculating the average expression. |
| Page: 1 |
Top |
Somatic mutation of malignant transformation related genes |
| Annotation of somatic variants for genes involved in malignant transformation |
| Hugo Symbol | Variant Class | Variant Classification | dbSNP RS | HGVSc | HGVSp | HGVSp Short | SWISSPROT | BIOTYPE | SIFT | PolyPhen | Tumor Sample Barcode | Tissue | Histology | Sex | Age | Stage | Therapy Types | Drugs | Outcome |
| BCHE | SNV | Missense_Mutation | c.1753T>A | p.Trp585Arg | p.W585R | P06276 | protein_coding | deleterious(0) | probably_damaging(0.998) | TCGA-A7-A0CE-01 | Breast | breast invasive carcinoma | Female | <65 | I/II | Chemotherapy | adriamycin | SD | |
| BCHE | SNV | Missense_Mutation | rs778566503 | c.1241N>A | p.Arg414His | p.R414H | P06276 | protein_coding | deleterious(0) | probably_damaging(0.967) | TCGA-A7-A4SA-01 | Breast | breast invasive carcinoma | Female | <65 | I/II | Chemotherapy | doxorubicin | CR |
| BCHE | SNV | Missense_Mutation | c.799N>A | p.Ala267Thr | p.A267T | P06276 | protein_coding | tolerated(0.1) | possibly_damaging(0.679) | TCGA-AC-A23H-01 | Breast | breast invasive carcinoma | Female | >=65 | I/II | Unknown | Unknown | PD | |
| BCHE | SNV | Missense_Mutation | novel | c.810N>T | p.Arg270Ser | p.R270S | P06276 | protein_coding | deleterious(0) | possibly_damaging(0.783) | TCGA-AC-A3BB-01 | Breast | breast invasive carcinoma | Female | <65 | III/IV | Chemotherapy | cytoxan | CR |
| BCHE | SNV | Missense_Mutation | novel | c.386C>T | p.Ala129Val | p.A129V | P06276 | protein_coding | tolerated(0.27) | benign(0) | TCGA-AO-A0JC-01 | Breast | breast invasive carcinoma | Female | <65 | I/II | Chemotherapy | fluorouracil | SD |
| BCHE | SNV | Missense_Mutation | c.1028C>A | p.Thr343Asn | p.T343N | P06276 | protein_coding | tolerated(0.06) | possibly_damaging(0.86) | TCGA-C8-A131-01 | Breast | breast invasive carcinoma | Female | >=65 | III/IV | Chemotherapy | 5-fluorouracil | CR | |
| BCHE | SNV | Missense_Mutation | c.644N>A | p.Gly215Glu | p.G215E | P06276 | protein_coding | deleterious(0) | probably_damaging(1) | TCGA-D8-A1JN-01 | Breast | breast invasive carcinoma | Female | >=65 | III/IV | Hormone Therapy | anastrozolum | SD | |
| BCHE | SNV | Missense_Mutation | c.1124N>T | p.Arg375Ile | p.R375I | P06276 | protein_coding | deleterious(0) | benign(0.153) | TCGA-D8-A27E-01 | Breast | breast invasive carcinoma | Female | >=65 | I/II | Hormone Therapy | tamoxiphen+anastrazolum | SD | |
| BCHE | SNV | Missense_Mutation | c.317G>T | p.Gly106Val | p.G106V | P06276 | protein_coding | deleterious(0) | probably_damaging(0.994) | TCGA-E9-A1NC-01 | Breast | breast invasive carcinoma | Female | <65 | I/II | Chemotherapy | doxorubicin | CR | |
| BCHE | deletion | Frame_Shift_Del | c.1586_1598delTAACCTTGAATAC | p.Leu529GlnfsTer6 | p.L529Qfs*6 | P06276 | protein_coding | TCGA-E2-A15S-01 | Breast | breast invasive carcinoma | Female | <65 | I/II | Chemotherapy | doxorubicin | SD |
| Page: 1 2 3 4 5 6 7 8 9 10 11 12 13 14 15 16 17 |
Top |
Related drugs of malignant transformation related genes |
| Identification of chemicals and drugs interact with genes involved in malignant transfromation |
| (DGIdb 4.0) |
| Entrez ID | Symbol | Category | Interaction Types | Drug Claim Name | Drug Name | PMIDs |
| 590 | BCHE | DRUGGABLE GENOME, ENZYME | RVT-103+RVT-104 | |||
| 590 | BCHE | DRUGGABLE GENOME, ENZYME | rivastigmine | RIVASTIGMINE | 18780301,25376930,17047484,12668920 | |
| 590 | BCHE | DRUGGABLE GENOME, ENZYME | IMMUNOTOXIN | 10198815 | ||
| 590 | BCHE | DRUGGABLE GENOME, ENZYME | MEPTAZINOL | MEPTAZINOL | ||
| 590 | BCHE | DRUGGABLE GENOME, ENZYME | Tetra-hydro-isoquinoline derivative 2 | |||
| 590 | BCHE | DRUGGABLE GENOME, ENZYME | Succinylcholine | SUXAMETHONIUM | ||
| 590 | BCHE | DRUGGABLE GENOME, ENZYME | Tetra-hydro-isoquinoline derivative 1 | |||
| 590 | BCHE | DRUGGABLE GENOME, ENZYME | RIVASTIGMINE | RIVASTIGMINE | ||
| 590 | BCHE | DRUGGABLE GENOME, ENZYME | ISOFLUROPHATE | ISOFLUROPHATE | ||
| 590 | BCHE | DRUGGABLE GENOME, ENZYME | Quinazoline alkaloid derivative 1 |
| Page: 1 2 3 4 5 6 7 |

Copyright 2023-Present -The University of Texas Health Science Center at Houston |