| Tissue | Expression Dynamics | Abbreviation |
| Endometrium |  | AEH: Atypical endometrial hyperplasia |
| EEC: Endometrioid Cancer |
| Esophagus | 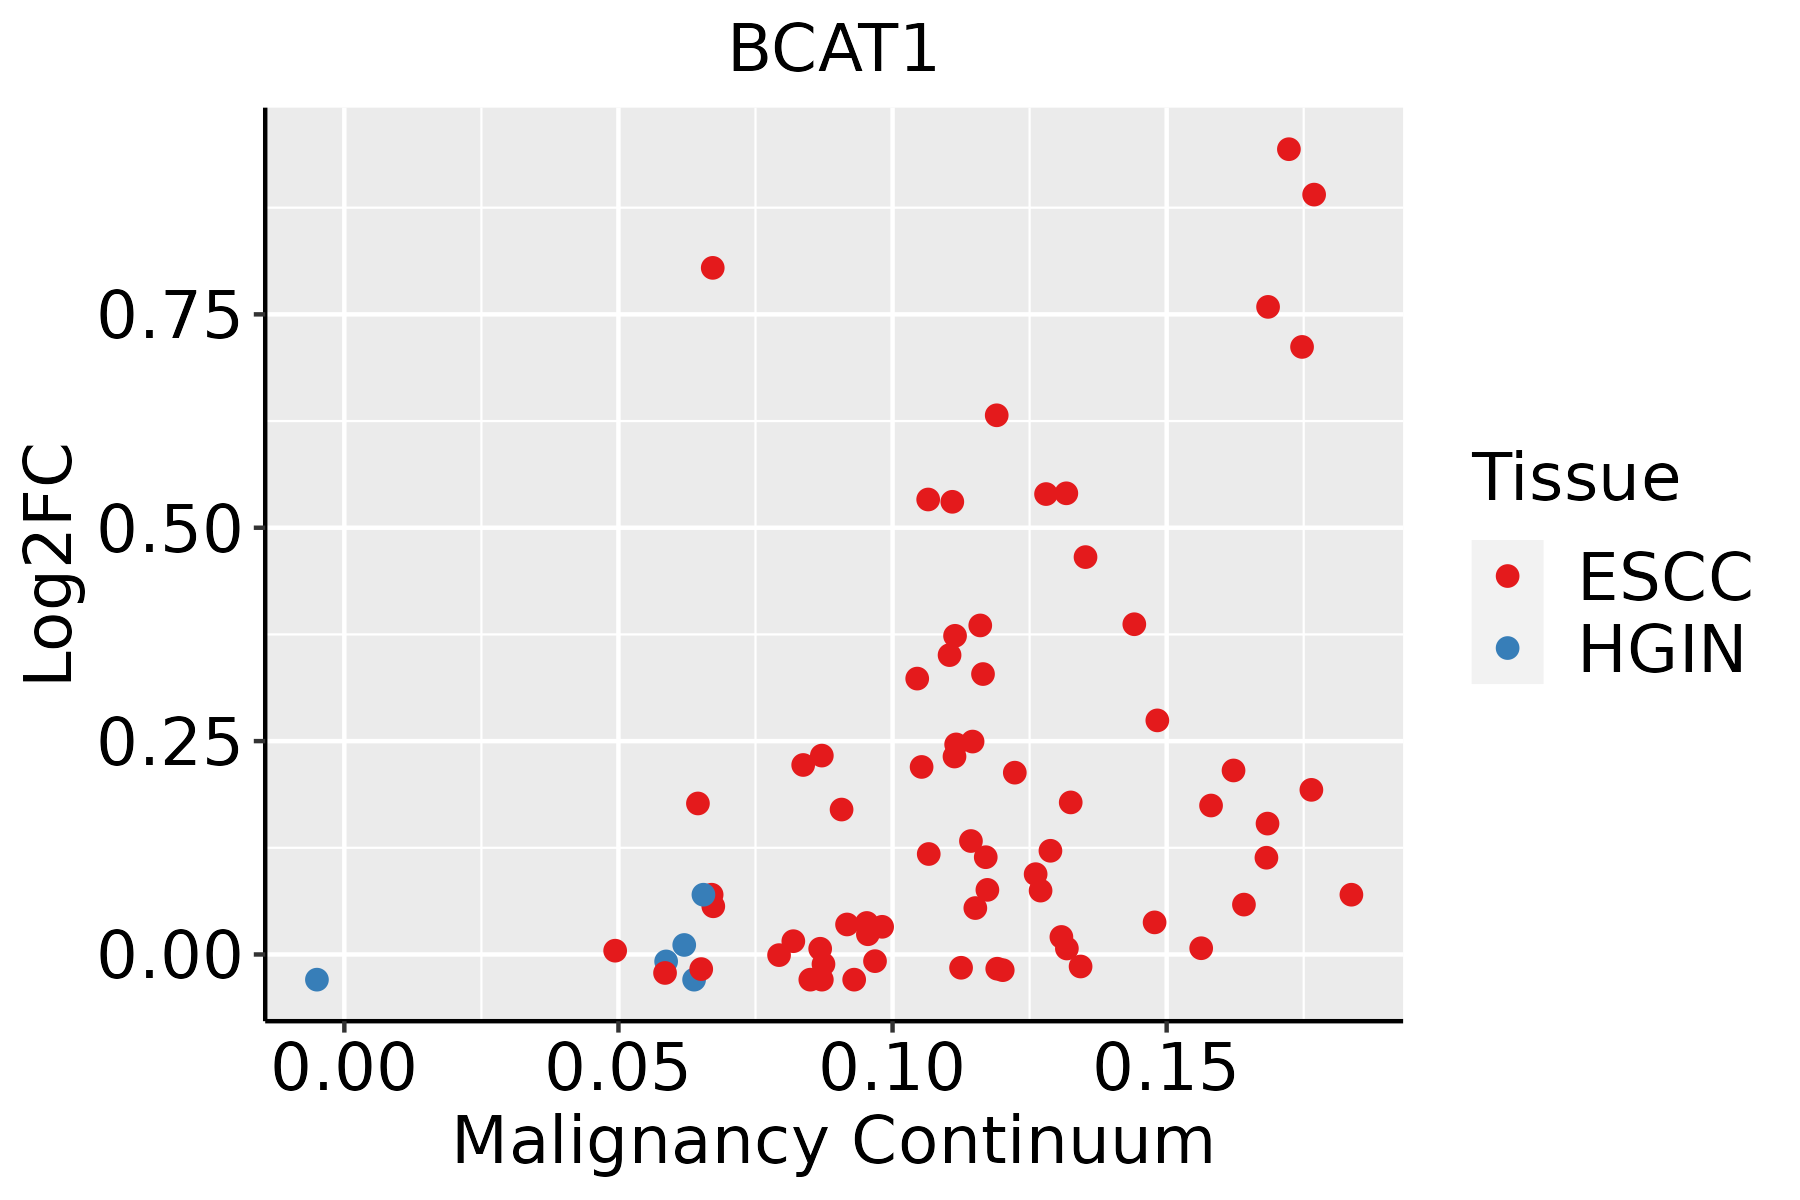 | ESCC: Esophageal squamous cell carcinoma |
| HGIN: High-grade intraepithelial neoplasias |
| LGIN: Low-grade intraepithelial neoplasias |
| Lung | 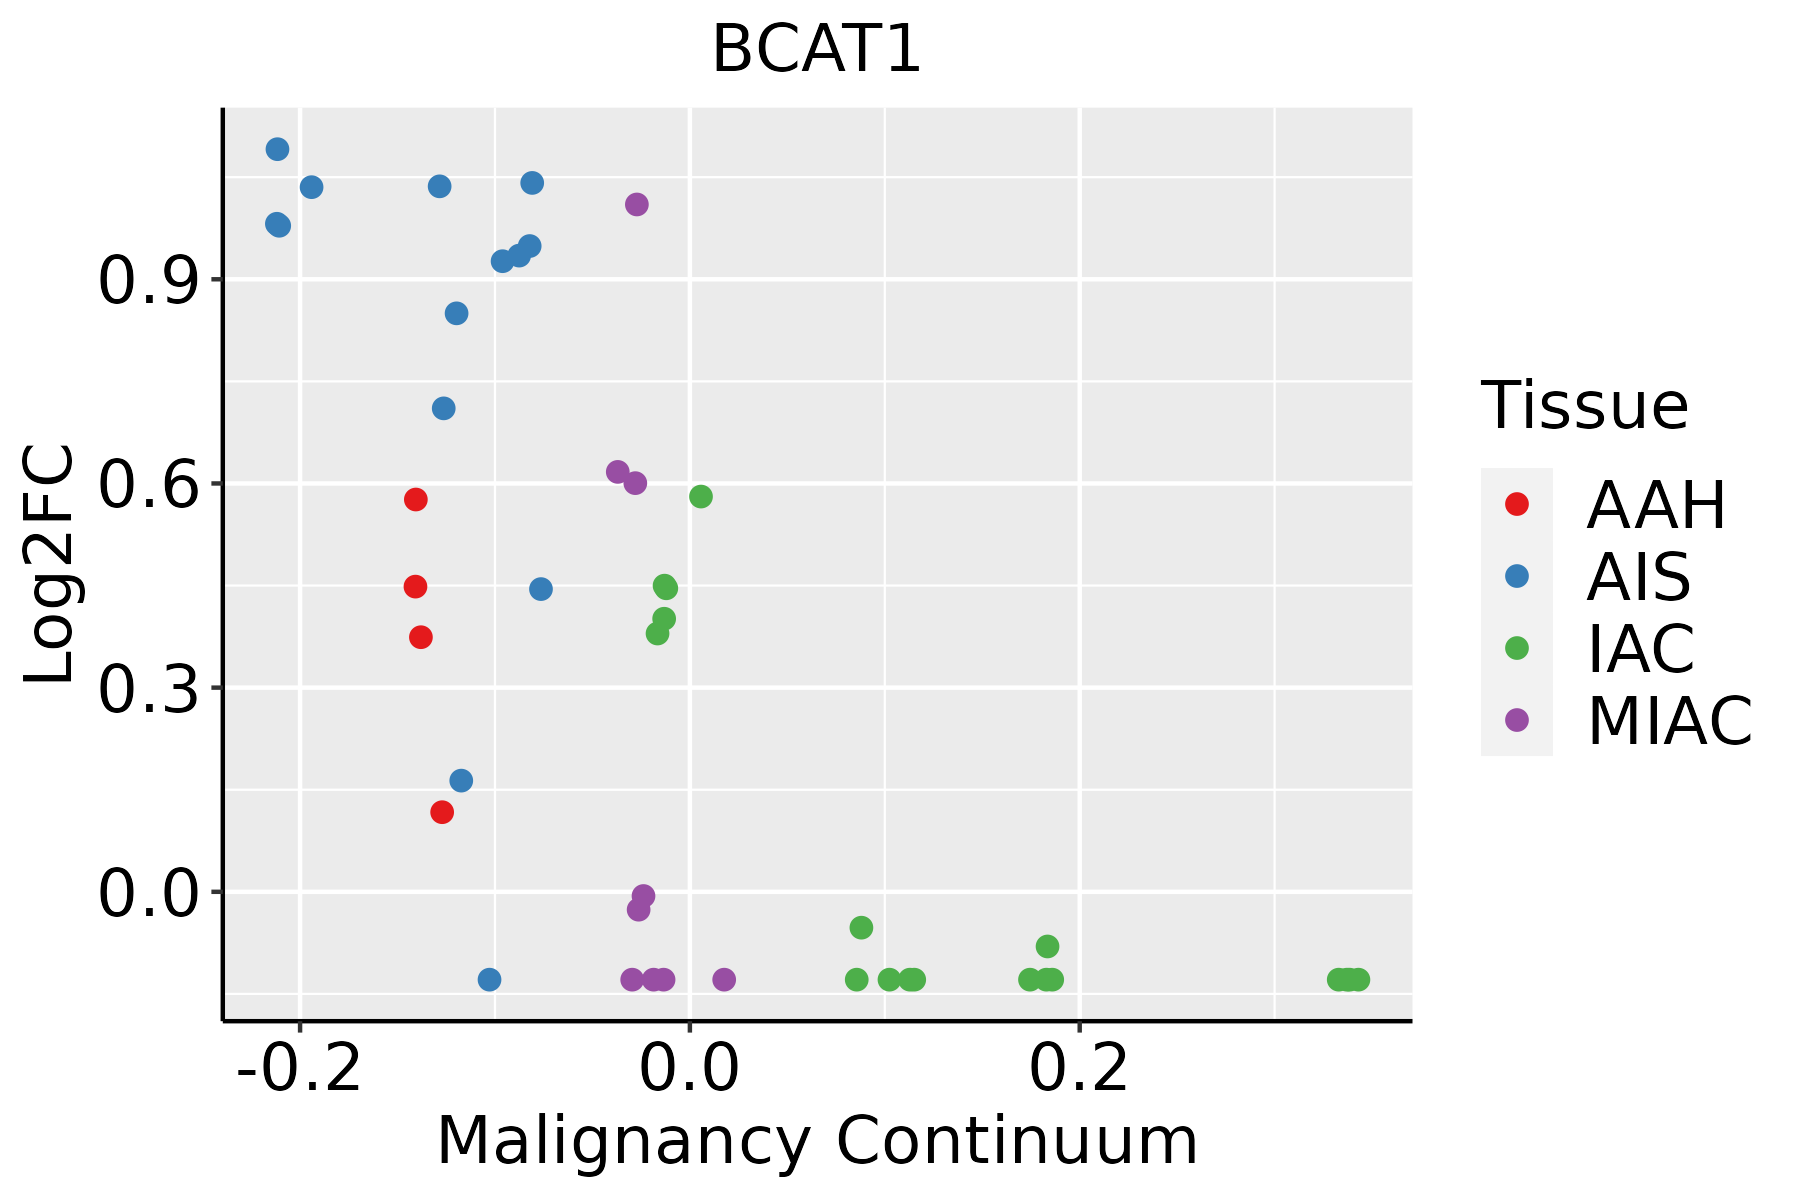 | AAH: Atypical adenomatous hyperplasia |
| AIS: Adenocarcinoma in situ |
| IAC: Invasive lung adenocarcinoma |
| MIA: Minimally invasive adenocarcinoma |
| Oral Cavity | 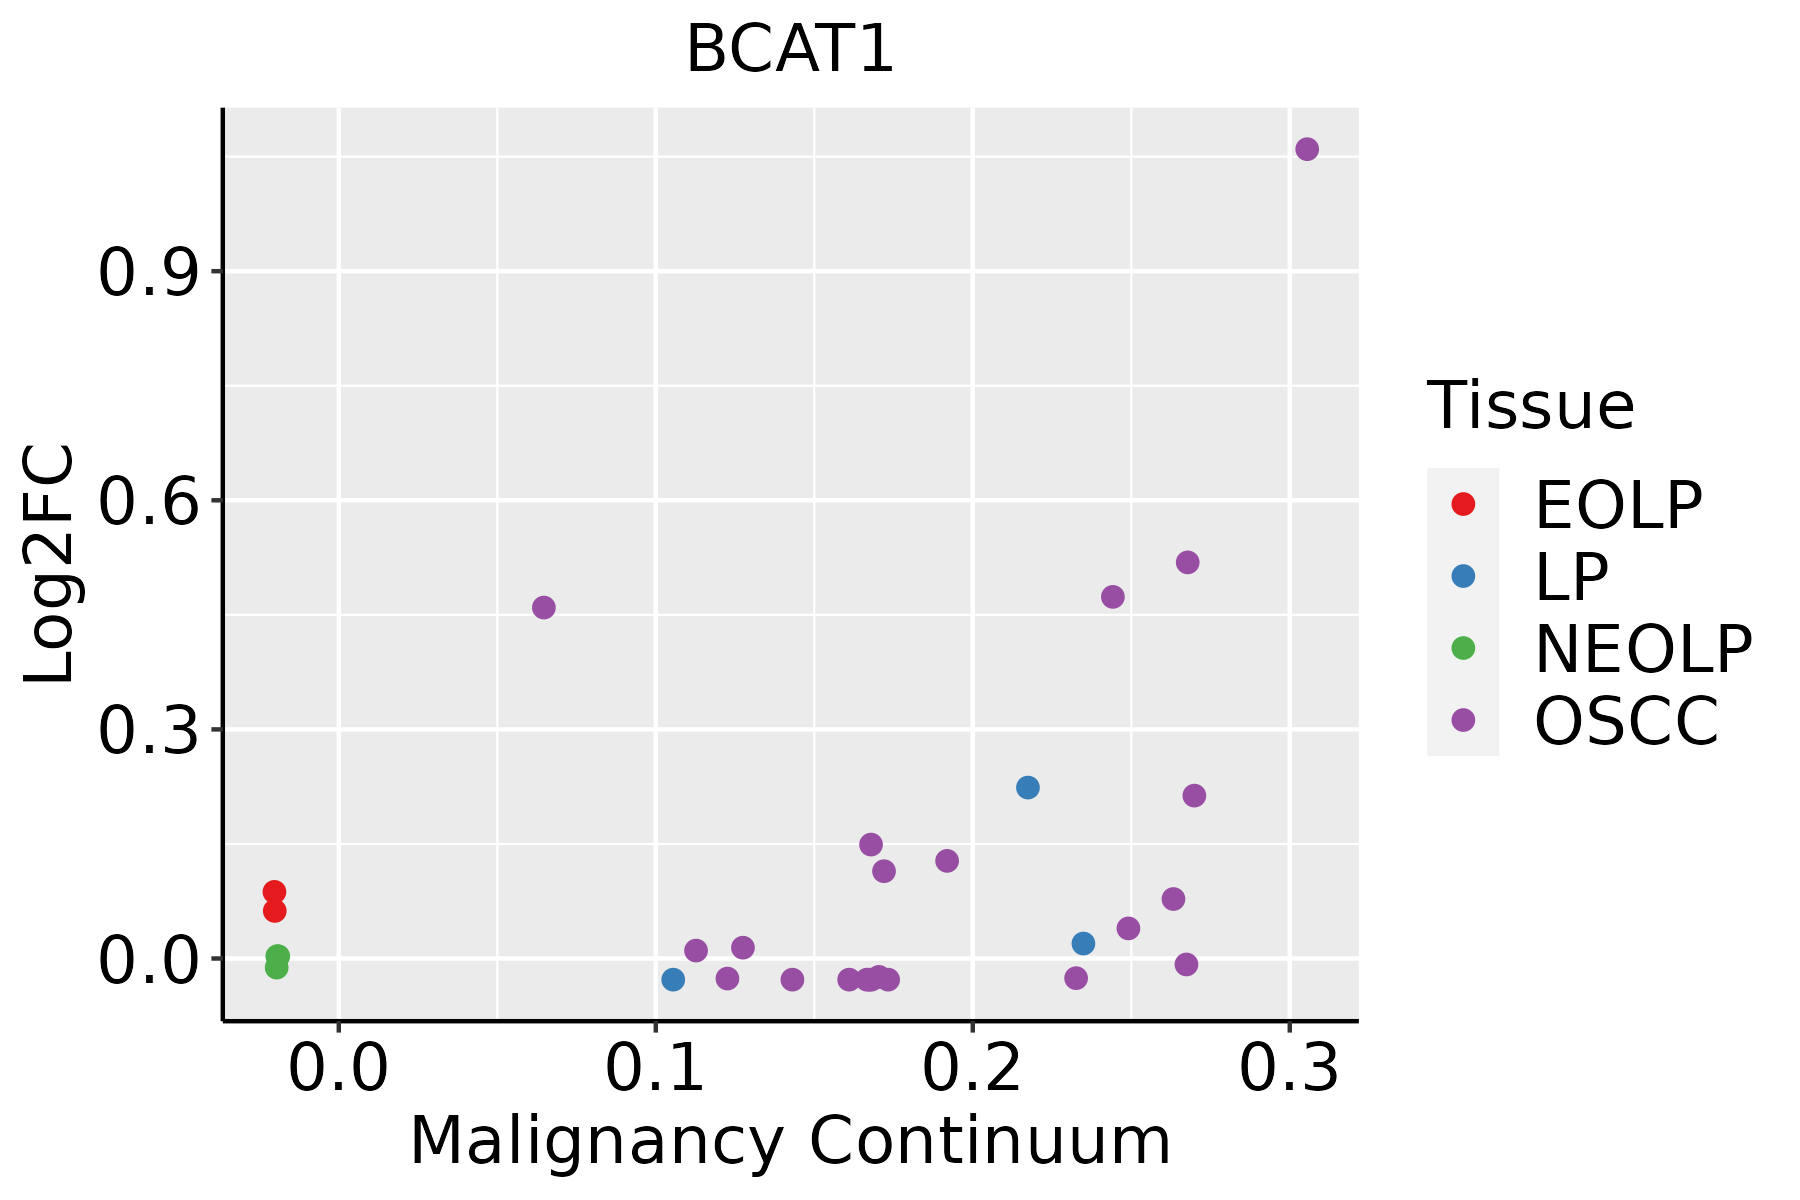 | EOLP: Erosive Oral lichen planus |
| LP: leukoplakia |
| NEOLP: Non-erosive oral lichen planus |
| OSCC: Oral squamous cell carcinoma |
| Thyroid | 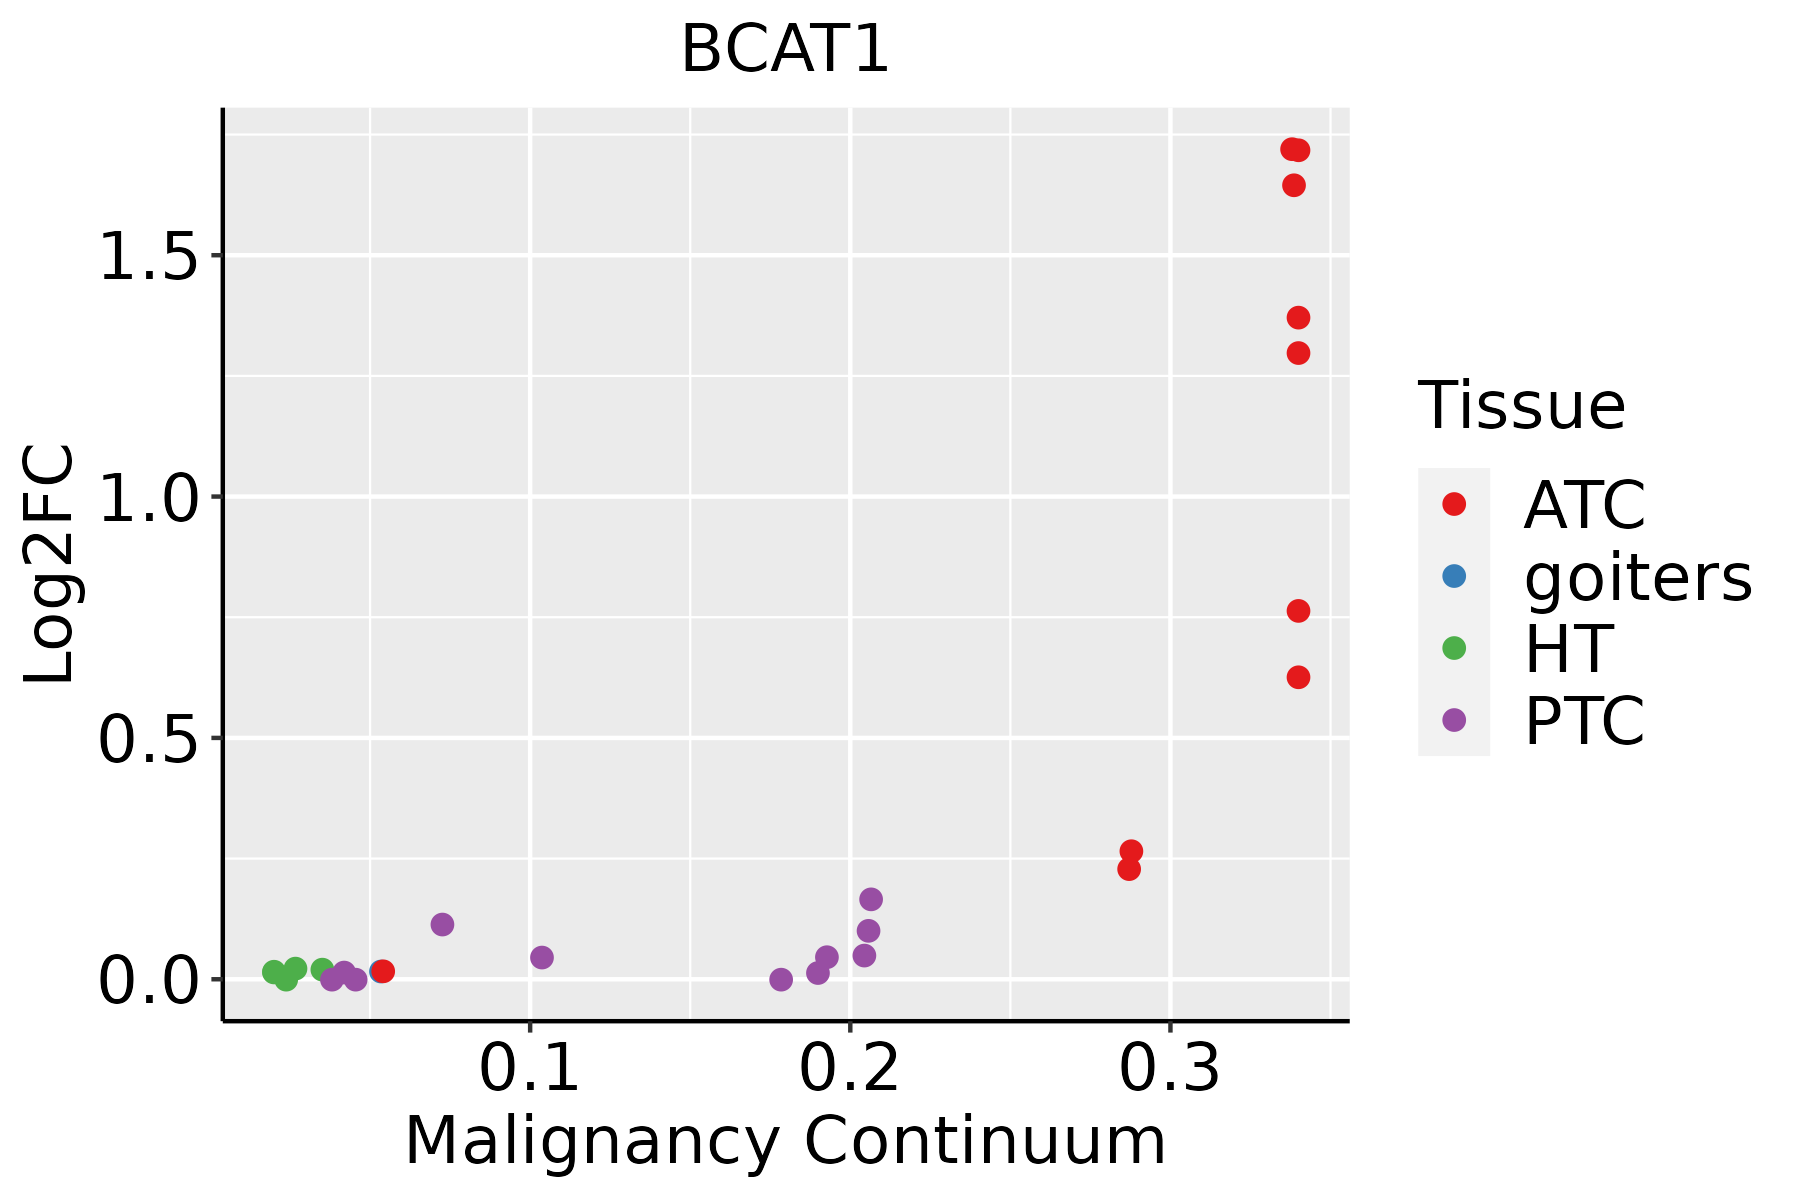 | ATC: Anaplastic thyroid cancer |
| HT: Hashimoto's thyroiditis |
| PTC: Papillary thyroid cancer |
| GO ID | Tissue | Disease Stage | Description | Gene Ratio | Bg Ratio | pvalue | p.adjust | Count |
| GO:004477213 | Endometrium | EEC | mitotic cell cycle phase transition | 71/2168 | 424/18723 | 8.68e-04 | 7.97e-03 | 71 |
| GO:004477216 | Esophagus | ESCC | mitotic cell cycle phase transition | 281/8552 | 424/18723 | 4.63e-18 | 4.45e-16 | 281 |
| GO:000008214 | Esophagus | ESCC | G1/S transition of mitotic cell cycle | 134/8552 | 214/18723 | 4.04e-07 | 5.55e-06 | 134 |
| GO:004484314 | Esophagus | ESCC | cell cycle G1/S phase transition | 148/8552 | 241/18723 | 5.68e-07 | 7.48e-06 | 148 |
| GO:00086525 | Esophagus | ESCC | cellular amino acid biosynthetic process | 51/8552 | 76/18723 | 1.30e-04 | 8.88e-04 | 51 |
| GO:00463948 | Esophagus | ESCC | carboxylic acid biosynthetic process | 175/8552 | 314/18723 | 1.98e-04 | 1.26e-03 | 175 |
| GO:00160538 | Esophagus | ESCC | organic acid biosynthetic process | 175/8552 | 316/18723 | 3.04e-04 | 1.82e-03 | 175 |
| GO:00090815 | Esophagus | ESCC | branched-chain amino acid metabolic process | 14/8552 | 19/18723 | 1.27e-02 | 4.21e-02 | 14 |
| GO:00447723 | Lung | IAC | mitotic cell cycle phase transition | 85/2061 | 424/18723 | 2.69e-08 | 3.20e-06 | 85 |
| GO:00000823 | Lung | IAC | G1/S transition of mitotic cell cycle | 46/2061 | 214/18723 | 6.13e-06 | 2.29e-04 | 46 |
| GO:00448433 | Lung | IAC | cell cycle G1/S phase transition | 49/2061 | 241/18723 | 1.54e-05 | 4.49e-04 | 49 |
| GO:004477211 | Lung | AIS | mitotic cell cycle phase transition | 69/1849 | 424/18723 | 2.23e-05 | 7.42e-04 | 69 |
| GO:000008211 | Lung | AIS | G1/S transition of mitotic cell cycle | 37/1849 | 214/18723 | 5.26e-04 | 8.42e-03 | 37 |
| GO:004484311 | Lung | AIS | cell cycle G1/S phase transition | 40/1849 | 241/18723 | 7.43e-04 | 1.07e-02 | 40 |
| GO:004477221 | Lung | MIAC | mitotic cell cycle phase transition | 41/967 | 424/18723 | 8.79e-05 | 3.92e-03 | 41 |
| GO:00447728 | Oral cavity | OSCC | mitotic cell cycle phase transition | 255/7305 | 424/18723 | 5.29e-19 | 6.98e-17 | 255 |
| GO:00000826 | Oral cavity | OSCC | G1/S transition of mitotic cell cycle | 120/7305 | 214/18723 | 2.86e-07 | 4.40e-06 | 120 |
| GO:00448436 | Oral cavity | OSCC | cell cycle G1/S phase transition | 131/7305 | 241/18723 | 8.77e-07 | 1.20e-05 | 131 |
| GO:00160537 | Oral cavity | OSCC | organic acid biosynthetic process | 155/7305 | 316/18723 | 1.64e-04 | 1.13e-03 | 155 |
| GO:00463947 | Oral cavity | OSCC | carboxylic acid biosynthetic process | 154/7305 | 314/18723 | 1.73e-04 | 1.19e-03 | 154 |
| Pathway ID | Tissue | Disease Stage | Description | Gene Ratio | Bg Ratio | pvalue | p.adjust | qvalue | Count |
| hsa002704 | Endometrium | EEC | Cysteine and methionine metabolism | 15/1237 | 52/8465 | 6.02e-03 | 3.12e-02 | 2.33e-02 | 15 |
| hsa0027011 | Endometrium | EEC | Cysteine and methionine metabolism | 15/1237 | 52/8465 | 6.02e-03 | 3.12e-02 | 2.33e-02 | 15 |
| hsa012405 | Esophagus | ESCC | Biosynthesis of cofactors | 97/4205 | 153/8465 | 3.88e-04 | 1.35e-03 | 6.94e-04 | 97 |
| hsa002809 | Esophagus | ESCC | Valine, leucine and isoleucine degradation | 34/4205 | 48/8465 | 2.34e-03 | 6.54e-03 | 3.35e-03 | 34 |
| hsa0123023 | Esophagus | ESCC | Biosynthesis of amino acids | 49/4205 | 75/8465 | 4.35e-03 | 1.12e-02 | 5.74e-03 | 49 |
| hsa0124012 | Esophagus | ESCC | Biosynthesis of cofactors | 97/4205 | 153/8465 | 3.88e-04 | 1.35e-03 | 6.94e-04 | 97 |
| hsa0028014 | Esophagus | ESCC | Valine, leucine and isoleucine degradation | 34/4205 | 48/8465 | 2.34e-03 | 6.54e-03 | 3.35e-03 | 34 |
| hsa0123033 | Esophagus | ESCC | Biosynthesis of amino acids | 49/4205 | 75/8465 | 4.35e-03 | 1.12e-02 | 5.74e-03 | 49 |
| hsa012404 | Oral cavity | OSCC | Biosynthesis of cofactors | 88/3704 | 153/8465 | 3.84e-04 | 1.20e-03 | 6.12e-04 | 88 |
| hsa012305 | Oral cavity | OSCC | Biosynthesis of amino acids | 45/3704 | 75/8465 | 3.27e-03 | 8.23e-03 | 4.19e-03 | 45 |
| hsa002808 | Oral cavity | OSCC | Valine, leucine and isoleucine degradation | 30/3704 | 48/8465 | 6.75e-03 | 1.57e-02 | 7.99e-03 | 30 |
| hsa0124011 | Oral cavity | OSCC | Biosynthesis of cofactors | 88/3704 | 153/8465 | 3.84e-04 | 1.20e-03 | 6.12e-04 | 88 |
| hsa0123012 | Oral cavity | OSCC | Biosynthesis of amino acids | 45/3704 | 75/8465 | 3.27e-03 | 8.23e-03 | 4.19e-03 | 45 |
| hsa0028013 | Oral cavity | OSCC | Valine, leucine and isoleucine degradation | 30/3704 | 48/8465 | 6.75e-03 | 1.57e-02 | 7.99e-03 | 30 |
| Hugo Symbol | Variant Class | Variant Classification | dbSNP RS | HGVSc | HGVSp | HGVSp Short | SWISSPROT | BIOTYPE | SIFT | PolyPhen | Tumor Sample Barcode | Tissue | Histology | Sex | Age | Stage | Therapy Types | Drugs | Outcome |
| BCAT1 | SNV | Missense_Mutation | | c.89N>T | p.Ser30Leu | p.S30L | P54687 | protein_coding | tolerated(0.06) | benign(0.001) | TCGA-A8-A0A7-01 | Breast | breast invasive carcinoma | Female | <65 | I/II | Unknown | Unknown | SD |
| BCAT1 | SNV | Missense_Mutation | | c.875C>T | p.Pro292Leu | p.P292L | P54687 | protein_coding | deleterious(0) | probably_damaging(0.997) | TCGA-B6-A1KN-01 | Breast | breast invasive carcinoma | Female | <65 | III/IV | Unknown | Unknown | SD |
| BCAT1 | SNV | Missense_Mutation | rs766214085 | c.524G>A | p.Arg175His | p.R175H | P54687 | protein_coding | deleterious(0) | probably_damaging(1) | TCGA-D8-A1XQ-01 | Breast | breast invasive carcinoma | Female | >=65 | I/II | Unknown | Unknown | SD |
| BCAT1 | SNV | Missense_Mutation | | c.1187N>C | p.Val396Ala | p.V396A | P54687 | protein_coding | deleterious(0.03) | benign(0.099) | TCGA-E2-A150-01 | Breast | breast invasive carcinoma | Female | <65 | I/II | Chemotherapy | doxorubicin | SD |
| BCAT1 | SNV | Missense_Mutation | rs377651136 | c.1127G>A | p.Arg376His | p.R376H | P54687 | protein_coding | deleterious(0) | possibly_damaging(0.88) | TCGA-E2-A15K-06 | Breast | breast invasive carcinoma | Female | <65 | I/II | Chemotherapy | adriamycin | SD |
| BCAT1 | insertion | Frame_Shift_Ins | novel | c.784_785insATAGGAGGTATAAACAGAGTTCTTTCGGTAATAGCCTGCCGTCT | p.Gly262AspfsTer27 | p.G262Dfs*27 | P54687 | protein_coding | | | TCGA-A8-A09B-01 | Breast | breast invasive carcinoma | Female | <65 | III/IV | Chemotherapy | 5-fluorouracil | SD |
| BCAT1 | insertion | Nonsense_Mutation | novel | c.731_732insAATGTATCCAAGGAATACATAA | p.Phe244LeufsTer8 | p.F244Lfs*8 | P54687 | protein_coding | | | TCGA-AO-A0J5-01 | Breast | breast invasive carcinoma | Female | <65 | III/IV | Other, specify in notesBisphosphonate | zoledronic | PD |
| BCAT1 | SNV | Missense_Mutation | novel | c.79G>C | p.Glu27Gln | p.E27Q | P54687 | protein_coding | tolerated(0.36) | benign(0.154) | TCGA-C5-A8XJ-01 | Cervix | cervical & endocervical cancer | Female | >=65 | I/II | Chemotherapy | cisplatin | SD |
| BCAT1 | SNV | Missense_Mutation | | c.576A>C | p.Lys192Asn | p.K192N | P54687 | protein_coding | tolerated(0.08) | benign(0.03) | TCGA-AA-3492-01 | Colorectum | colon adenocarcinoma | Female | >=65 | I/II | Unknown | Unknown | SD |
| BCAT1 | SNV | Missense_Mutation | | c.125N>C | p.Leu42Pro | p.L42P | P54687 | protein_coding | deleterious(0) | probably_damaging(0.992) | TCGA-AA-3502-01 | Colorectum | colon adenocarcinoma | Male | >=65 | I/II | Unknown | Unknown | SD |


