
|
|||||
|
 | |
| |
| |
| |
| |
| |
|
Gene: BCAS4 |
Gene summary for BCAS4 |
| Gene information | Species | Human | Gene symbol | BCAS4 | Gene ID | 55653 |
| Gene name | breast carcinoma amplified sequence 4 | |
| Gene Alias | CNOL | |
| Cytomap | 20q13.13 | |
| Gene Type | protein-coding | GO ID | GO:0005575 | UniProtAcc | Q8TDM0 |
Top |
Malignant transformation analysis |
| Identification of the aberrant gene expression in precancerous and cancerous lesions by comparing the gene expression of stem-like cells in diseased tissues with normal stem cells |
| Entrez ID | Symbol | Replicates | Species | Organ | Tissue | Adj P-value | Log2FC | Malignancy |
| 55653 | BCAS4 | GSM4909281 | Human | Breast | IDC | 6.95e-03 | 1.26e-01 | 0.21 |
| 55653 | BCAS4 | GSM4909286 | Human | Breast | IDC | 4.32e-07 | 2.37e-01 | 0.1081 |
| 55653 | BCAS4 | GSM4909293 | Human | Breast | IDC | 2.90e-02 | 1.13e-01 | 0.1581 |
| 55653 | BCAS4 | GSM4909298 | Human | Breast | IDC | 2.15e-06 | 1.85e-01 | 0.1551 |
| 55653 | BCAS4 | GSM4909301 | Human | Breast | IDC | 1.20e-05 | 2.71e-01 | 0.1577 |
| 55653 | BCAS4 | GSM4909302 | Human | Breast | IDC | 1.87e-06 | 2.76e-01 | 0.1545 |
| 55653 | BCAS4 | GSM4909304 | Human | Breast | IDC | 2.46e-11 | 3.47e-01 | 0.1636 |
| 55653 | BCAS4 | GSM4909306 | Human | Breast | IDC | 5.69e-05 | 1.59e-01 | 0.1564 |
| 55653 | BCAS4 | GSM4909307 | Human | Breast | IDC | 1.17e-11 | 3.53e-01 | 0.1569 |
| 55653 | BCAS4 | GSM4909308 | Human | Breast | IDC | 8.28e-25 | 5.03e-01 | 0.158 |
| 55653 | BCAS4 | GSM4909315 | Human | Breast | IDC | 4.27e-02 | 1.51e-01 | 0.21 |
| 55653 | BCAS4 | GSM4909317 | Human | Breast | IDC | 7.96e-07 | 2.31e-01 | 0.1355 |
| 55653 | BCAS4 | GSM4909319 | Human | Breast | IDC | 4.34e-06 | 1.57e-01 | 0.1563 |
| 55653 | BCAS4 | GSM4909321 | Human | Breast | IDC | 9.70e-05 | 2.67e-01 | 0.1559 |
| 55653 | BCAS4 | ctrl6 | Human | Breast | Precancer | 4.57e-08 | 3.62e-01 | -0.0061 |
| 55653 | BCAS4 | brca2 | Human | Breast | Precancer | 8.35e-03 | 1.51e-01 | -0.024 |
| 55653 | BCAS4 | brca3 | Human | Breast | Precancer | 2.73e-03 | 1.16e-01 | -0.0263 |
| 55653 | BCAS4 | brca10 | Human | Breast | Precancer | 8.61e-26 | 6.11e-01 | -0.0029 |
| 55653 | BCAS4 | M1 | Human | Breast | IDC | 1.17e-09 | 3.35e-01 | 0.1577 |
| 55653 | BCAS4 | DCIS2 | Human | Breast | DCIS | 4.20e-05 | -2.66e-02 | 0.0085 |
| Page: 1 2 3 4 5 6 7 |
| Tissue | Expression Dynamics | Abbreviation |
| Breast | 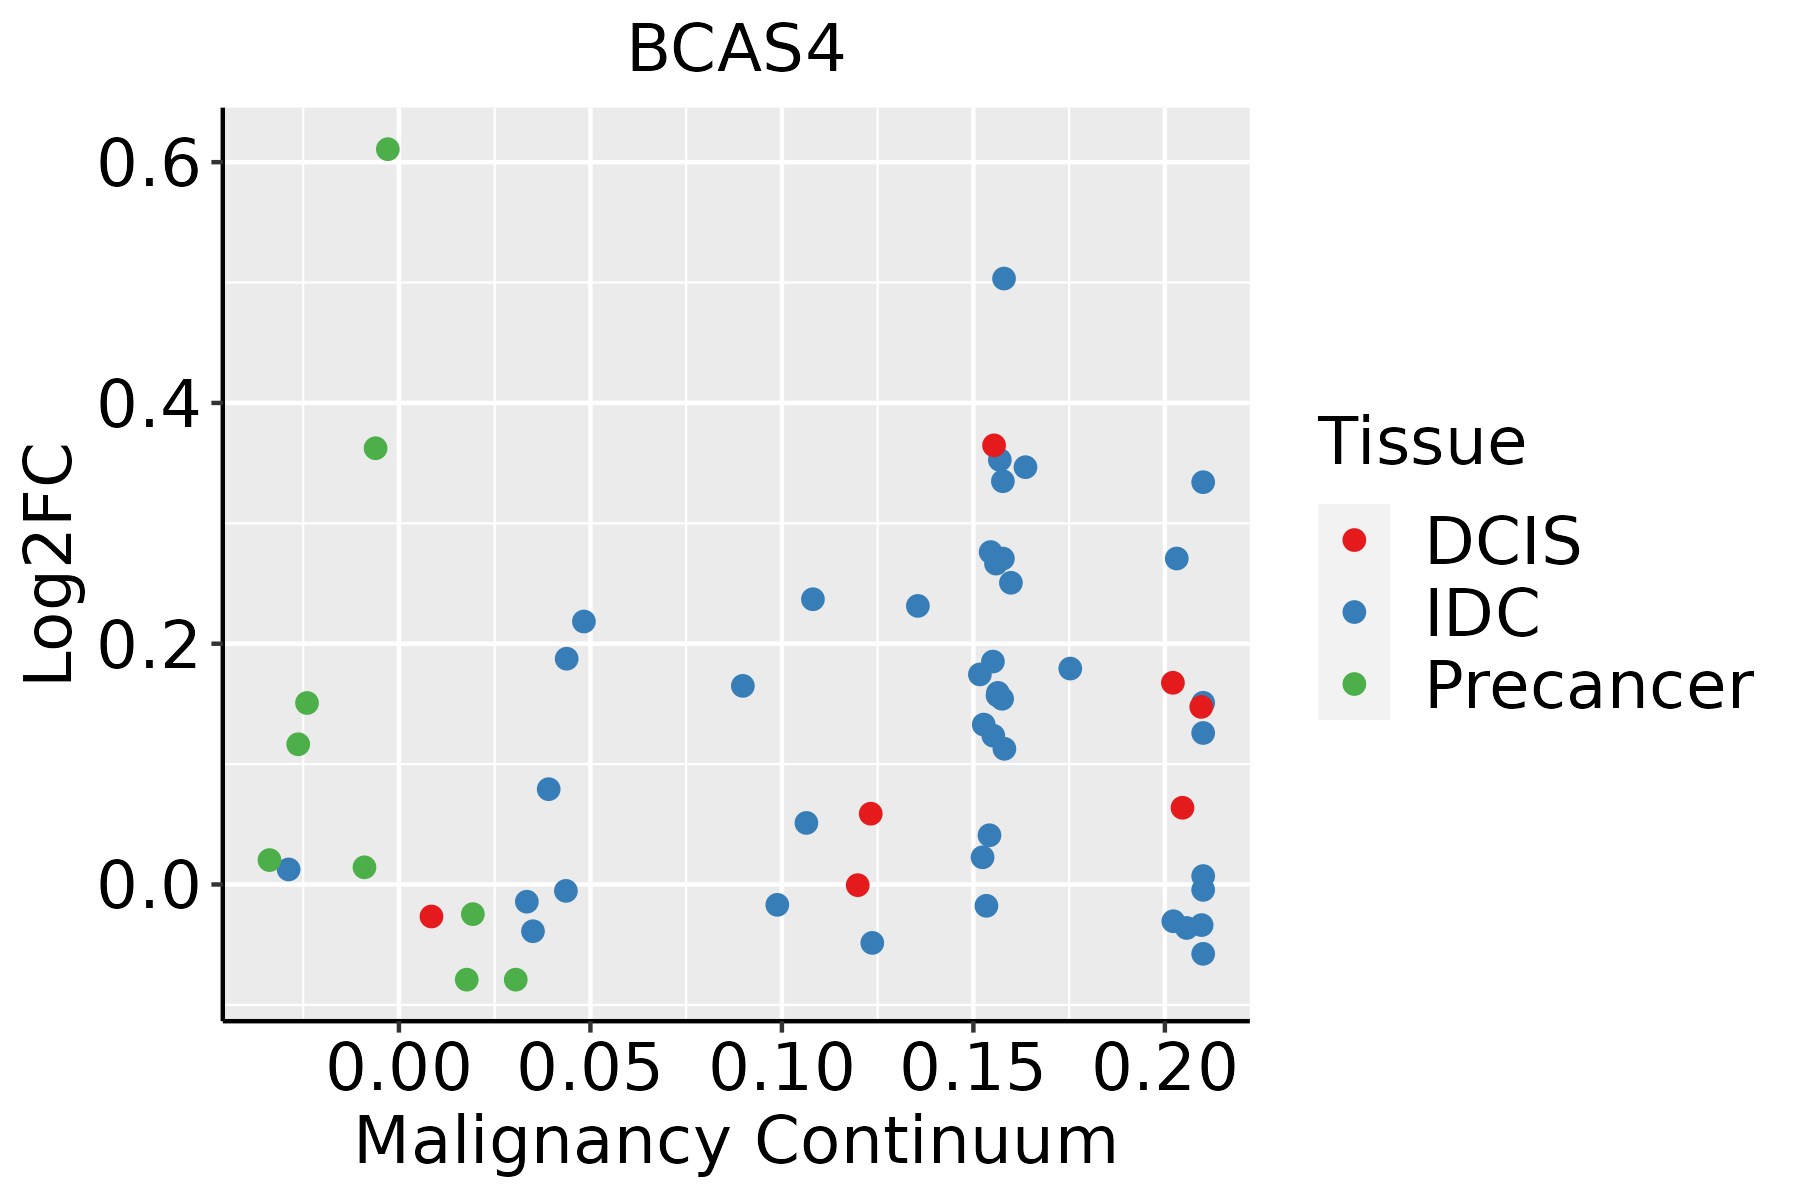 | IDC: Invasive ductal carcinoma |
| DCIS: Ductal carcinoma in situ | ||
| Precancer(BRCA1-mut): Precancerous lesion from BRCA1 mutation carriers | ||
| Colorectum (GSE201348) |  | FAP: Familial adenomatous polyposis |
| CRC: Colorectal cancer | ||
| Colorectum (HTA11) |  | AD: Adenomas |
| SER: Sessile serrated lesions | ||
| MSI-H: Microsatellite-high colorectal cancer | ||
| MSS: Microsatellite stable colorectal cancer | ||
| Esophagus | 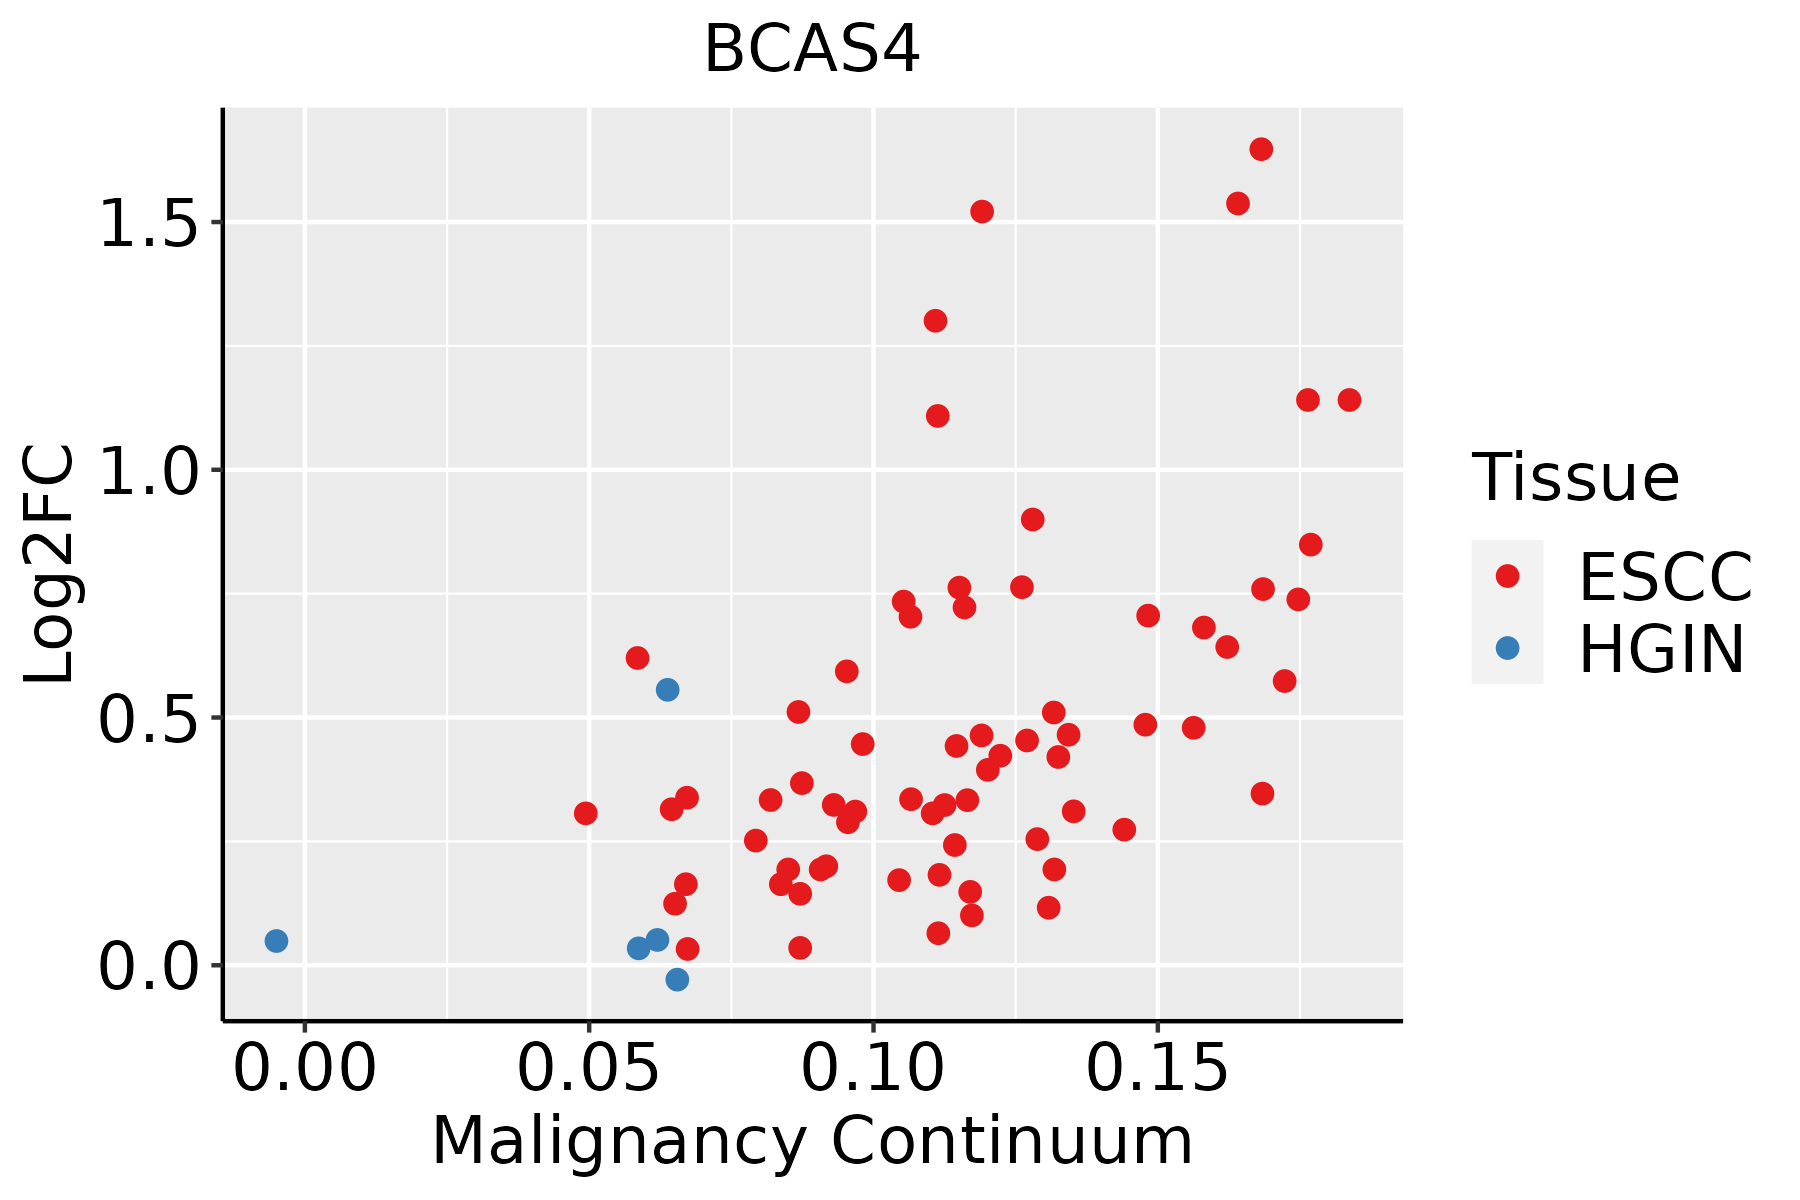 | ESCC: Esophageal squamous cell carcinoma |
| HGIN: High-grade intraepithelial neoplasias | ||
| LGIN: Low-grade intraepithelial neoplasias | ||
| Oral Cavity |  | EOLP: Erosive Oral lichen planus |
| LP: leukoplakia | ||
| NEOLP: Non-erosive oral lichen planus | ||
| OSCC: Oral squamous cell carcinoma | ||
| Thyroid | 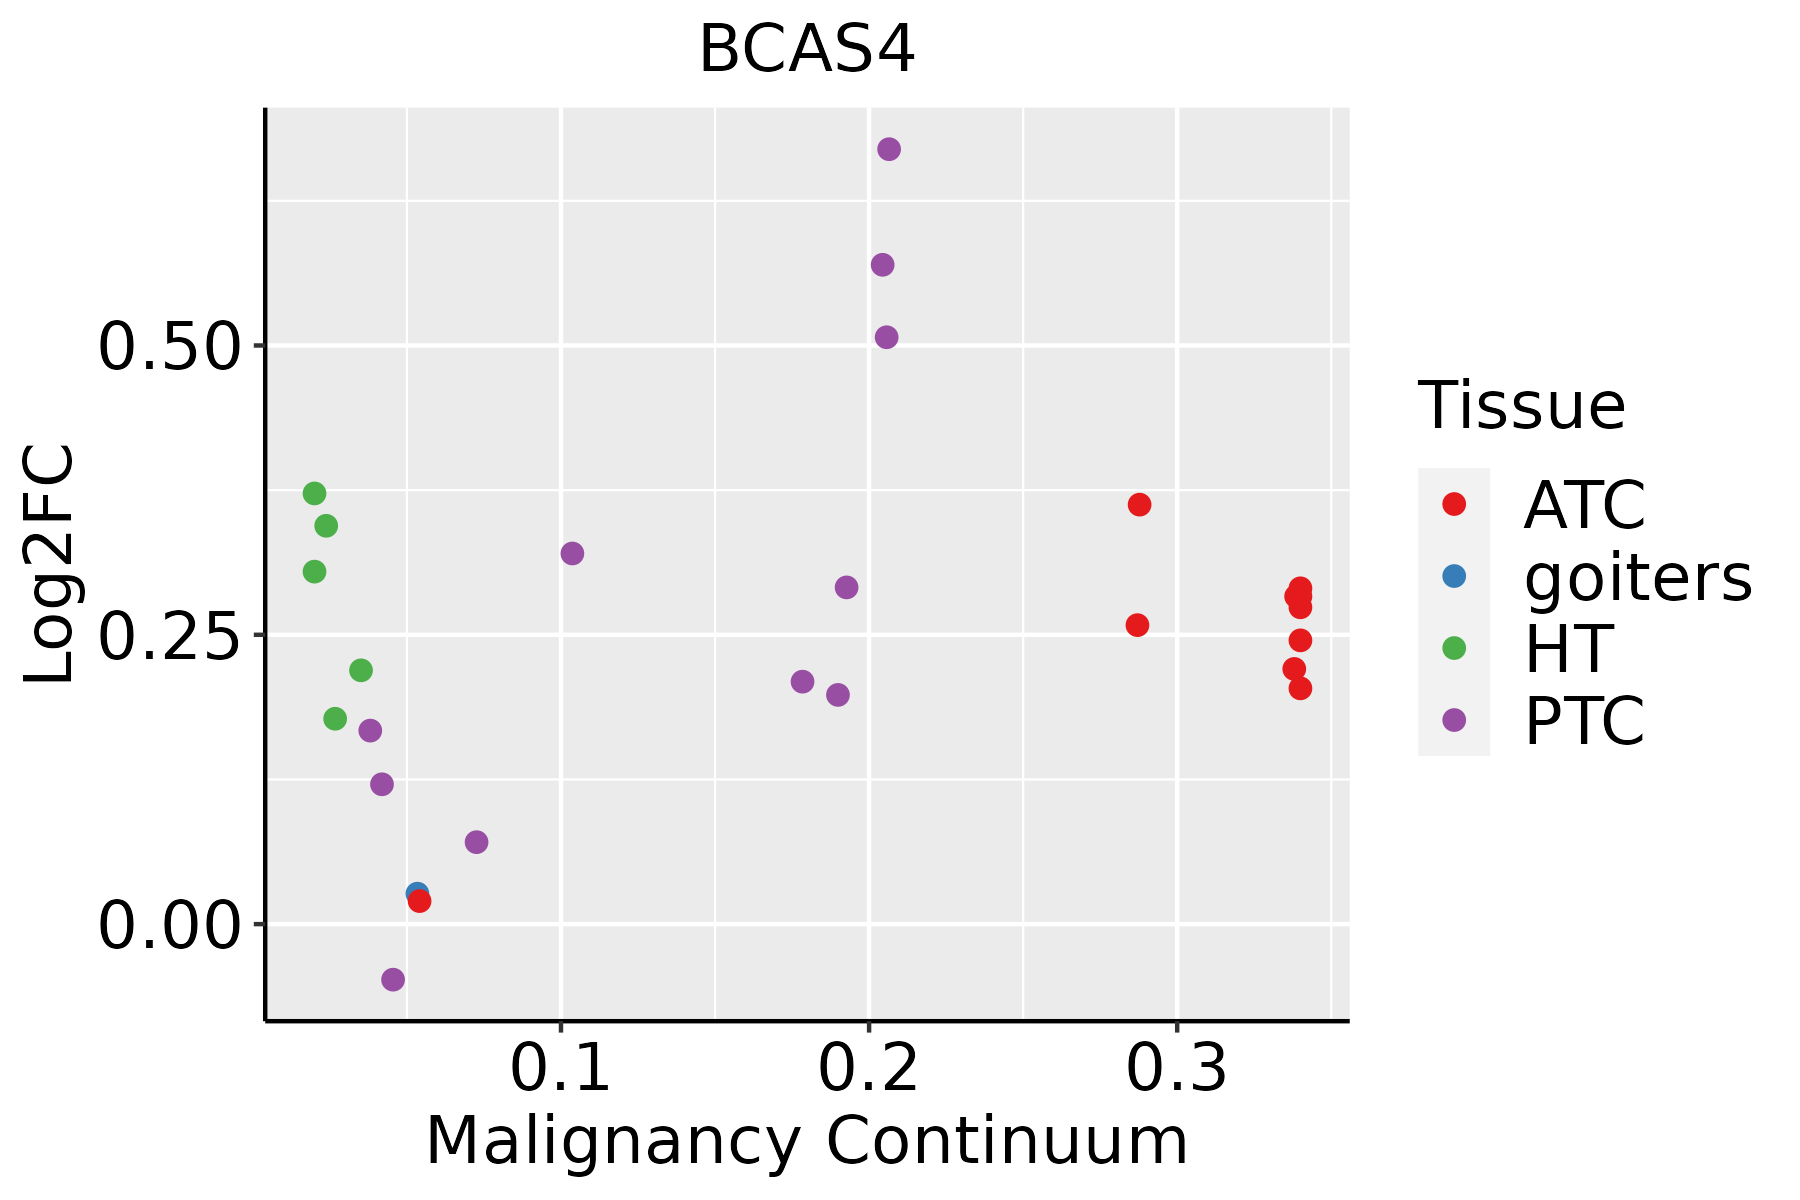 | ATC: Anaplastic thyroid cancer |
| HT: Hashimoto's thyroiditis | ||
| PTC: Papillary thyroid cancer |
| ∗log2FC in expression of this searched gene in stem-like cells from each diseased tissue sample relative to stem-like cells in normal samples in each tissue plotted against the malignancy continuum. Samples are colored based on if they are from different disease stage. |
Top |
Malignant transformation related pathway analysis |
| Find out the enriched GO biological processes and KEGG pathways involved in transition from healthy to precancer to cancer |
| Tissue | Disease Stage | Enriched GO biological Processes |
| Colorectum | AD |  |
| Colorectum | SER |  |
| Colorectum | MSS |  |
| Colorectum | MSI-H |  |
| Colorectum | FAP |  |
| ∗Top 15 enriched GO BP terms are showed in the bar plot of each disease state in each tissue. Each row represents a significant GO biological process which is colored according to the -log10(p.adjust). |
| Page: 1 2 3 4 5 6 7 8 9 |
| GO ID | Tissue | Disease Stage | Description | Gene Ratio | Bg Ratio | pvalue | p.adjust | Count |
| Page: 1 |
| Pathway ID | Tissue | Disease Stage | Description | Gene Ratio | Bg Ratio | pvalue | p.adjust | qvalue | Count |
| Page: 1 |
Top |
Cell-cell communication analysis |
| Identification of potential cell-cell interactions between two cell types and their ligand-receptor pairs for different disease states |
| Ligand | Receptor | LRpair | Pathway | Tissue | Disease Stage |
| Page: 1 |
Top |
Single-cell gene regulatory network inference analysis |
| Find out the significant the regulons (TFs) and the target genes of each regulon across cell types for different disease states |
| TF | Cell Type | Tissue | Disease Stage | Target Gene | RSS | Regulon Activity |
| ∗The dot plots of a searched regulon are shown for all cell subpopulations in each disease state of each tissue based on the regulon specific score inferred using pySCENIC and by calculating the average expression. |
| Page: 1 |
Top |
Somatic mutation of malignant transformation related genes |
| Annotation of somatic variants for genes involved in malignant transformation |
| Hugo Symbol | Variant Class | Variant Classification | dbSNP RS | HGVSc | HGVSp | HGVSp Short | SWISSPROT | BIOTYPE | SIFT | PolyPhen | Tumor Sample Barcode | Tissue | Histology | Sex | Age | Stage | Therapy Types | Drugs | Outcome |
| BCAS4 | SNV | Missense_Mutation | rs375780908 | c.403N>A | p.Val135Met | p.V135M | Q8TDM0 | protein_coding | deleterious(0.01) | probably_damaging(0.999) | TCGA-AA-3864-01 | Colorectum | colon adenocarcinoma | Male | >=65 | I/II | Unknown | Unknown | SD |
| BCAS4 | SNV | Missense_Mutation | novel | c.195N>T | p.Glu65Asp | p.E65D | Q8TDM0 | protein_coding | tolerated(0.26) | probably_damaging(0.994) | TCGA-AJ-A3BH-01 | Endometrium | uterine corpus endometrioid carcinoma | Female | Unknown | I/II | Unknown | Unknown | SD |
| BCAS4 | SNV | Missense_Mutation | rs564853296 | c.613N>A | p.Val205Ile | p.V205I | Q8TDM0 | protein_coding | tolerated_low_confidence(0.43) | benign(0.015) | TCGA-AP-A056-01 | Endometrium | uterine corpus endometrioid carcinoma | Female | <65 | I/II | Unknown | Unknown | SD |
| BCAS4 | SNV | Missense_Mutation | novel | c.617N>A | p.Arg206Gln | p.R206Q | Q8TDM0 | protein_coding | tolerated_low_confidence(0.28) | benign(0) | TCGA-AP-A0LM-01 | Endometrium | uterine corpus endometrioid carcinoma | Female | <65 | III/IV | Chemotherapy | cisplatin | SD |
| BCAS4 | SNV | Missense_Mutation | novel | c.181N>A | p.Ala61Thr | p.A61T | Q8TDM0 | protein_coding | deleterious(0.02) | possibly_damaging(0.726) | TCGA-AX-A06F-01 | Endometrium | uterine corpus endometrioid carcinoma | Female | <65 | III/IV | Chemotherapy | carboplatin | SD |
| BCAS4 | SNV | Missense_Mutation | rs202162521 | c.449N>A | p.Arg150Gln | p.R150Q | Q8TDM0 | protein_coding | tolerated(0.1) | benign(0.029) | TCGA-BG-A220-01 | Endometrium | uterine corpus endometrioid carcinoma | Female | >=65 | I/II | Unknown | Unknown | SD |
| BCAS4 | SNV | Missense_Mutation | rs771780945 | c.448N>T | p.Arg150Trp | p.R150W | Q8TDM0 | protein_coding | tolerated(0.06) | benign(0.023) | TCGA-D1-A2G5-01 | Endometrium | uterine corpus endometrioid carcinoma | Female | <65 | I/II | Unknown | Unknown | PD |
| BCAS4 | SNV | Missense_Mutation | c.376C>T | p.His126Tyr | p.H126Y | Q8TDM0 | protein_coding | tolerated(0.13) | possibly_damaging(0.447) | TCGA-EO-A22R-01 | Endometrium | uterine corpus endometrioid carcinoma | Female | <65 | I/II | Unknown | Unknown | SD | |
| BCAS4 | SNV | Missense_Mutation | novel | c.445C>A | p.Leu149Met | p.L149M | Q8TDM0 | protein_coding | tolerated(0.06) | probably_damaging(0.965) | TCGA-EO-A3KX-01 | Endometrium | uterine corpus endometrioid carcinoma | Female | >=65 | I/II | Unknown | Unknown | SD |
| BCAS4 | SNV | Missense_Mutation | c.269N>T | p.Ser90Leu | p.S90L | Q8TDM0 | protein_coding | deleterious(0.03) | possibly_damaging(0.701) | TCGA-55-7995-01 | Lung | lung adenocarcinoma | Female | >=65 | I/II | Chemotherapy | carboplatin | CR |
| Page: 1 2 |
Top |
Related drugs of malignant transformation related genes |
| Identification of chemicals and drugs interact with genes involved in malignant transfromation |
| (DGIdb 4.0) |
| Entrez ID | Symbol | Category | Interaction Types | Drug Claim Name | Drug Name | PMIDs |
| Page: 1 |

Copyright 2023-Present -The University of Texas Health Science Center at Houston |