| Tissue | Expression Dynamics | Abbreviation |
| Cervix | 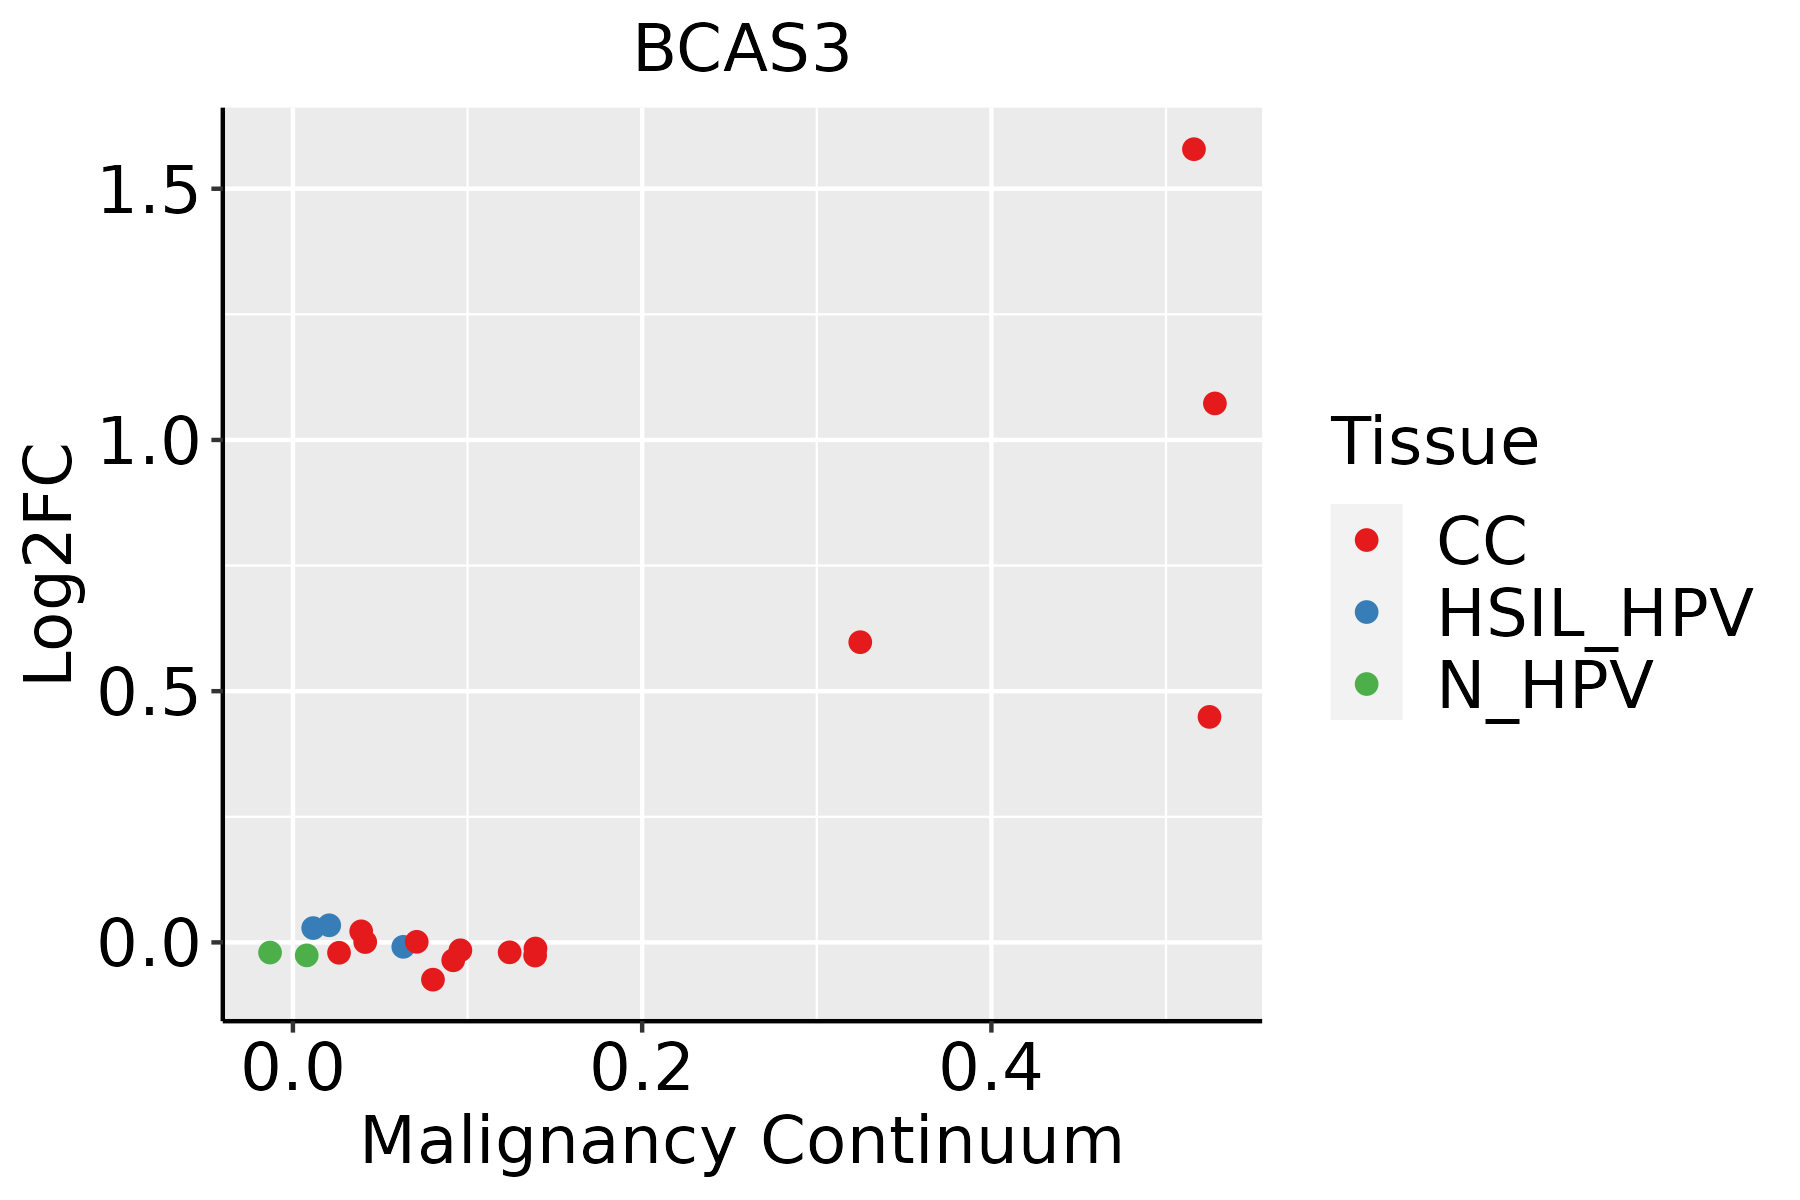 | CC: Cervix cancer |
| HSIL_HPV: HPV-infected high-grade squamous intraepithelial lesions |
| N_HPV: HPV-infected normal cervix |
| Colorectum (GSE201348) | 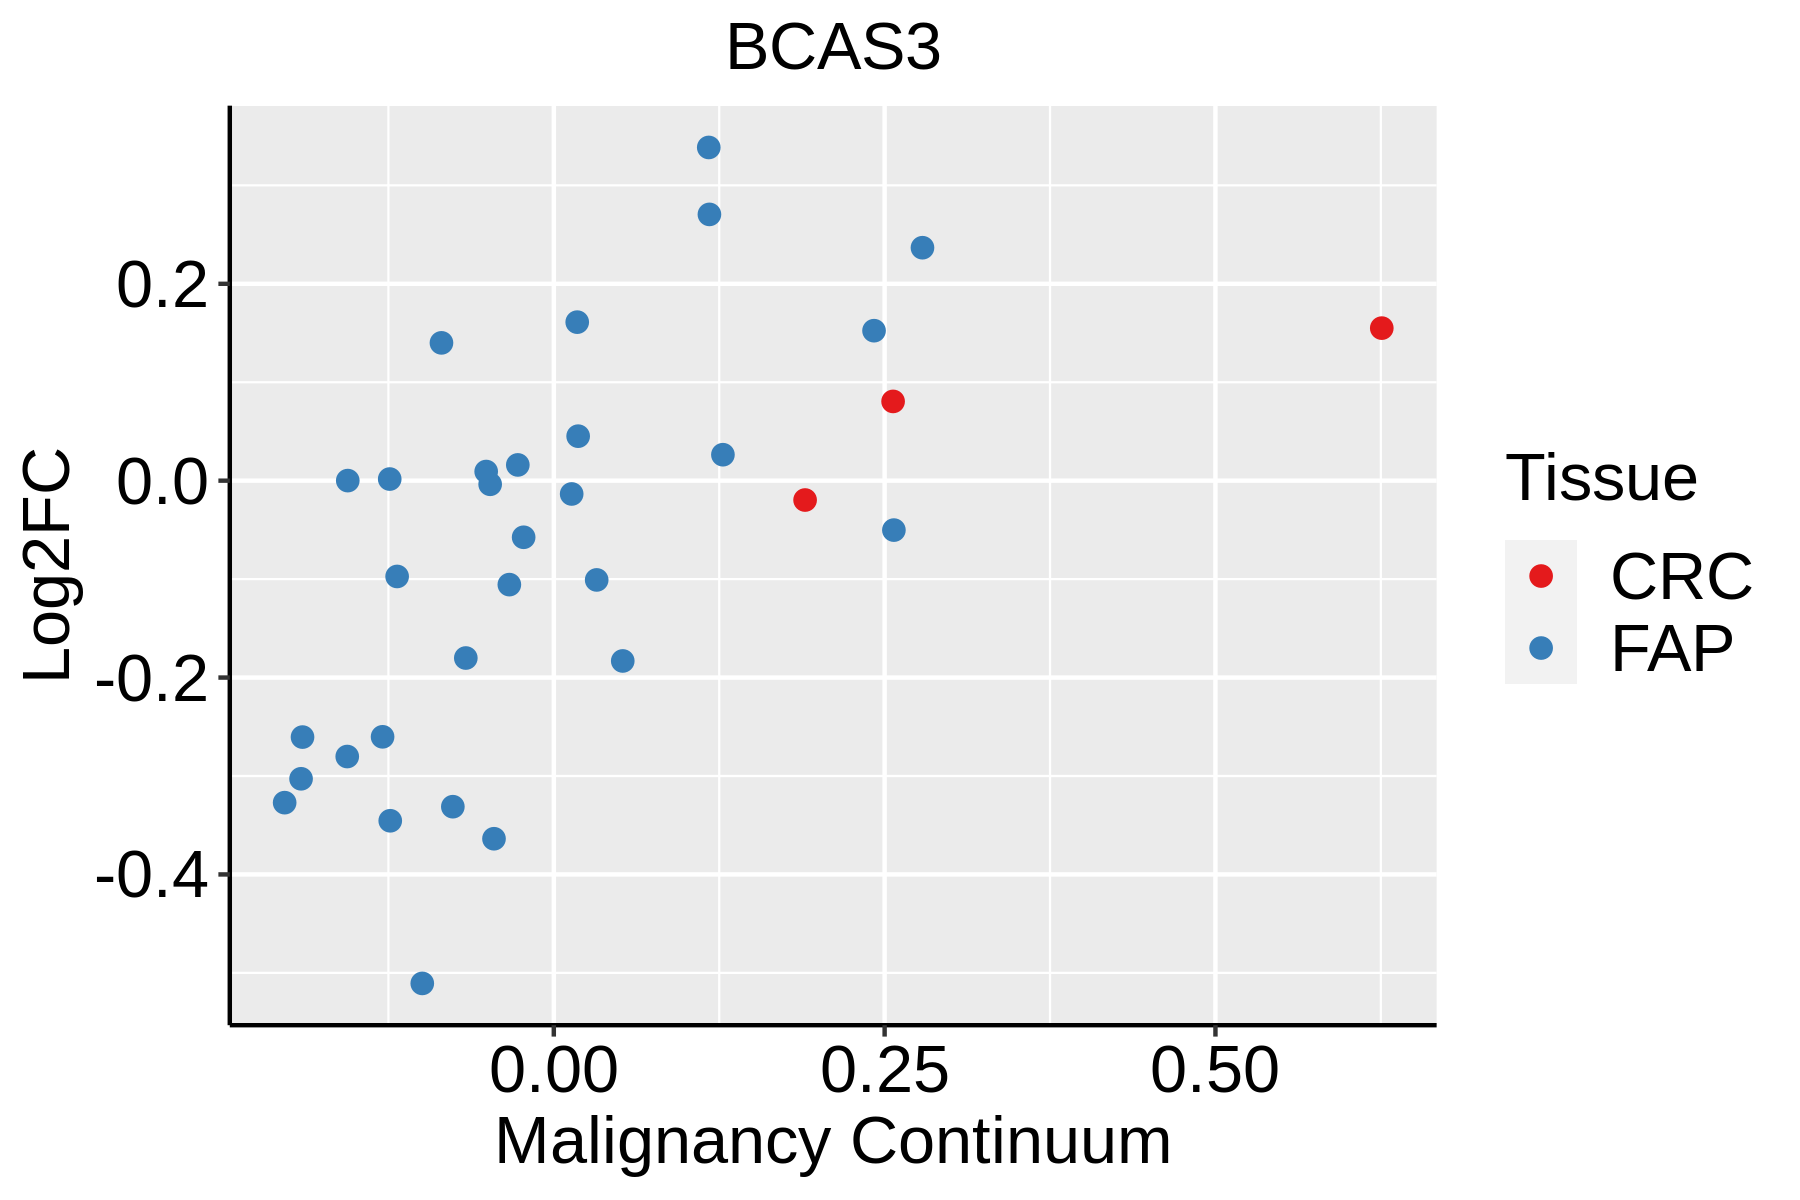 | FAP: Familial adenomatous polyposis |
| CRC: Colorectal cancer |
| Colorectum (HTA11) |  | AD: Adenomas |
| SER: Sessile serrated lesions |
| MSI-H: Microsatellite-high colorectal cancer |
| MSS: Microsatellite stable colorectal cancer |
| Endometrium | 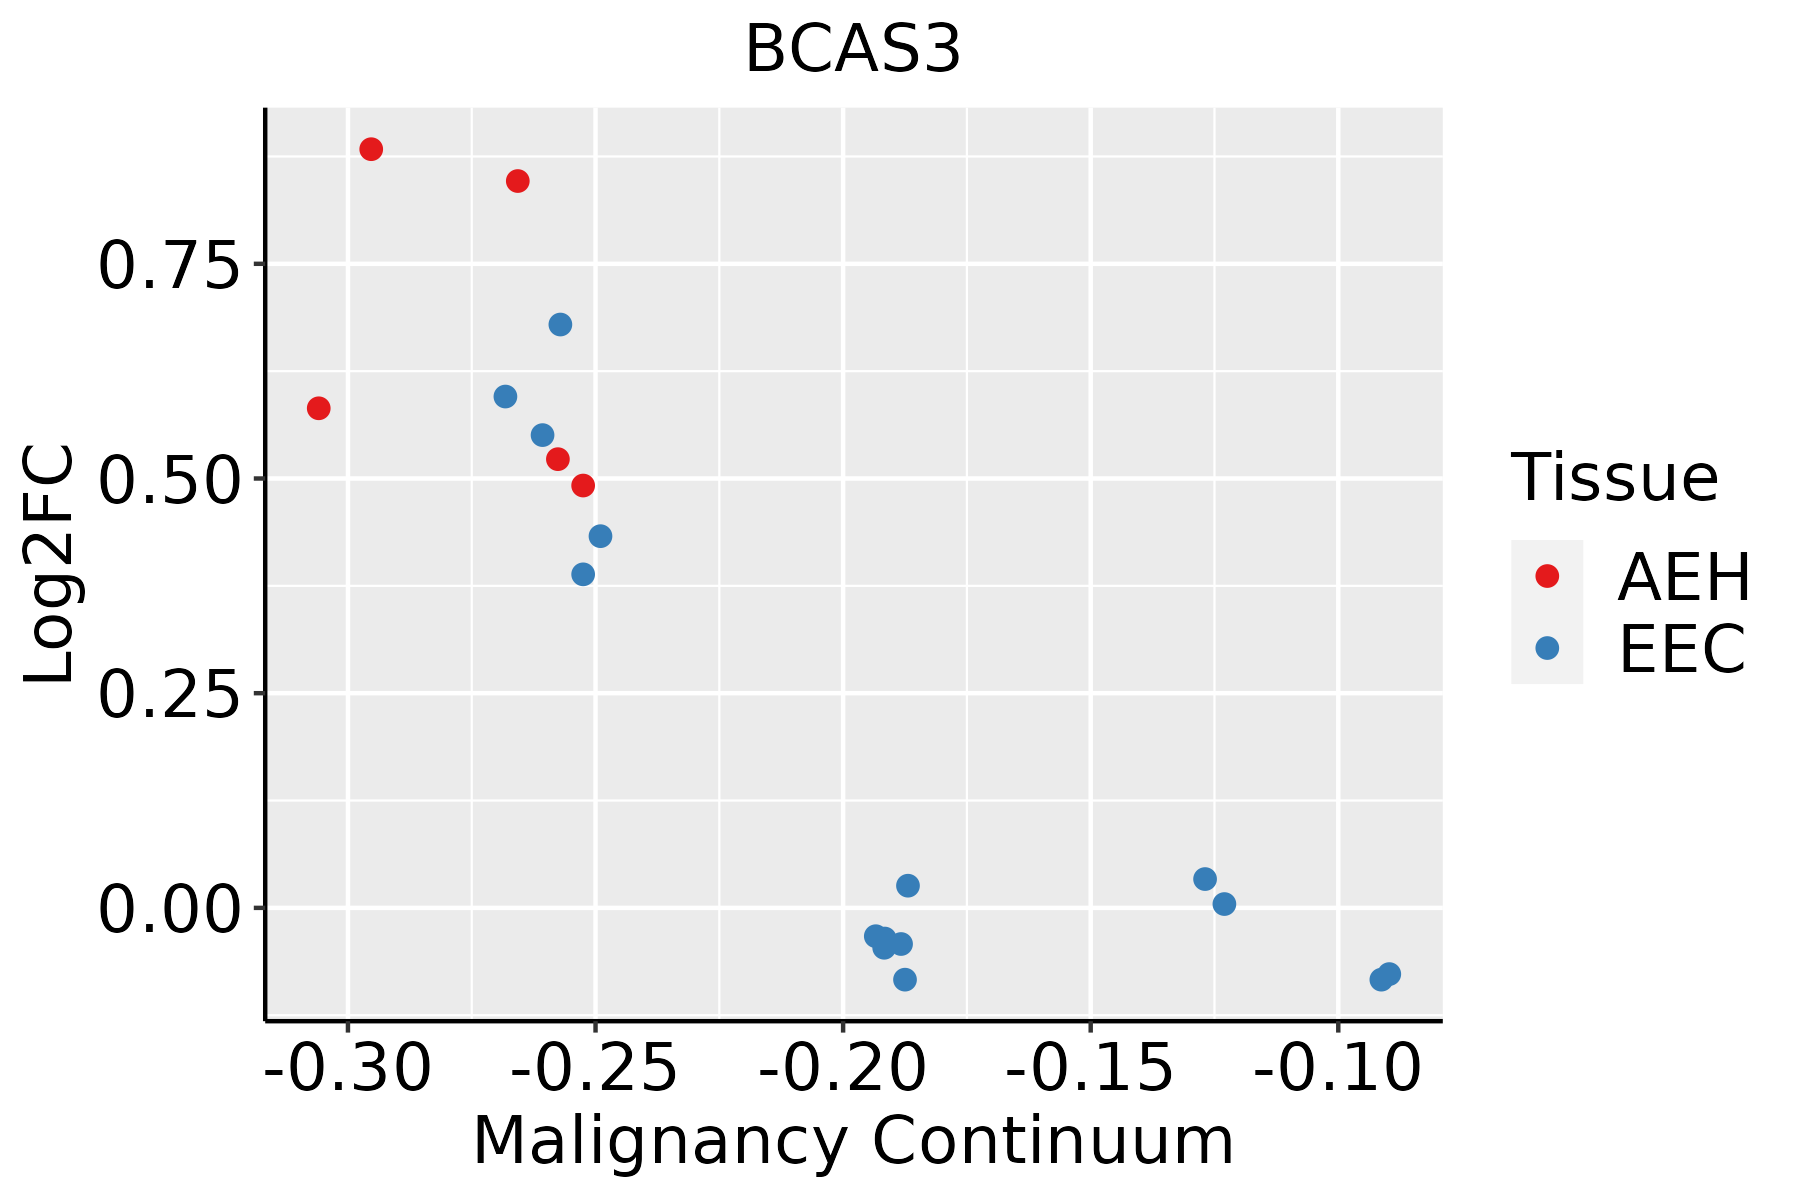 | AEH: Atypical endometrial hyperplasia |
| EEC: Endometrioid Cancer |
| Esophagus | 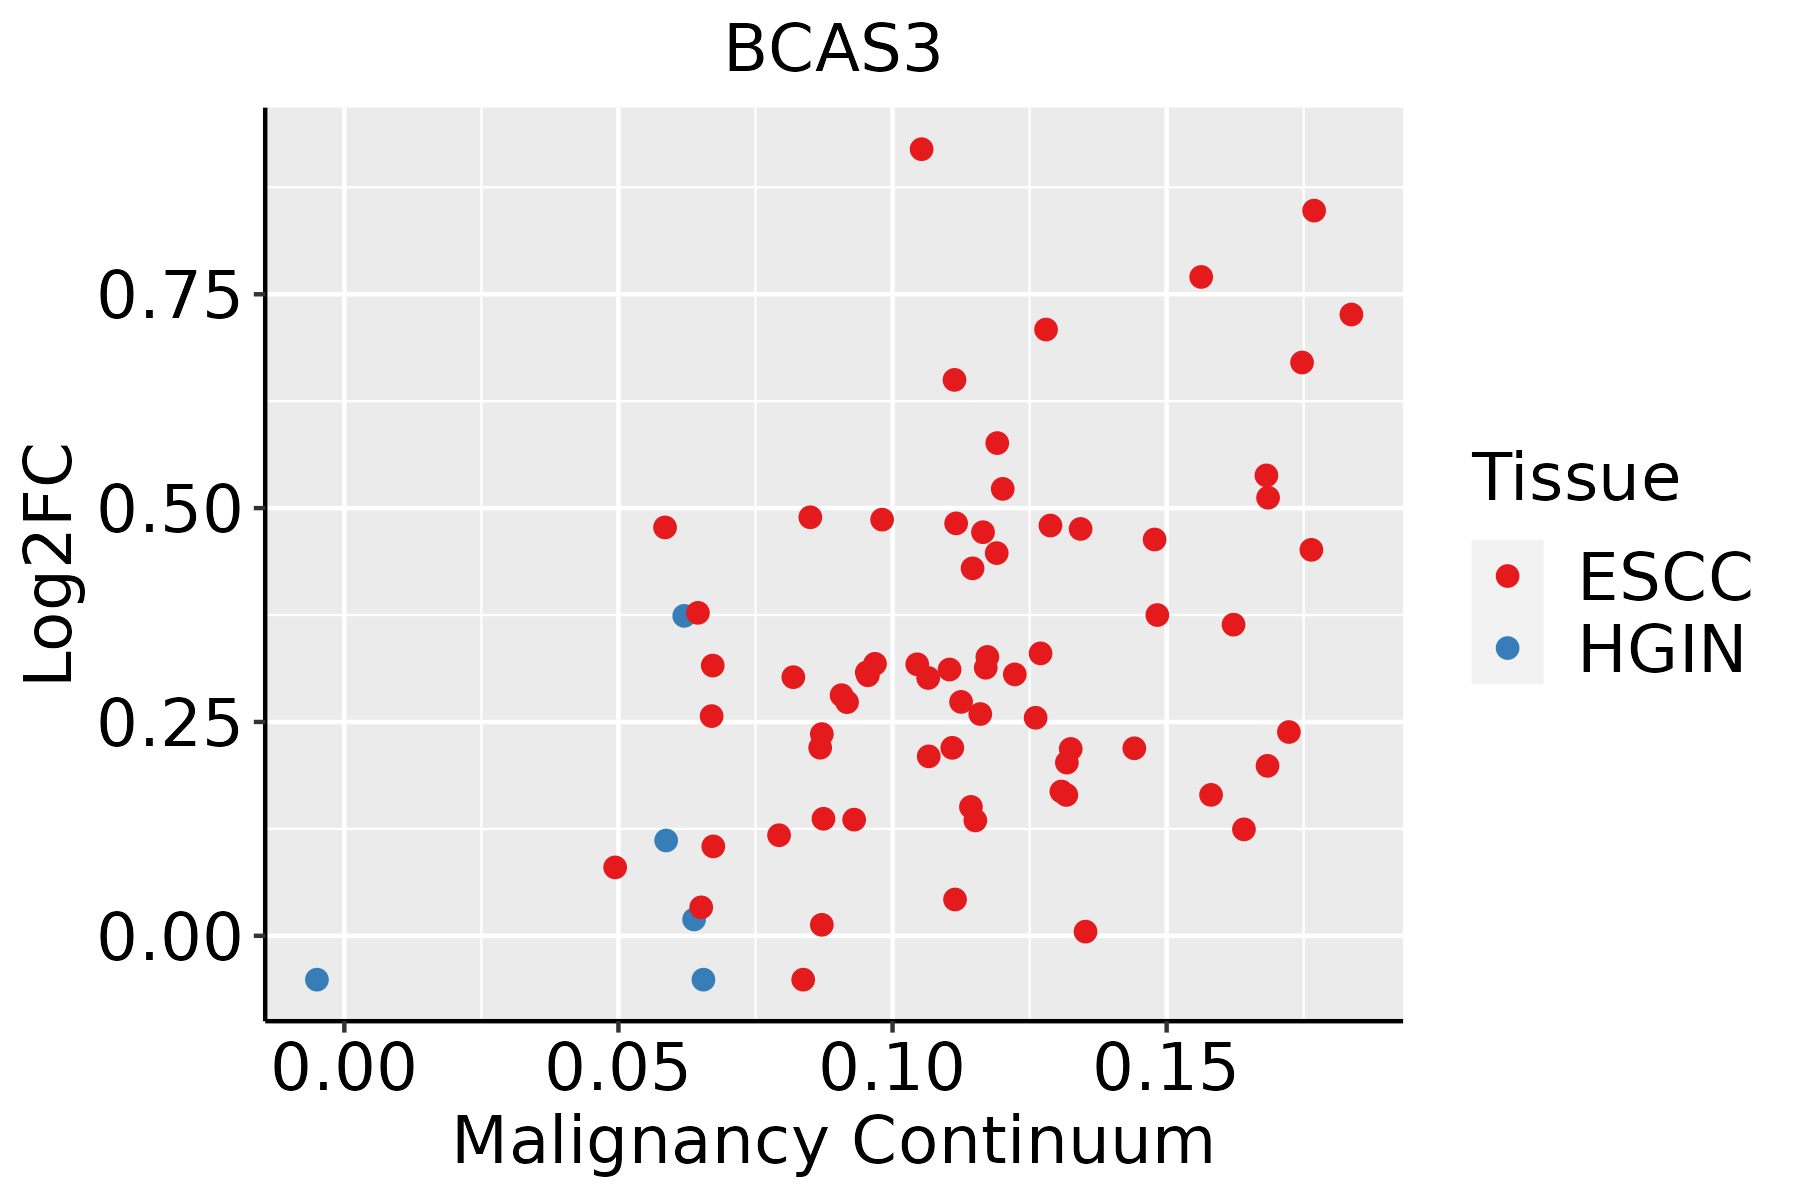 | ESCC: Esophageal squamous cell carcinoma |
| HGIN: High-grade intraepithelial neoplasias |
| LGIN: Low-grade intraepithelial neoplasias |
| Lung | 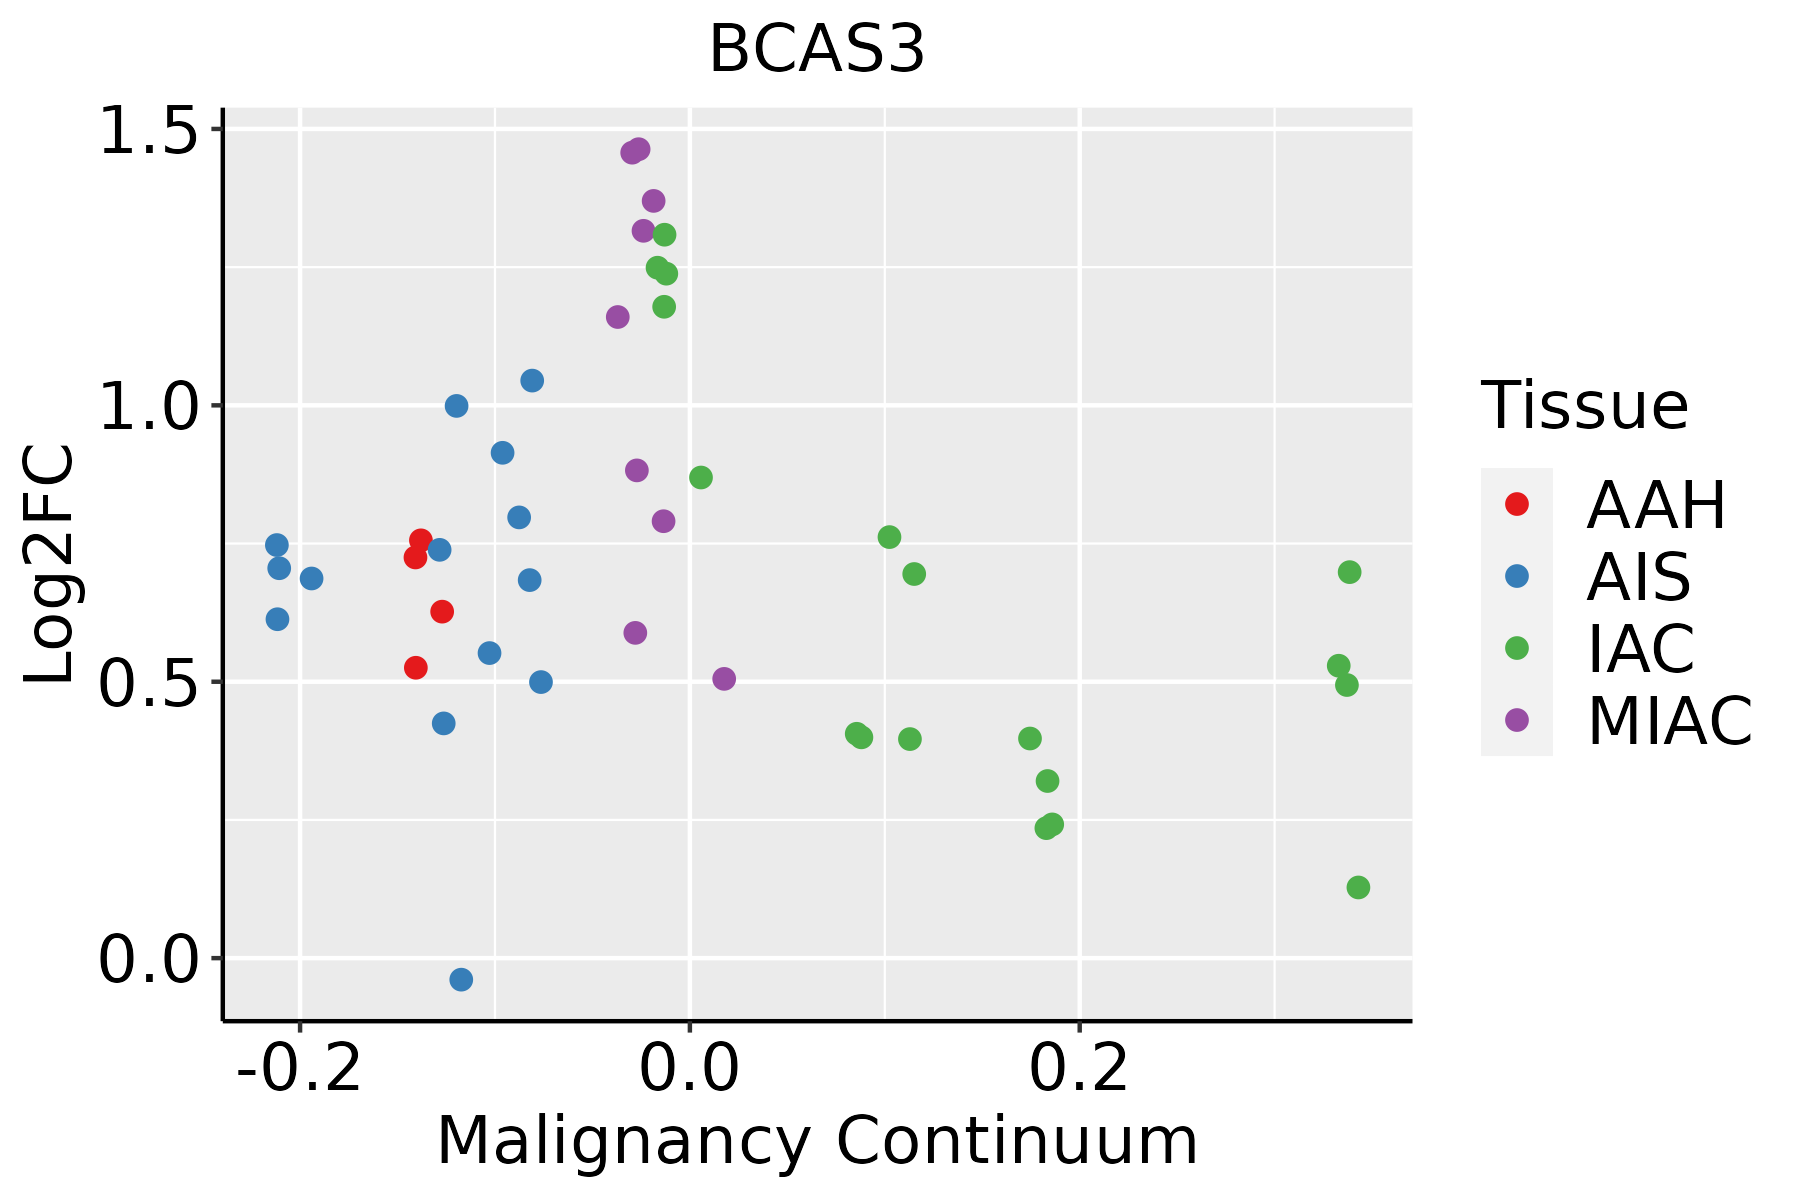 | AAH: Atypical adenomatous hyperplasia |
| AIS: Adenocarcinoma in situ |
| IAC: Invasive lung adenocarcinoma |
| MIA: Minimally invasive adenocarcinoma |
| Prostate | 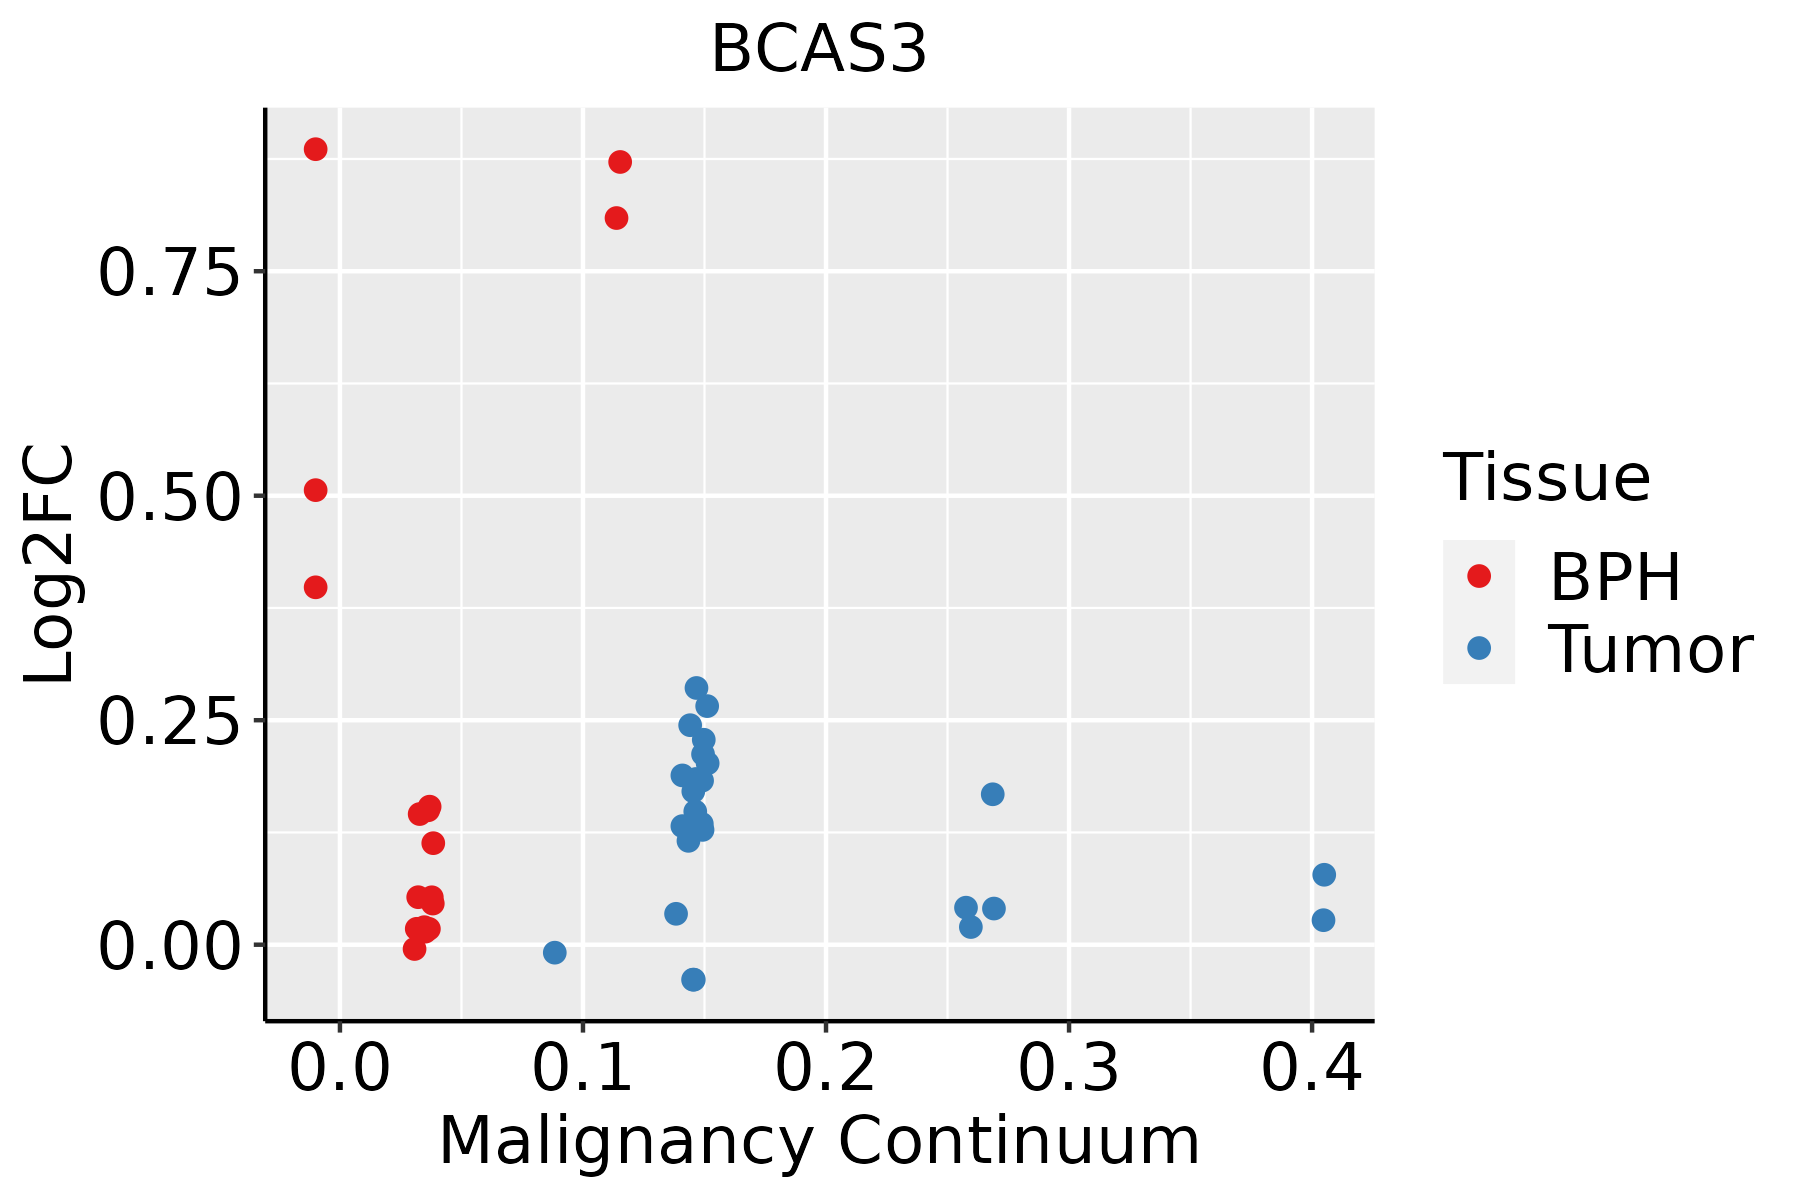 | BPH: Benign Prostatic Hyperplasia |
| GO ID | Tissue | Disease Stage | Description | Gene Ratio | Bg Ratio | pvalue | p.adjust | Count |
| GO:001081010 | Cervix | CC | regulation of cell-substrate adhesion | 69/2311 | 221/18723 | 8.57e-14 | 5.69e-11 | 69 |
| GO:00315898 | Cervix | CC | cell-substrate adhesion | 96/2311 | 363/18723 | 1.48e-13 | 8.85e-11 | 96 |
| GO:009013210 | Cervix | CC | epithelium migration | 90/2311 | 360/18723 | 2.45e-11 | 6.11e-09 | 90 |
| GO:00016679 | Cervix | CC | ameboidal-type cell migration | 110/2311 | 475/18723 | 2.66e-11 | 6.36e-09 | 110 |
| GO:001063110 | Cervix | CC | epithelial cell migration | 89/2311 | 357/18723 | 3.72e-11 | 8.54e-09 | 89 |
| GO:003297010 | Cervix | CC | regulation of actin filament-based process | 96/2311 | 397/18723 | 4.00e-11 | 8.54e-09 | 96 |
| GO:00071639 | Cervix | CC | establishment or maintenance of cell polarity | 63/2311 | 218/18723 | 4.25e-11 | 8.76e-09 | 63 |
| GO:009013010 | Cervix | CC | tissue migration | 90/2311 | 365/18723 | 5.42e-11 | 1.05e-08 | 90 |
| GO:01501159 | Cervix | CC | cell-substrate junction organization | 37/2311 | 101/18723 | 3.20e-10 | 4.46e-08 | 37 |
| GO:003295610 | Cervix | CC | regulation of actin cytoskeleton organization | 86/2311 | 358/18723 | 5.90e-10 | 7.51e-08 | 86 |
| GO:00070448 | Cervix | CC | cell-substrate junction assembly | 34/2311 | 95/18723 | 3.35e-09 | 3.45e-07 | 34 |
| GO:001063210 | Cervix | CC | regulation of epithelial cell migration | 72/2311 | 292/18723 | 4.52e-09 | 4.43e-07 | 72 |
| GO:00019528 | Cervix | CC | regulation of cell-matrix adhesion | 40/2311 | 128/18723 | 1.32e-08 | 1.04e-06 | 40 |
| GO:00071608 | Cervix | CC | cell-matrix adhesion | 60/2311 | 233/18723 | 1.58e-08 | 1.23e-06 | 60 |
| GO:00071626 | Cervix | CC | negative regulation of cell adhesion | 72/2311 | 303/18723 | 2.36e-08 | 1.70e-06 | 72 |
| GO:005122210 | Cervix | CC | positive regulation of protein transport | 72/2311 | 303/18723 | 2.36e-08 | 1.70e-06 | 72 |
| GO:00430877 | Cervix | CC | regulation of GTPase activity | 79/2311 | 348/18723 | 4.21e-08 | 2.60e-06 | 79 |
| GO:00300108 | Cervix | CC | establishment of cell polarity | 42/2311 | 143/18723 | 4.30e-08 | 2.62e-06 | 42 |
| GO:190495110 | Cervix | CC | positive regulation of establishment of protein localization | 73/2311 | 319/18723 | 9.69e-08 | 5.25e-06 | 73 |
| GO:00106349 | Cervix | CC | positive regulation of epithelial cell migration | 47/2311 | 176/18723 | 1.73e-07 | 8.01e-06 | 47 |
| Hugo Symbol | Variant Class | Variant Classification | dbSNP RS | HGVSc | HGVSp | HGVSp Short | SWISSPROT | BIOTYPE | SIFT | PolyPhen | Tumor Sample Barcode | Tissue | Histology | Sex | Age | Stage | Therapy Types | Drugs | Outcome |
| BCAS3 | SNV | Missense_Mutation | novel | c.410N>G | p.Gln137Arg | p.Q137R | Q9H6U6 | protein_coding | tolerated(0.27) | benign(0.093) | TCGA-AN-A046-01 | Breast | breast invasive carcinoma | Female | >=65 | I/II | Unknown | Unknown | SD |
| BCAS3 | SNV | Missense_Mutation | rs755073133 | c.68N>A | p.Arg23His | p.R23H | Q9H6U6 | protein_coding | deleterious(0.04) | probably_damaging(0.937) | TCGA-AO-A0J2-01 | Breast | breast invasive carcinoma | Female | <65 | I/II | Chemotherapy | cyclophosphamide | SD |
| BCAS3 | SNV | Missense_Mutation | | c.2038N>A | p.Asp680Asn | p.D680N | Q9H6U6 | protein_coding | tolerated(0.07) | benign(0.073) | TCGA-BH-A0W7-01 | Breast | breast invasive carcinoma | Female | <65 | I/II | Chemotherapy | taxotere | CR |
| BCAS3 | SNV | Missense_Mutation | novel | c.1331N>C | p.Arg444Pro | p.R444P | Q9H6U6 | protein_coding | deleterious(0) | possibly_damaging(0.875) | TCGA-HN-A2OB-01 | Breast | breast invasive carcinoma | Female | <65 | I/II | Chemotherapy | fluorouracil | PD |
| BCAS3 | insertion | Frame_Shift_Ins | novel | c.2016_2017insTGGAATCATATAATATGTGACCTTTTGTGTCTGG | p.His673TrpfsTer52 | p.H673Wfs*52 | Q9H6U6 | protein_coding | | | TCGA-AO-A0JB-01 | Breast | breast invasive carcinoma | Female | <65 | III/IV | Chemotherapy | cyclophosphamide | SD |
| BCAS3 | SNV | Missense_Mutation | novel | c.2335N>A | p.Asp779Asn | p.D779N | Q9H6U6 | protein_coding | tolerated(0.09) | possibly_damaging(0.642) | TCGA-2W-A8YY-01 | Cervix | cervical & endocervical cancer | Female | <65 | I/II | Chemotherapy | cisplatin | CR |
| BCAS3 | SNV | Missense_Mutation | rs759264893 | c.2318N>T | p.Thr773Met | p.T773M | Q9H6U6 | protein_coding | deleterious(0.02) | benign(0.401) | TCGA-C5-A1BE-01 | Cervix | cervical & endocervical cancer | Female | <65 | I/II | Chemotherapy | cisplatin | PD |
| BCAS3 | SNV | Missense_Mutation | novel | c.2158G>A | p.Glu720Lys | p.E720K | Q9H6U6 | protein_coding | deleterious(0.01) | possibly_damaging(0.879) | TCGA-VS-A9U6-01 | Cervix | cervical & endocervical cancer | Female | <65 | I/II | Chemotherapy | cisplatin | PD |
| BCAS3 | SNV | Missense_Mutation | | c.1755N>A | p.Phe585Leu | p.F585L | Q9H6U6 | protein_coding | deleterious(0) | probably_damaging(0.987) | TCGA-4N-A93T-01 | Colorectum | colon adenocarcinoma | Male | >=65 | III/IV | Chemotherapy | xeloda | SD |
| BCAS3 | SNV | Missense_Mutation | rs377752373 | c.583N>T | p.Arg195Trp | p.R195W | Q9H6U6 | protein_coding | deleterious(0) | possibly_damaging(0.736) | TCGA-A6-5660-01 | Colorectum | colon adenocarcinoma | Male | >=65 | III/IV | Ancillary | leucovorin | SD |


