
|
|||||
|
 | |
| |
| |
| |
| |
| |
|
Gene: BCAP29 |
Gene summary for BCAP29 |
| Gene information | Species | Human | Gene symbol | BCAP29 | Gene ID | 55973 |
| Gene name | B cell receptor associated protein 29 | |
| Gene Alias | BAP29 | |
| Cytomap | 7q22.3 | |
| Gene Type | protein-coding | GO ID | GO:0001503 | UniProtAcc | E9PAJ1 |
Top |
Malignant transformation analysis |
| Identification of the aberrant gene expression in precancerous and cancerous lesions by comparing the gene expression of stem-like cells in diseased tissues with normal stem cells |
| Entrez ID | Symbol | Replicates | Species | Organ | Tissue | Adj P-value | Log2FC | Malignancy |
| 55973 | BCAP29 | LZE4T | Human | Esophagus | ESCC | 1.01e-17 | 5.12e-01 | 0.0811 |
| 55973 | BCAP29 | LZE5T | Human | Esophagus | ESCC | 3.28e-10 | 7.29e-01 | 0.0514 |
| 55973 | BCAP29 | LZE7T | Human | Esophagus | ESCC | 8.60e-08 | 5.03e-01 | 0.0667 |
| 55973 | BCAP29 | LZE8T | Human | Esophagus | ESCC | 7.25e-12 | 4.01e-01 | 0.067 |
| 55973 | BCAP29 | LZE20T | Human | Esophagus | ESCC | 1.40e-08 | 3.01e-01 | 0.0662 |
| 55973 | BCAP29 | LZE22D1 | Human | Esophagus | HGIN | 1.01e-02 | 2.38e-01 | 0.0595 |
| 55973 | BCAP29 | LZE22T | Human | Esophagus | ESCC | 3.09e-05 | 6.69e-01 | 0.068 |
| 55973 | BCAP29 | LZE24T | Human | Esophagus | ESCC | 3.12e-25 | 7.22e-01 | 0.0596 |
| 55973 | BCAP29 | LZE22D3 | Human | Esophagus | HGIN | 2.45e-02 | 3.52e-01 | 0.0653 |
| 55973 | BCAP29 | LZE21T | Human | Esophagus | ESCC | 5.27e-05 | 4.78e-01 | 0.0655 |
| 55973 | BCAP29 | LZE6T | Human | Esophagus | ESCC | 5.12e-11 | 6.08e-01 | 0.0845 |
| 55973 | BCAP29 | P1T-E | Human | Esophagus | ESCC | 2.32e-23 | 1.44e+00 | 0.0875 |
| 55973 | BCAP29 | P2T-E | Human | Esophagus | ESCC | 2.23e-24 | 4.05e-01 | 0.1177 |
| 55973 | BCAP29 | P4T-E | Human | Esophagus | ESCC | 7.70e-40 | 8.14e-01 | 0.1323 |
| 55973 | BCAP29 | P5T-E | Human | Esophagus | ESCC | 8.77e-41 | 8.06e-01 | 0.1327 |
| 55973 | BCAP29 | P8T-E | Human | Esophagus | ESCC | 1.75e-40 | 6.90e-01 | 0.0889 |
| 55973 | BCAP29 | P9T-E | Human | Esophagus | ESCC | 1.55e-35 | 7.41e-01 | 0.1131 |
| 55973 | BCAP29 | P10T-E | Human | Esophagus | ESCC | 2.41e-34 | 5.78e-01 | 0.116 |
| 55973 | BCAP29 | P11T-E | Human | Esophagus | ESCC | 1.43e-33 | 8.94e-01 | 0.1426 |
| 55973 | BCAP29 | P12T-E | Human | Esophagus | ESCC | 4.03e-47 | 7.63e-01 | 0.1122 |
| Page: 1 2 3 4 5 6 7 |
| Tissue | Expression Dynamics | Abbreviation |
| Esophagus | 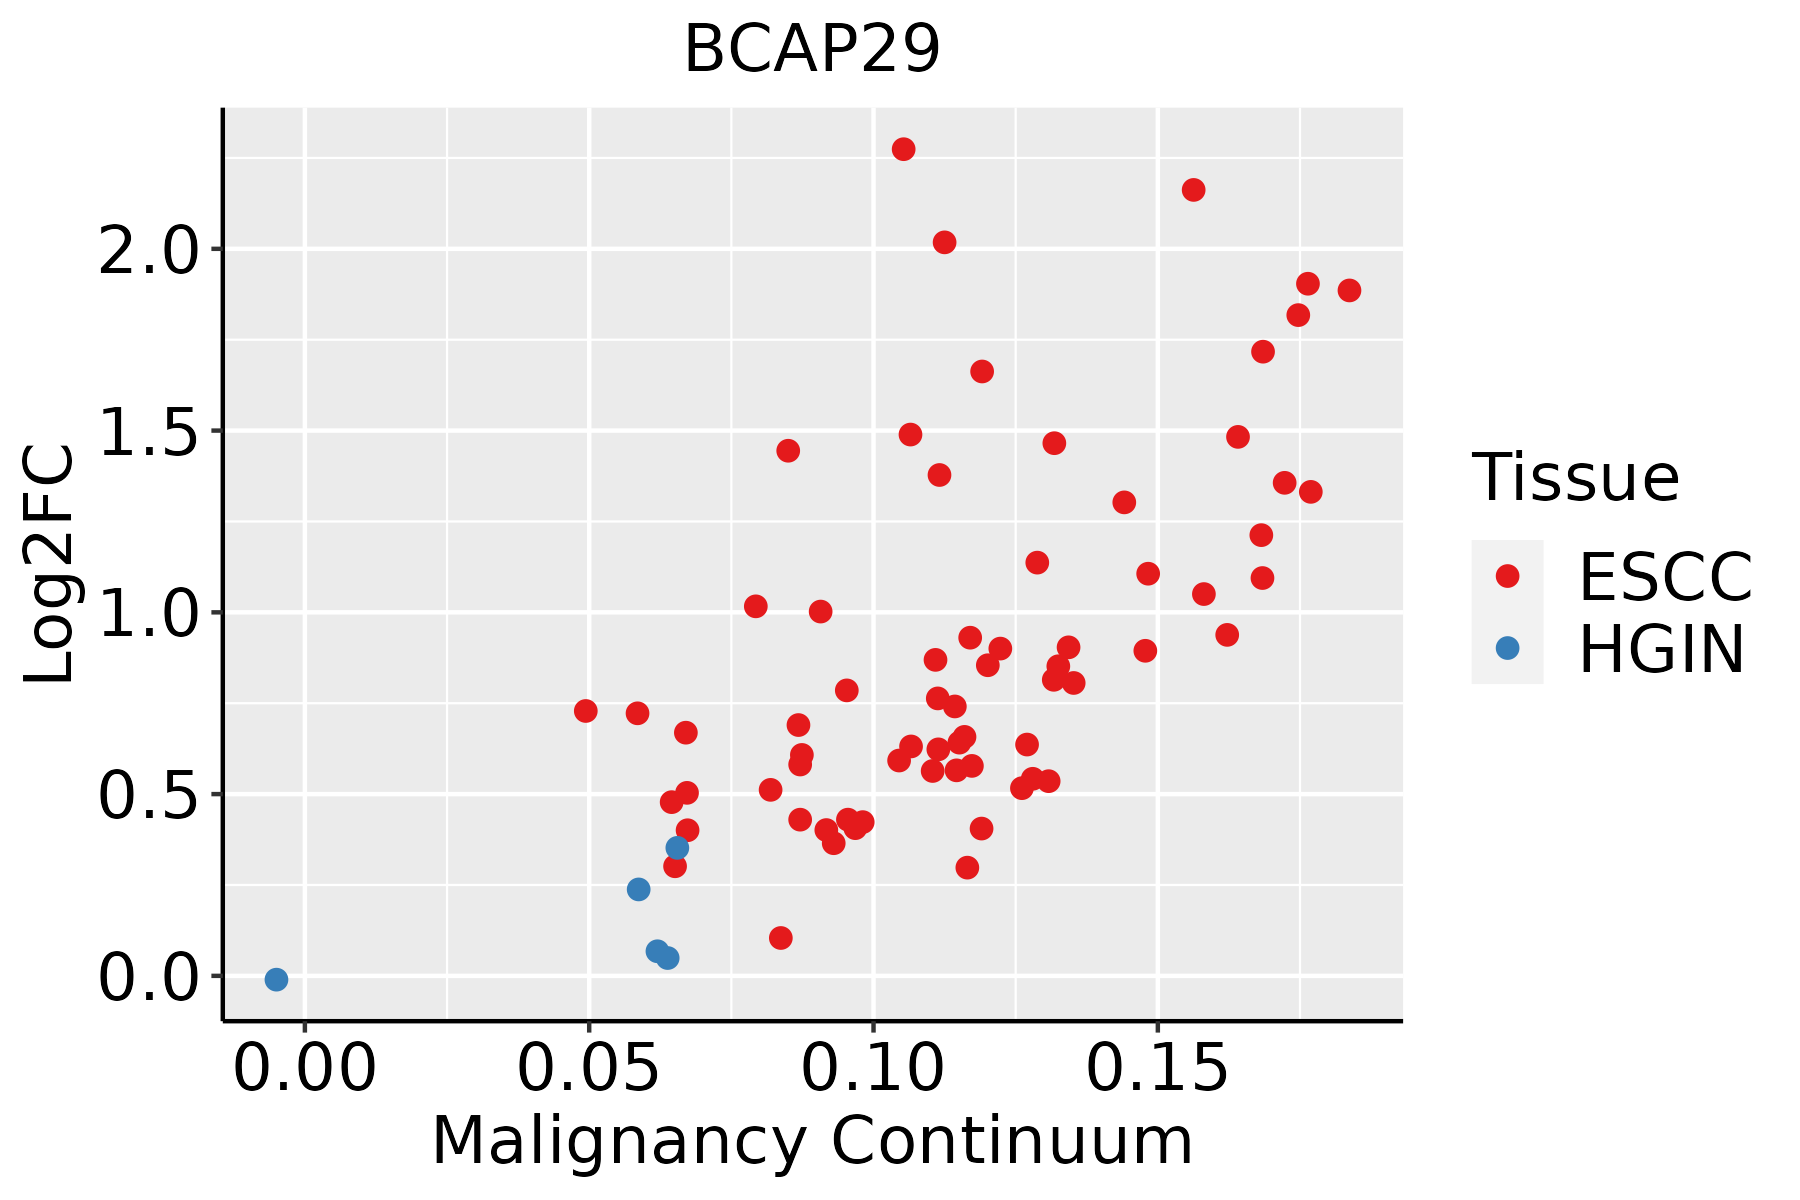 | ESCC: Esophageal squamous cell carcinoma |
| HGIN: High-grade intraepithelial neoplasias | ||
| LGIN: Low-grade intraepithelial neoplasias | ||
| Liver | 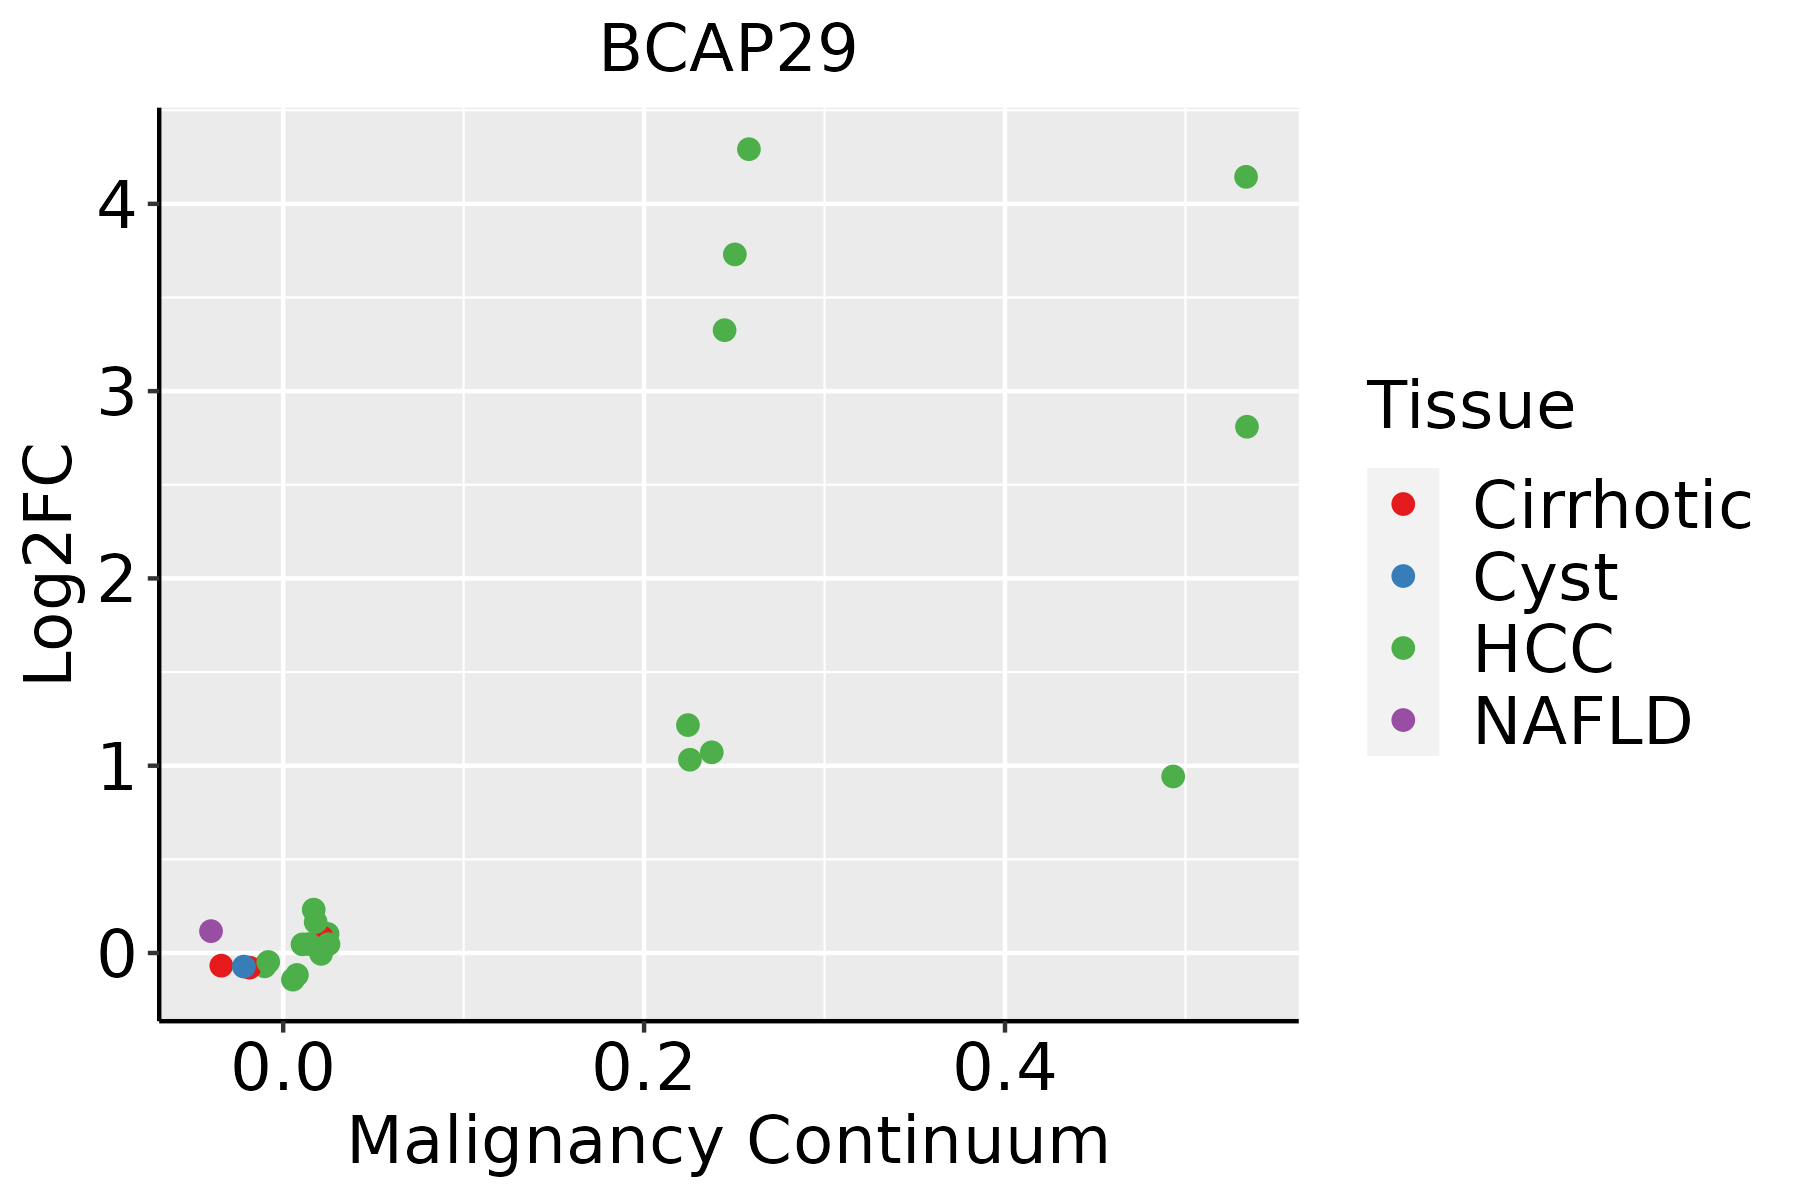 | HCC: Hepatocellular carcinoma |
| NAFLD: Non-alcoholic fatty liver disease | ||
| Oral Cavity |  | EOLP: Erosive Oral lichen planus |
| LP: leukoplakia | ||
| NEOLP: Non-erosive oral lichen planus | ||
| OSCC: Oral squamous cell carcinoma | ||
| Prostate | 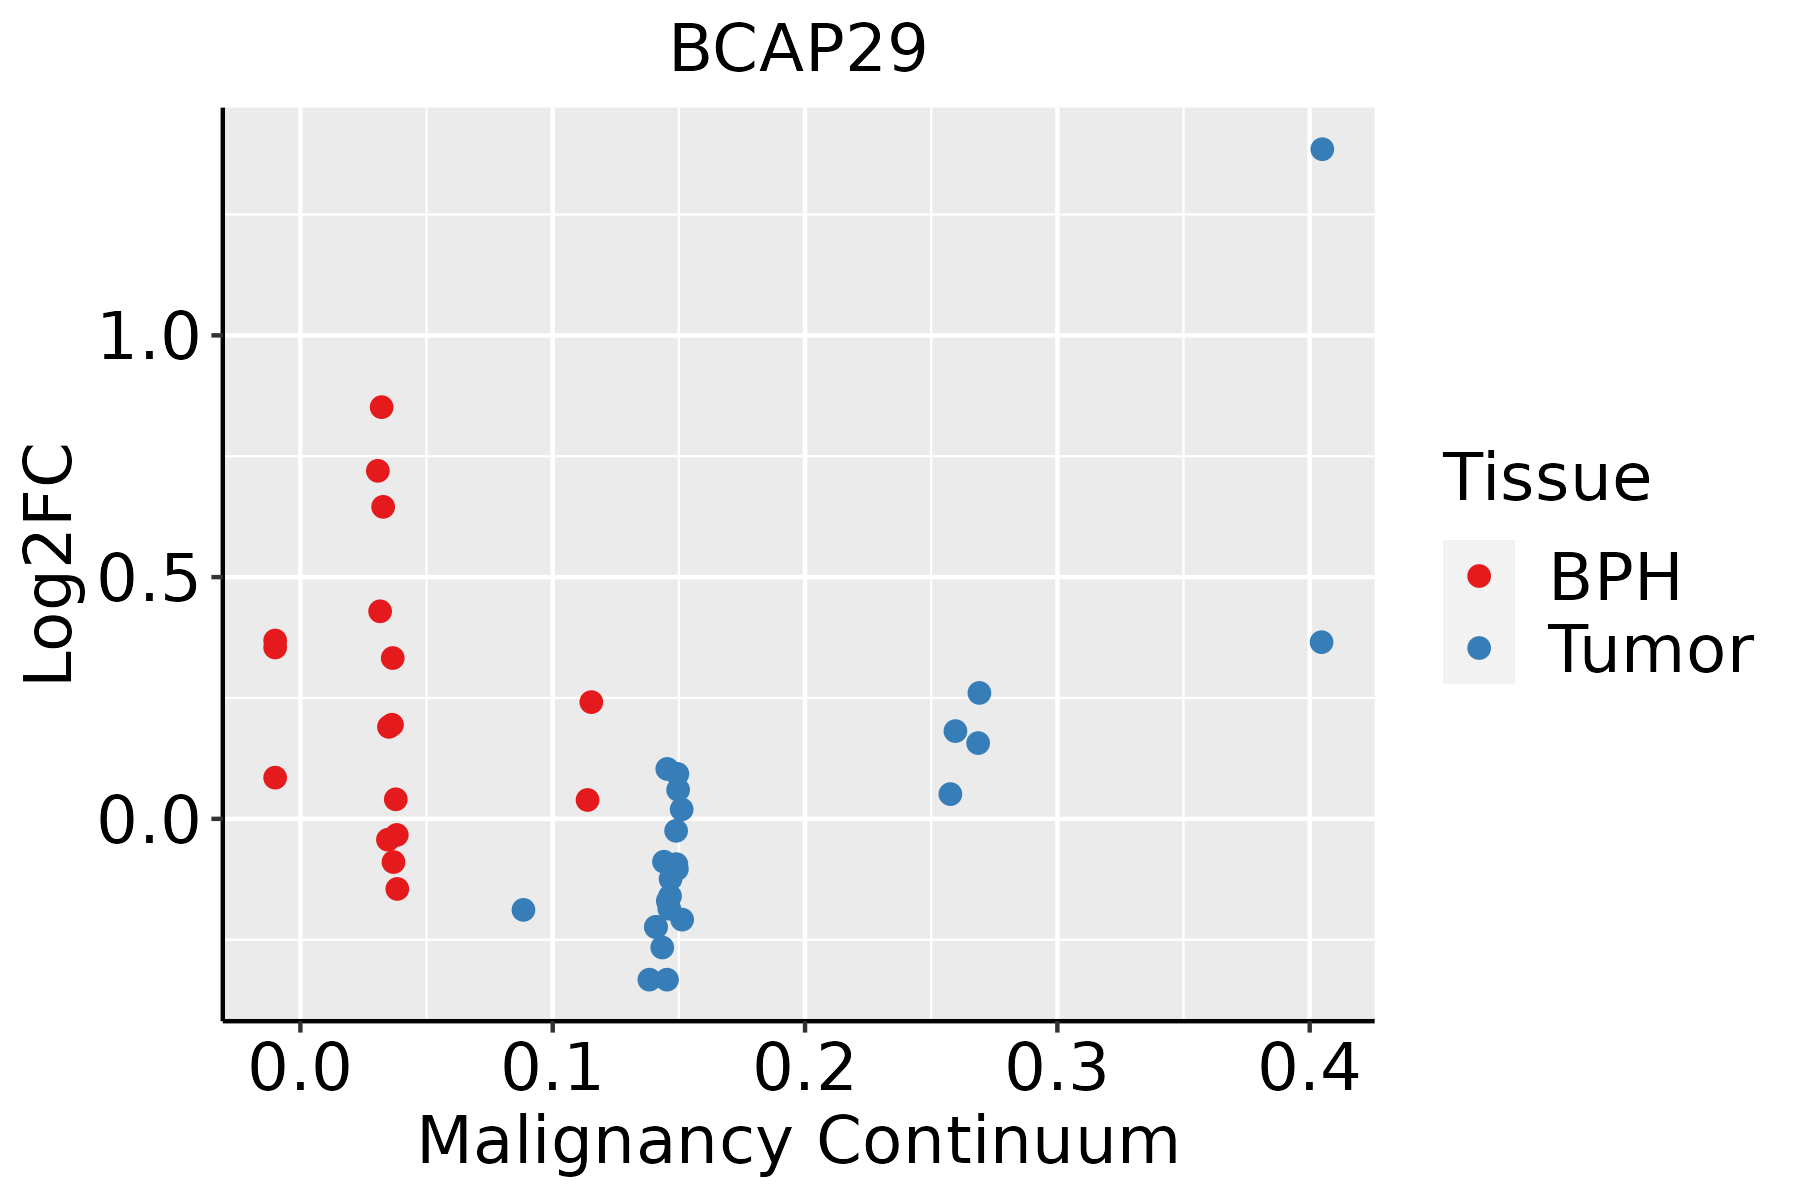 | BPH: Benign Prostatic Hyperplasia |
| Skin |  | AK: Actinic keratosis |
| cSCC: Cutaneous squamous cell carcinoma | ||
| SCCIS:squamous cell carcinoma in situ | ||
| Thyroid | 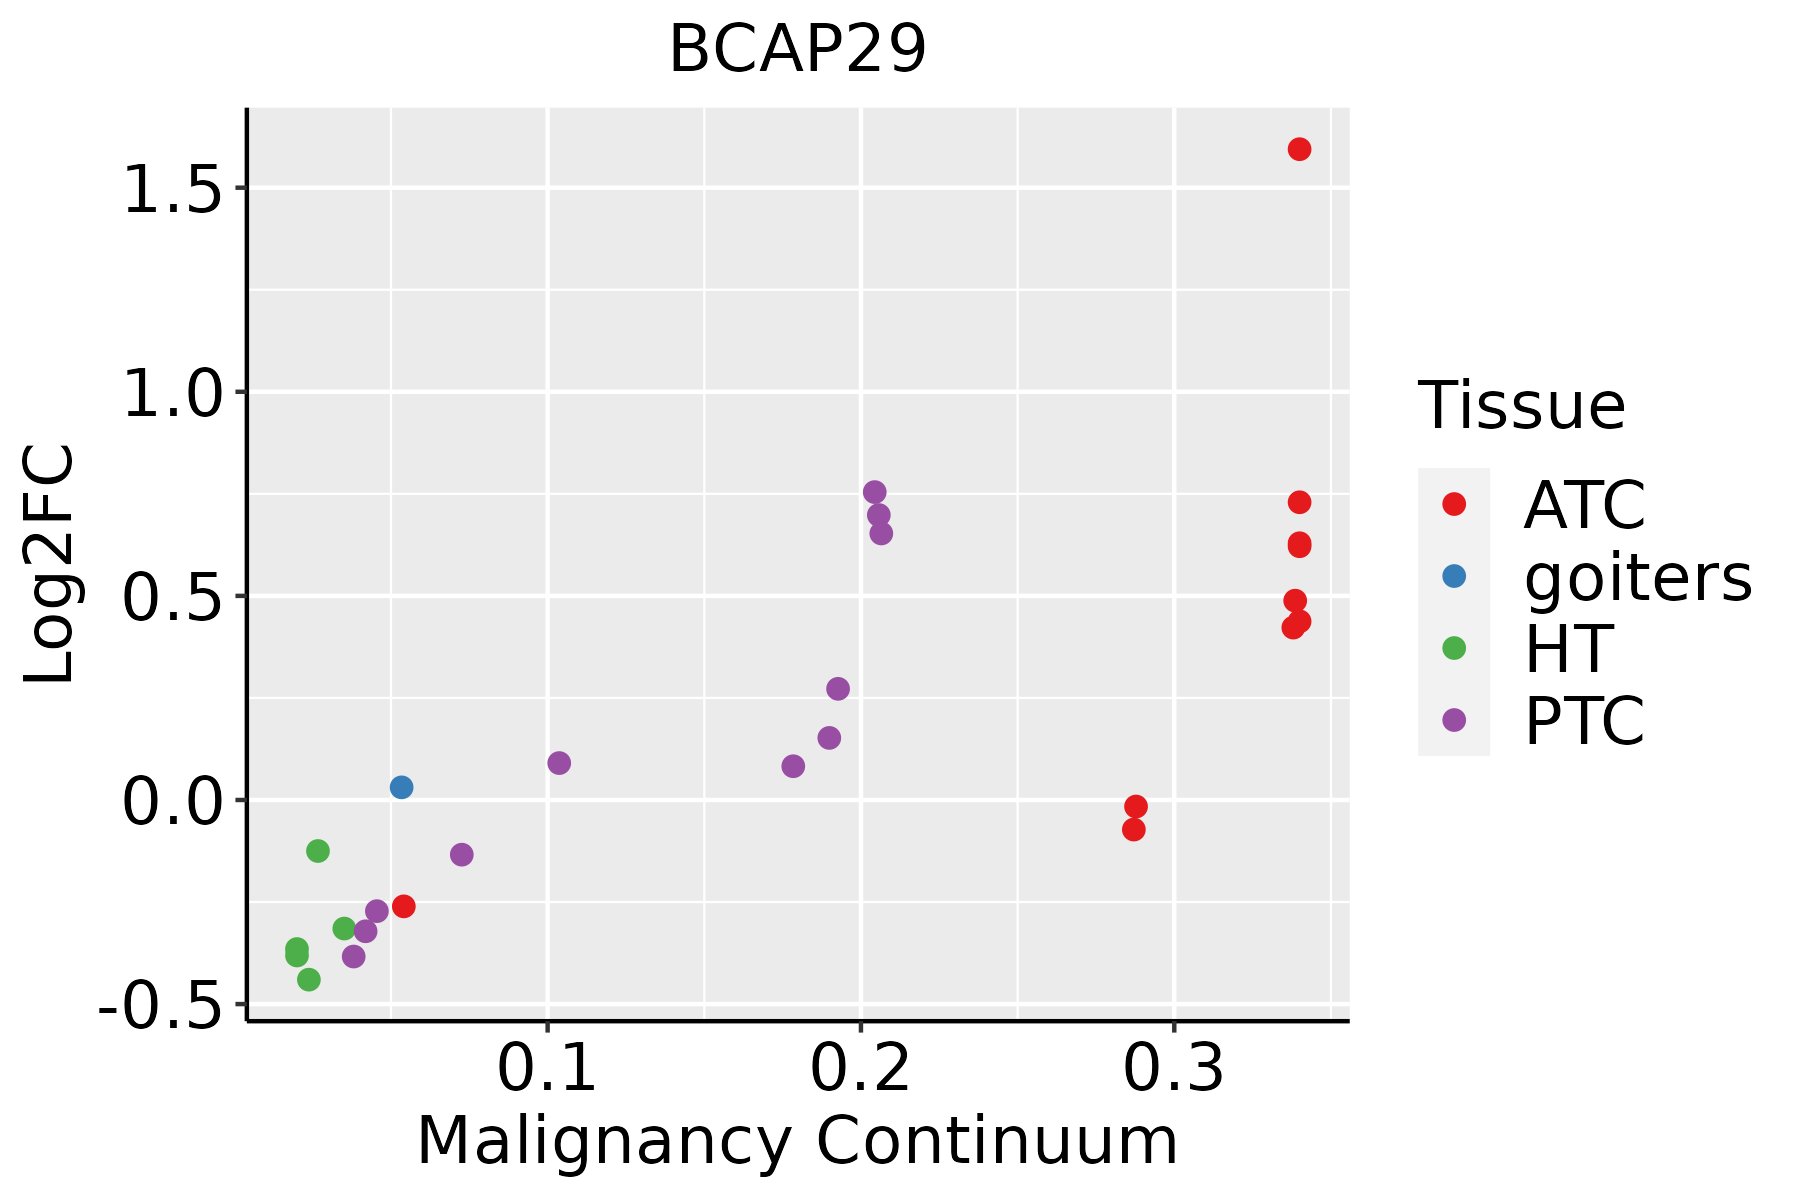 | ATC: Anaplastic thyroid cancer |
| HT: Hashimoto's thyroiditis | ||
| PTC: Papillary thyroid cancer |
| ∗log2FC in expression of this searched gene in stem-like cells from each diseased tissue sample relative to stem-like cells in normal samples in each tissue plotted against the malignancy continuum. Samples are colored based on if they are from different disease stage. |
Top |
Malignant transformation related pathway analysis |
| Find out the enriched GO biological processes and KEGG pathways involved in transition from healthy to precancer to cancer |
| Tissue | Disease Stage | Enriched GO biological Processes |
| Colorectum | AD |  |
| Colorectum | SER |  |
| Colorectum | MSS |  |
| Colorectum | MSI-H |  |
| Colorectum | FAP |  |
| ∗Top 15 enriched GO BP terms are showed in the bar plot of each disease state in each tissue. Each row represents a significant GO biological process which is colored according to the -log10(p.adjust). |
| Page: 1 2 3 4 5 6 7 8 9 |
| GO ID | Tissue | Disease Stage | Description | Gene Ratio | Bg Ratio | pvalue | p.adjust | Count |
| GO:004819317 | Esophagus | HGIN | Golgi vesicle transport | 83/2587 | 296/18723 | 8.59e-11 | 8.89e-09 | 83 |
| GO:00068889 | Esophagus | HGIN | endoplasmic reticulum to Golgi vesicle-mediated transport | 40/2587 | 130/18723 | 4.67e-07 | 2.07e-05 | 40 |
| GO:007097210 | Esophagus | HGIN | protein localization to endoplasmic reticulum | 26/2587 | 74/18723 | 3.09e-06 | 1.05e-04 | 26 |
| GO:000164917 | Esophagus | HGIN | osteoblast differentiation | 50/2587 | 229/18723 | 5.88e-04 | 8.30e-03 | 50 |
| GO:000150316 | Esophagus | HGIN | ossification | 75/2587 | 408/18723 | 5.49e-03 | 4.49e-02 | 75 |
| GO:004819318 | Esophagus | ESCC | Golgi vesicle transport | 231/8552 | 296/18723 | 1.82e-30 | 9.63e-28 | 231 |
| GO:000688815 | Esophagus | ESCC | endoplasmic reticulum to Golgi vesicle-mediated transport | 102/8552 | 130/18723 | 1.73e-14 | 9.22e-13 | 102 |
| GO:000164918 | Esophagus | ESCC | osteoblast differentiation | 140/8552 | 229/18723 | 1.63e-06 | 1.95e-05 | 140 |
| GO:000150317 | Esophagus | ESCC | ossification | 232/8552 | 408/18723 | 3.00e-06 | 3.40e-05 | 232 |
| GO:007097218 | Esophagus | ESCC | protein localization to endoplasmic reticulum | 52/8552 | 74/18723 | 1.58e-05 | 1.42e-04 | 52 |
| GO:004819311 | Liver | Cirrhotic | Golgi vesicle transport | 153/4634 | 296/18723 | 1.02e-23 | 6.43e-21 | 153 |
| GO:000688811 | Liver | Cirrhotic | endoplasmic reticulum to Golgi vesicle-mediated transport | 77/4634 | 130/18723 | 5.78e-17 | 7.56e-15 | 77 |
| GO:00709724 | Liver | Cirrhotic | protein localization to endoplasmic reticulum | 45/4634 | 74/18723 | 4.79e-11 | 2.73e-09 | 45 |
| GO:00016495 | Liver | Cirrhotic | osteoblast differentiation | 80/4634 | 229/18723 | 3.39e-04 | 2.91e-03 | 80 |
| GO:00015035 | Liver | Cirrhotic | ossification | 127/4634 | 408/18723 | 1.89e-03 | 1.19e-02 | 127 |
| GO:004819321 | Liver | HCC | Golgi vesicle transport | 217/7958 | 296/18723 | 2.58e-27 | 1.02e-24 | 217 |
| GO:000688821 | Liver | HCC | endoplasmic reticulum to Golgi vesicle-mediated transport | 100/7958 | 130/18723 | 1.15e-15 | 8.67e-14 | 100 |
| GO:007097212 | Liver | HCC | protein localization to endoplasmic reticulum | 54/7958 | 74/18723 | 1.01e-07 | 1.98e-06 | 54 |
| GO:000164911 | Liver | HCC | osteoblast differentiation | 115/7958 | 229/18723 | 1.08e-02 | 3.99e-02 | 115 |
| GO:004819315 | Oral cavity | OSCC | Golgi vesicle transport | 209/7305 | 296/18723 | 1.39e-28 | 6.30e-26 | 209 |
| Page: 1 2 3 |
| Pathway ID | Tissue | Disease Stage | Description | Gene Ratio | Bg Ratio | pvalue | p.adjust | qvalue | Count |
| Page: 1 |
Top |
Cell-cell communication analysis |
| Identification of potential cell-cell interactions between two cell types and their ligand-receptor pairs for different disease states |
| Ligand | Receptor | LRpair | Pathway | Tissue | Disease Stage |
| Page: 1 |
Top |
Single-cell gene regulatory network inference analysis |
| Find out the significant the regulons (TFs) and the target genes of each regulon across cell types for different disease states |
| TF | Cell Type | Tissue | Disease Stage | Target Gene | RSS | Regulon Activity |
| ∗The dot plots of a searched regulon are shown for all cell subpopulations in each disease state of each tissue based on the regulon specific score inferred using pySCENIC and by calculating the average expression. |
| Page: 1 |
Top |
Somatic mutation of malignant transformation related genes |
| Annotation of somatic variants for genes involved in malignant transformation |
| Hugo Symbol | Variant Class | Variant Classification | dbSNP RS | HGVSc | HGVSp | HGVSp Short | SWISSPROT | BIOTYPE | SIFT | PolyPhen | Tumor Sample Barcode | Tissue | Histology | Sex | Age | Stage | Therapy Types | Drugs | Outcome |
| BCAP29 | SNV | Missense_Mutation | novel | c.921G>A | p.Met307Ile | p.M307I | Q9UHQ4 | protein_coding | deleterious_low_confidence(0.02) | benign(0.003) | TCGA-BH-A0HF-01 | Breast | breast invasive carcinoma | Female | >=65 | I/II | Hormone Therapy | arimidex | SD |
| BCAP29 | SNV | Missense_Mutation | c.737N>A | p.Gly246Asp | p.G246D | Q9UHQ4 | protein_coding | deleterious_low_confidence(0) | benign(0) | TCGA-D8-A27G-01 | Breast | breast invasive carcinoma | Female | >=65 | I/II | Unknown | Unknown | SD | |
| BCAP29 | deletion | Frame_Shift_Del | novel | c.897delN | p.Tyr299Ter | p.Y299* | Q9UHQ4 | protein_coding | TCGA-EW-A2FV-01 | Breast | breast invasive carcinoma | Female | <65 | III/IV | Chemotherapy | docetaxel | SD | ||
| BCAP29 | SNV | Missense_Mutation | c.579G>C | p.Lys193Asn | p.K193N | Q9UHQ4 | protein_coding | tolerated(0.07) | possibly_damaging(0.721) | TCGA-DR-A0ZM-01 | Cervix | cervical & endocervical cancer | Female | <65 | III/IV | Unspecific | Cisplatin | SD | |
| BCAP29 | SNV | Missense_Mutation | c.706N>A | p.Glu236Lys | p.E236K | Q9UHQ4 | protein_coding | tolerated(0.35) | benign(0.003) | TCGA-EK-A2H0-01 | Cervix | cervical & endocervical cancer | Female | <65 | I/II | Chemotherapy | cisplatin | CR | |
| BCAP29 | SNV | Missense_Mutation | c.706N>A | p.Glu236Lys | p.E236K | Q9UHQ4 | protein_coding | tolerated(0.35) | benign(0.003) | TCGA-ZJ-A8QQ-01 | Cervix | cervical & endocervical cancer | Female | <65 | I/II | Chemotherapy | cisplatin | SD | |
| BCAP29 | SNV | Missense_Mutation | c.368T>G | p.Leu123Arg | p.L123R | Q9UHQ4 | protein_coding | deleterious(0.01) | probably_damaging(1) | TCGA-AA-3977-01 | Colorectum | colon adenocarcinoma | Male | >=65 | I/II | Unknown | Unknown | SD | |
| BCAP29 | SNV | Missense_Mutation | rs752516635 | c.451N>A | p.Phe151Ile | p.F151I | Q9UHQ4 | protein_coding | deleterious(0.04) | possibly_damaging(0.723) | TCGA-AD-5900-01 | Colorectum | colon adenocarcinoma | Male | >=65 | I/II | Unknown | Unknown | SD |
| BCAP29 | SNV | Missense_Mutation | c.102G>T | p.Lys34Asn | p.K34N | Q9UHQ4 | protein_coding | deleterious(0.01) | benign(0.343) | TCGA-CA-6717-01 | Colorectum | colon adenocarcinoma | Male | <65 | I/II | Chemotherapy | oxaliplatin | CR | |
| BCAP29 | SNV | Missense_Mutation | c.305N>T | p.Arg102Ile | p.R102I | Q9UHQ4 | protein_coding | deleterious(0) | probably_damaging(1) | TCGA-CM-6675-01 | Colorectum | colon adenocarcinoma | Male | <65 | I/II | Chemotherapy | fluorouracil | PD |
| Page: 1 2 3 4 5 6 7 |
Top |
Related drugs of malignant transformation related genes |
| Identification of chemicals and drugs interact with genes involved in malignant transfromation |
| (DGIdb 4.0) |
| Entrez ID | Symbol | Category | Interaction Types | Drug Claim Name | Drug Name | PMIDs |
| Page: 1 |

Copyright 2023-Present -The University of Texas Health Science Center at Houston |