
|
|||||
|
 | |
| |
| |
| |
| |
| |
|
Gene: BBX |
Gene summary for BBX |
| Gene information | Species | Human | Gene symbol | BBX | Gene ID | 56987 |
| Gene name | BBX high mobility group box domain containing | |
| Gene Alias | ARTC1 | |
| Cytomap | 3q13.12 | |
| Gene Type | protein-coding | GO ID | GO:0001501 | UniProtAcc | A8K6U2 |
Top |
Malignant transformation analysis |
| Identification of the aberrant gene expression in precancerous and cancerous lesions by comparing the gene expression of stem-like cells in diseased tissues with normal stem cells |
| Entrez ID | Symbol | Replicates | Species | Organ | Tissue | Adj P-value | Log2FC | Malignancy |
| 56987 | BBX | CA_HPV_1 | Human | Cervix | CC | 1.18e-04 | -1.22e-01 | 0.0264 |
| 56987 | BBX | N_HPV_1 | Human | Cervix | N_HPV | 3.67e-02 | -1.83e-01 | 0.0079 |
| 56987 | BBX | CCI_2 | Human | Cervix | CC | 5.62e-10 | 1.12e+00 | 0.5249 |
| 56987 | BBX | CCI_3 | Human | Cervix | CC | 6.28e-07 | 8.28e-01 | 0.516 |
| 56987 | BBX | L1 | Human | Cervix | CC | 1.96e-02 | -2.52e-01 | 0.0802 |
| 56987 | BBX | HTA11_3410_2000001011 | Human | Colorectum | AD | 6.54e-21 | -6.32e-01 | 0.0155 |
| 56987 | BBX | HTA11_2487_2000001011 | Human | Colorectum | SER | 1.31e-04 | -5.00e-01 | -0.1808 |
| 56987 | BBX | HTA11_3361_2000001011 | Human | Colorectum | AD | 3.39e-05 | -5.42e-01 | -0.1207 |
| 56987 | BBX | HTA11_696_2000001011 | Human | Colorectum | AD | 1.61e-05 | -3.96e-01 | -0.1464 |
| 56987 | BBX | HTA11_5212_2000001011 | Human | Colorectum | AD | 1.07e-02 | -6.48e-01 | -0.2061 |
| 56987 | BBX | HTA11_7862_2000001011 | Human | Colorectum | AD | 2.39e-02 | -4.68e-01 | -0.0179 |
| 56987 | BBX | HTA11_866_3004761011 | Human | Colorectum | AD | 1.19e-06 | -4.06e-01 | 0.096 |
| 56987 | BBX | HTA11_10711_2000001011 | Human | Colorectum | AD | 1.02e-02 | -3.80e-01 | 0.0338 |
| 56987 | BBX | HTA11_7696_3000711011 | Human | Colorectum | AD | 1.06e-04 | -3.34e-01 | 0.0674 |
| 56987 | BBX | HTA11_99999973899_84307 | Human | Colorectum | MSS | 1.74e-02 | -4.92e-01 | 0.2585 |
| 56987 | BBX | HTA11_99999974143_84620 | Human | Colorectum | MSS | 1.08e-07 | -4.86e-01 | 0.3005 |
| 56987 | BBX | A001-C-207 | Human | Colorectum | FAP | 2.67e-04 | -2.81e-01 | 0.1278 |
| 56987 | BBX | A015-C-203 | Human | Colorectum | FAP | 7.11e-28 | -4.92e-01 | -0.1294 |
| 56987 | BBX | A015-C-204 | Human | Colorectum | FAP | 1.40e-07 | -3.23e-01 | -0.0228 |
| 56987 | BBX | A014-C-040 | Human | Colorectum | FAP | 9.02e-05 | -3.92e-01 | -0.1184 |
| Page: 1 2 3 4 5 6 7 8 9 10 11 |
| Tissue | Expression Dynamics | Abbreviation |
| Cervix | 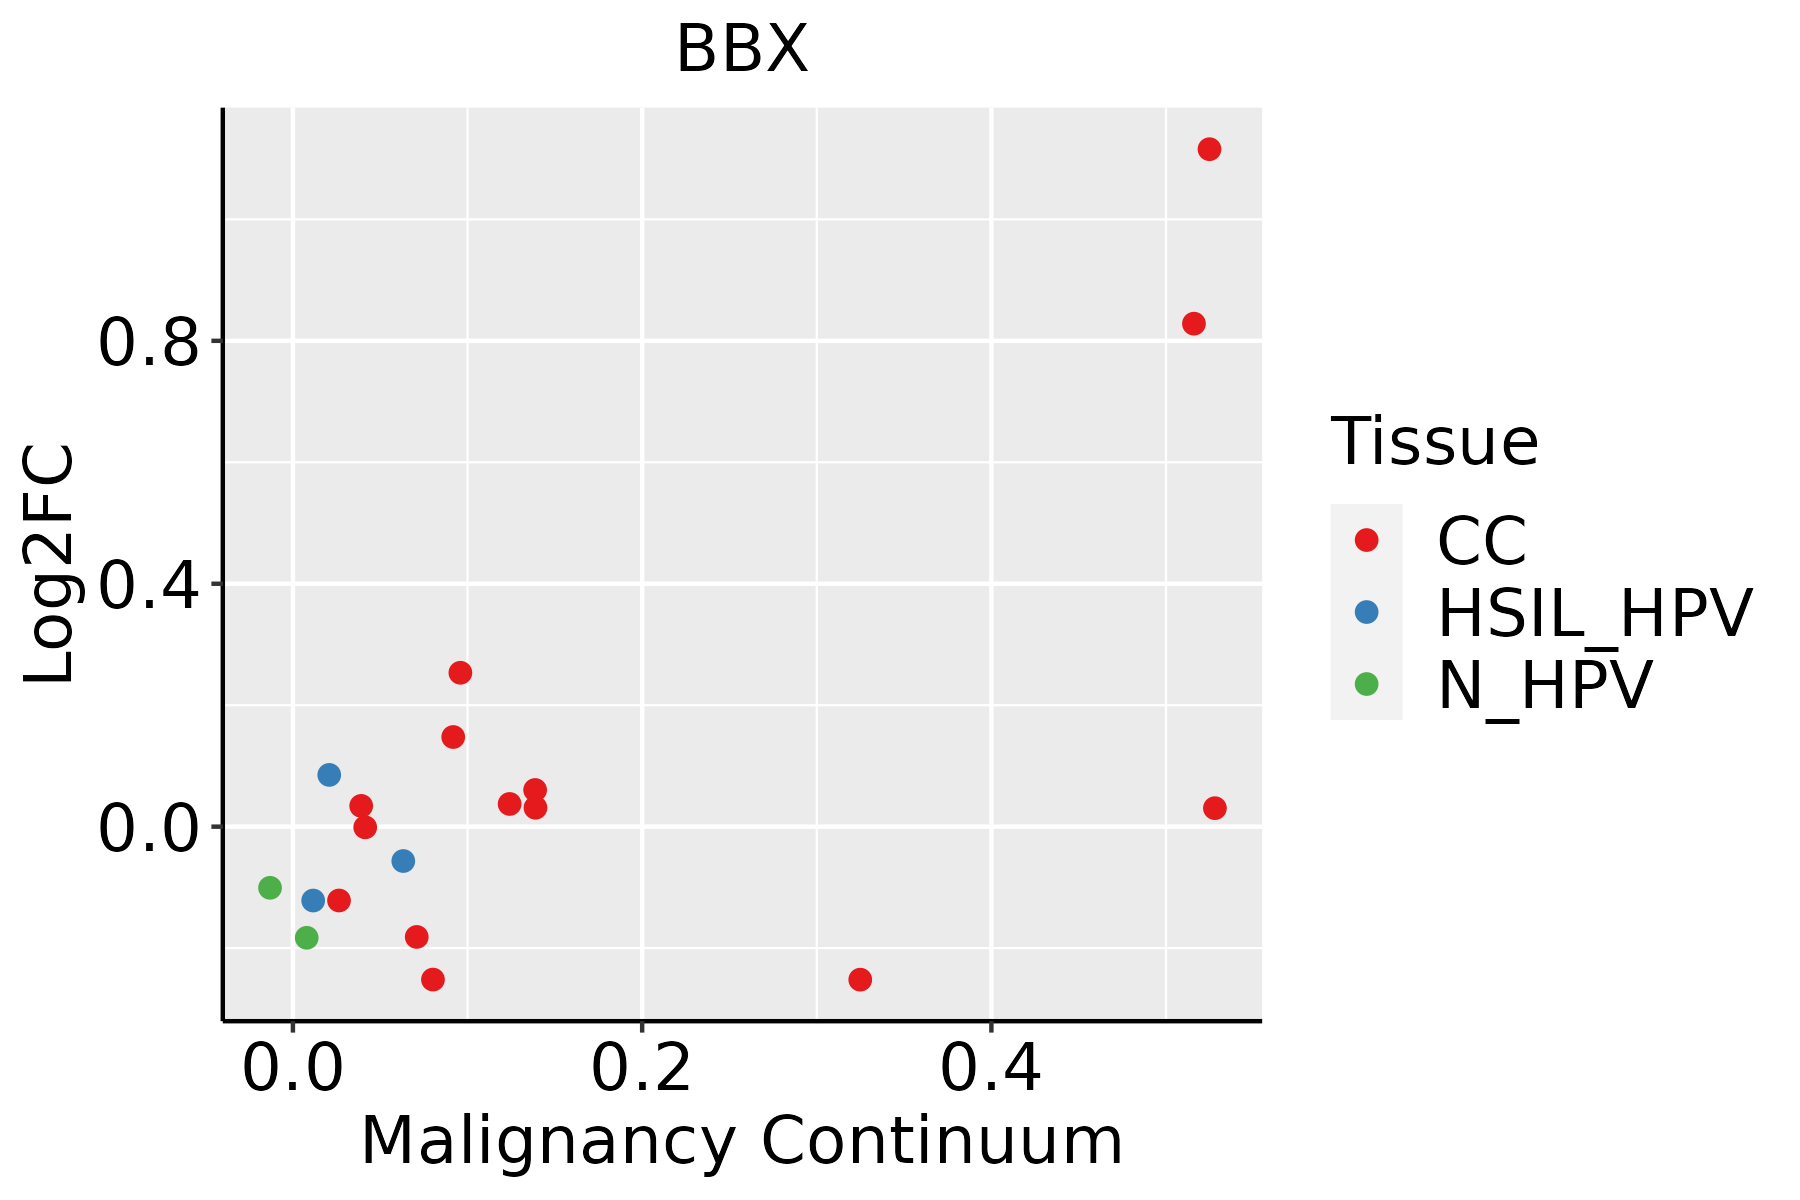 | CC: Cervix cancer |
| HSIL_HPV: HPV-infected high-grade squamous intraepithelial lesions | ||
| N_HPV: HPV-infected normal cervix | ||
| Colorectum (GSE201348) |  | FAP: Familial adenomatous polyposis |
| CRC: Colorectal cancer | ||
| Colorectum (HTA11) |  | AD: Adenomas |
| SER: Sessile serrated lesions | ||
| MSI-H: Microsatellite-high colorectal cancer | ||
| MSS: Microsatellite stable colorectal cancer | ||
| Esophagus | 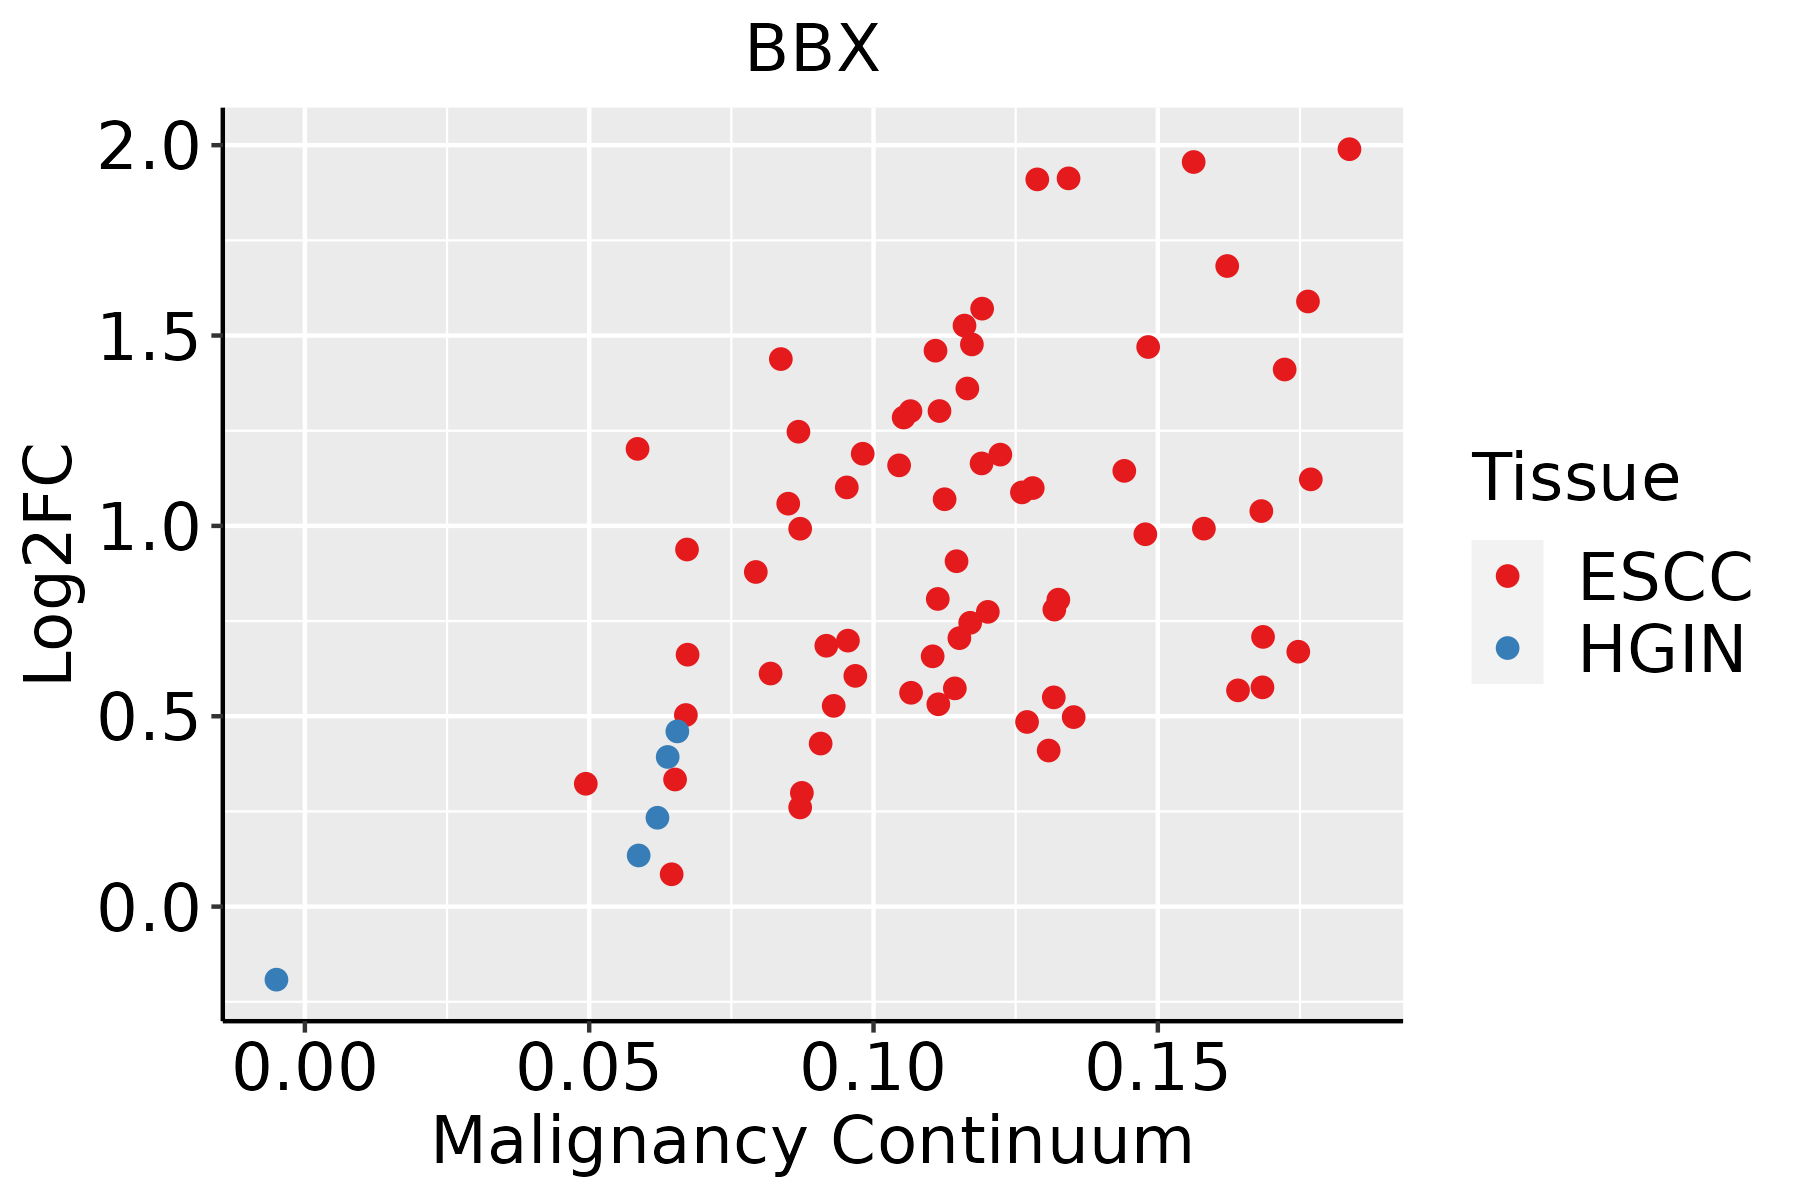 | ESCC: Esophageal squamous cell carcinoma |
| HGIN: High-grade intraepithelial neoplasias | ||
| LGIN: Low-grade intraepithelial neoplasias | ||
| Liver | 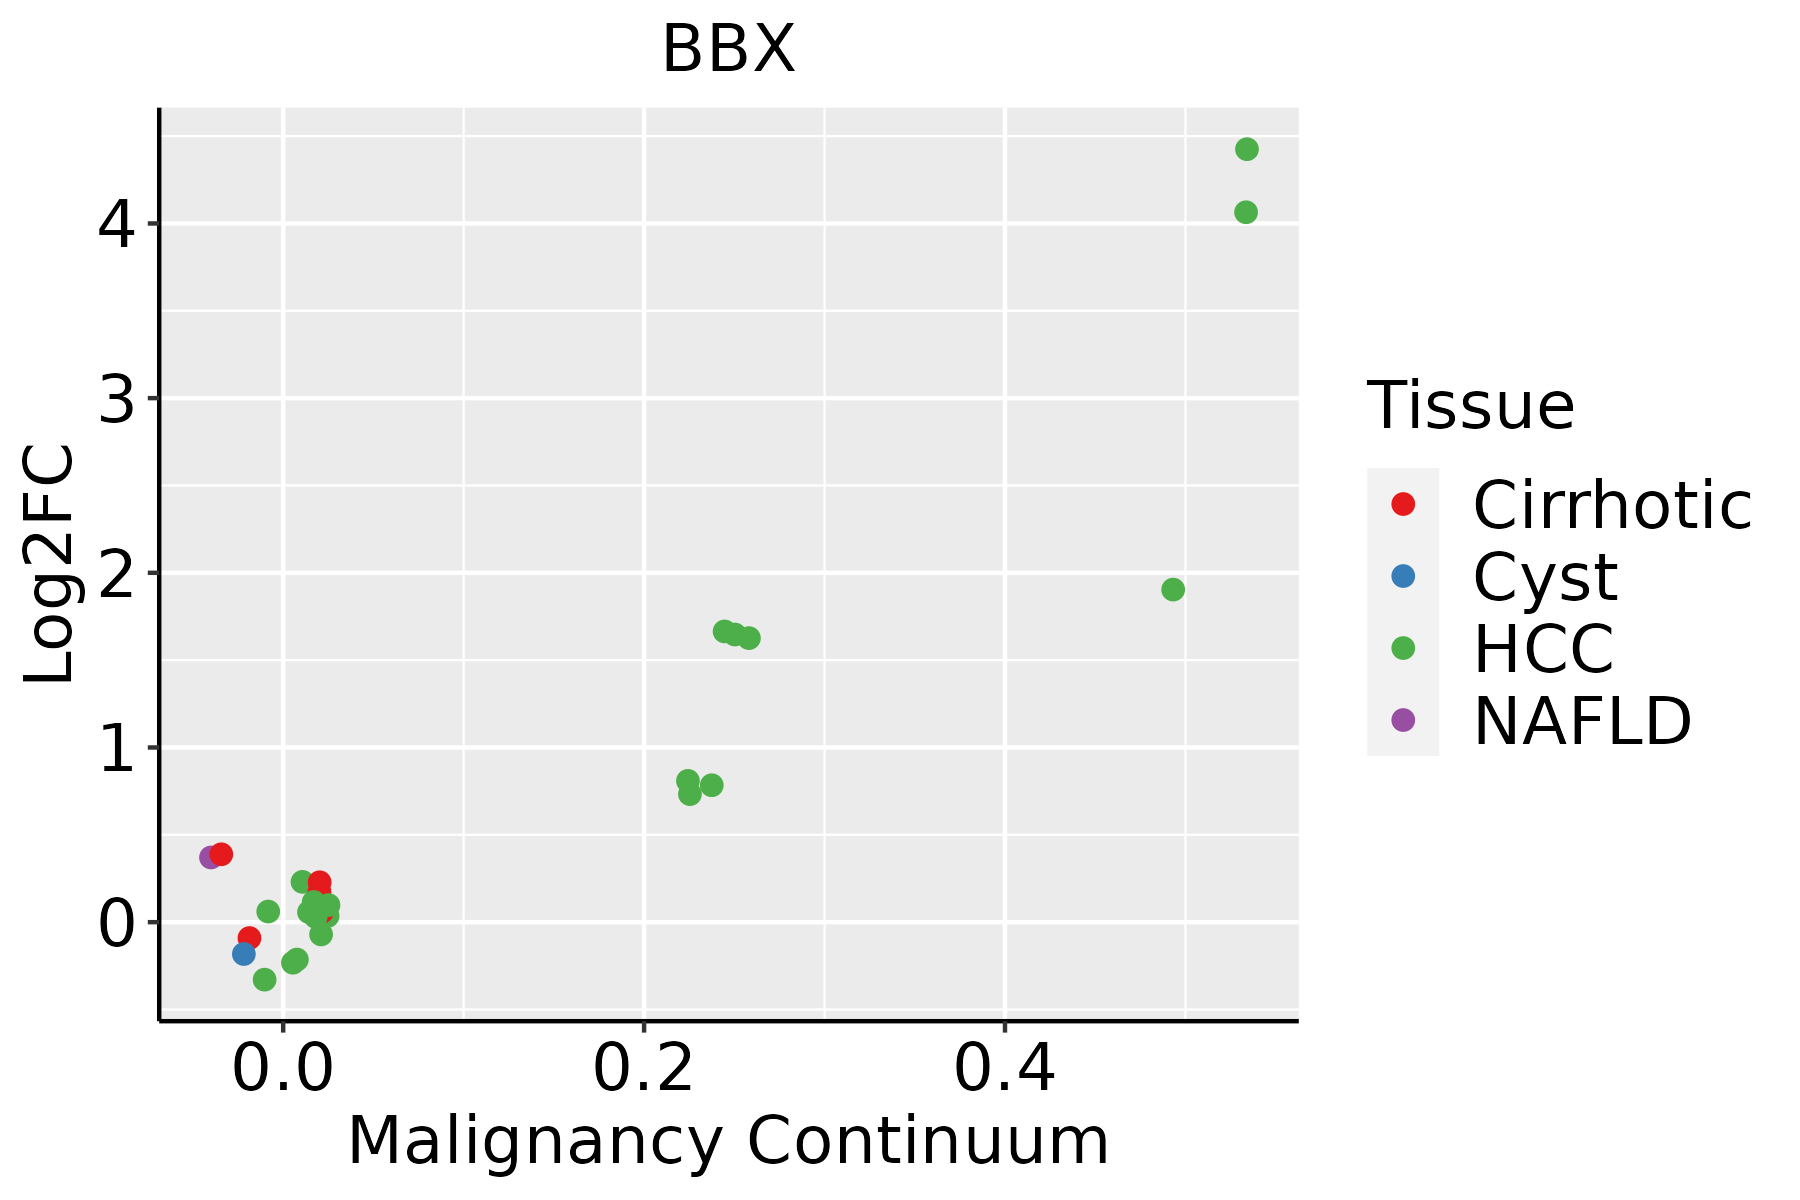 | HCC: Hepatocellular carcinoma |
| NAFLD: Non-alcoholic fatty liver disease | ||
| Lung | 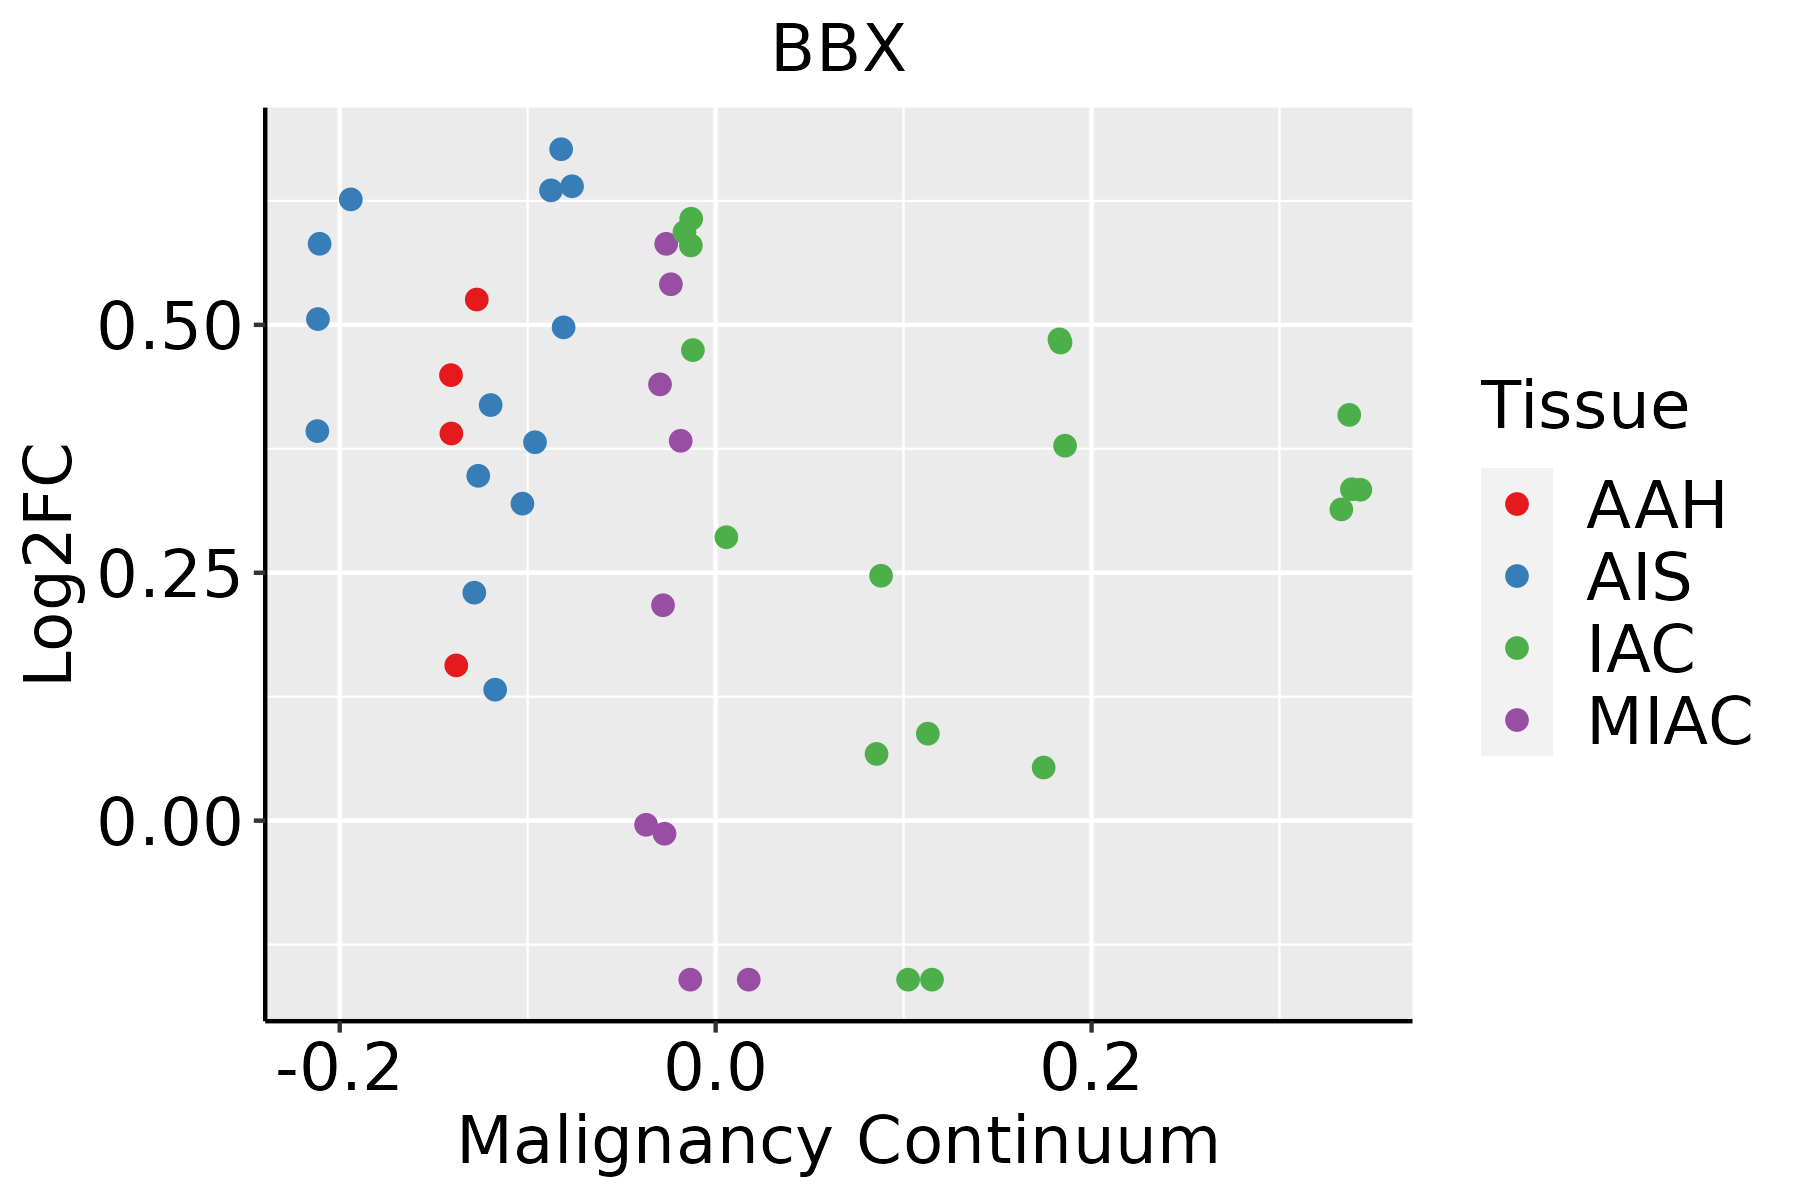 | AAH: Atypical adenomatous hyperplasia |
| AIS: Adenocarcinoma in situ | ||
| IAC: Invasive lung adenocarcinoma | ||
| MIA: Minimally invasive adenocarcinoma | ||
| Oral Cavity |  | EOLP: Erosive Oral lichen planus |
| LP: leukoplakia | ||
| NEOLP: Non-erosive oral lichen planus | ||
| OSCC: Oral squamous cell carcinoma | ||
| Prostate | 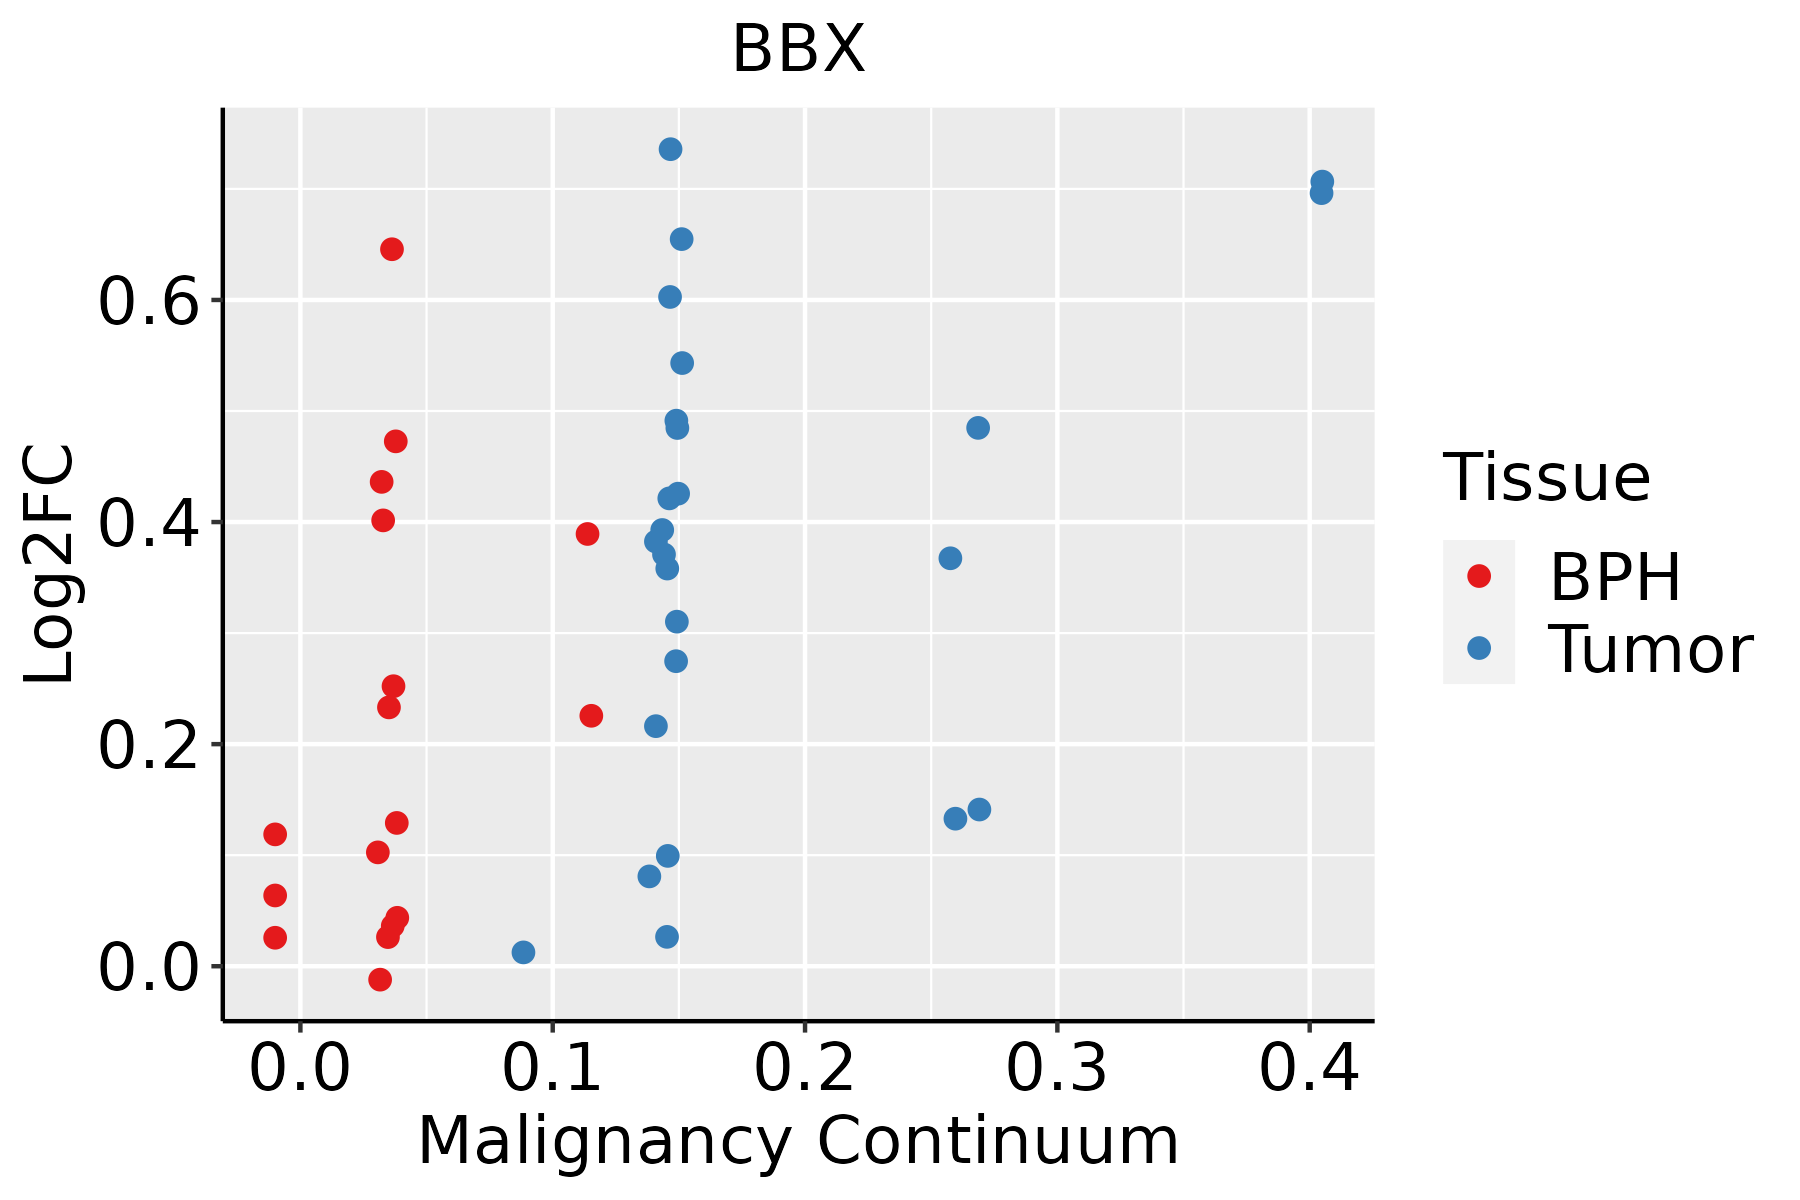 | BPH: Benign Prostatic Hyperplasia |
| Skin | 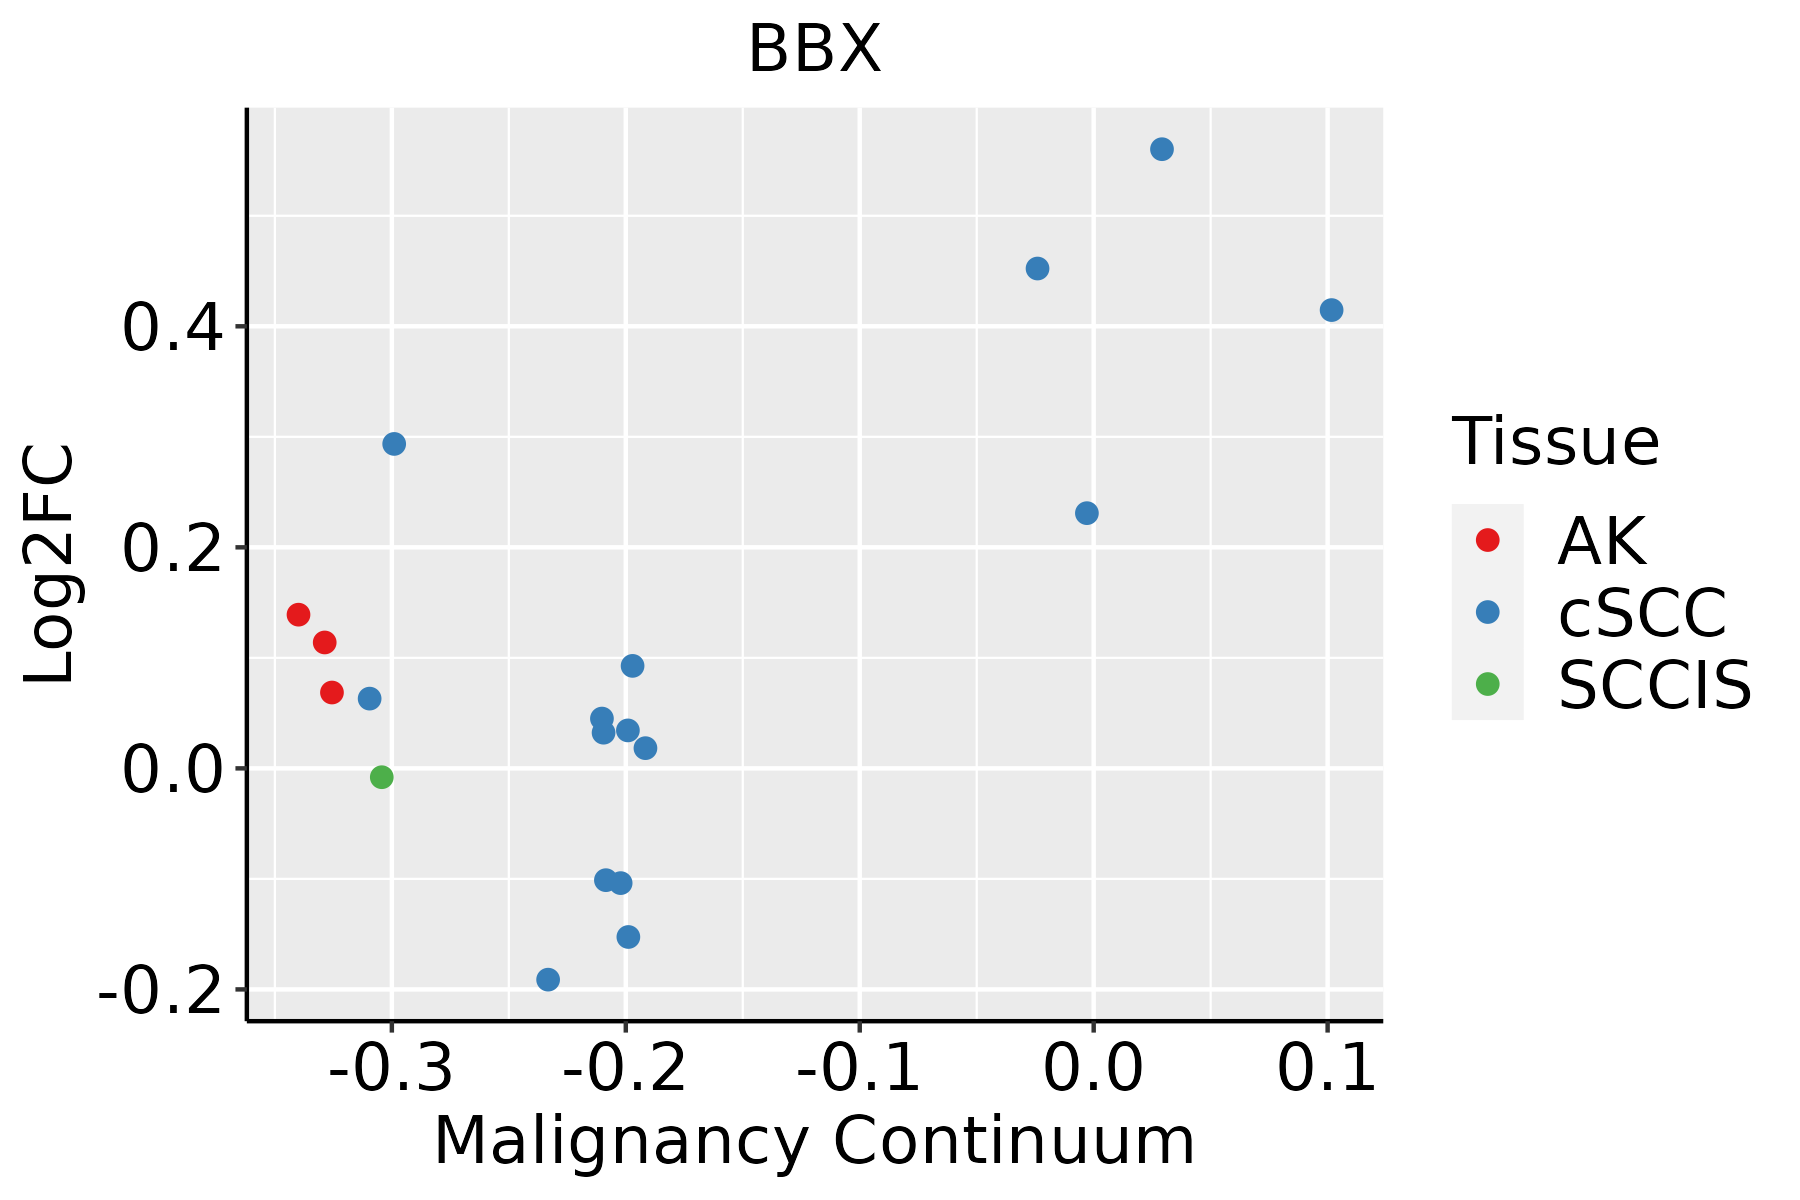 | AK: Actinic keratosis |
| cSCC: Cutaneous squamous cell carcinoma | ||
| SCCIS:squamous cell carcinoma in situ | ||
| Thyroid |  | ATC: Anaplastic thyroid cancer |
| HT: Hashimoto's thyroiditis | ||
| PTC: Papillary thyroid cancer |
| ∗log2FC in expression of this searched gene in stem-like cells from each diseased tissue sample relative to stem-like cells in normal samples in each tissue plotted against the malignancy continuum. Samples are colored based on if they are from different disease stage. |
Top |
Malignant transformation related pathway analysis |
| Find out the enriched GO biological processes and KEGG pathways involved in transition from healthy to precancer to cancer |
| Tissue | Disease Stage | Enriched GO biological Processes |
| Colorectum | AD |  |
| Colorectum | SER |  |
| Colorectum | MSS |  |
| Colorectum | MSI-H |  |
| Colorectum | FAP |  |
| ∗Top 15 enriched GO BP terms are showed in the bar plot of each disease state in each tissue. Each row represents a significant GO biological process which is colored according to the -log10(p.adjust). |
| Page: 1 2 3 4 5 6 7 8 9 |
| GO ID | Tissue | Disease Stage | Description | Gene Ratio | Bg Ratio | pvalue | p.adjust | Count |
| GO:00603482 | Cervix | N_HPV | bone development | 15/534 | 205/18723 | 8.27e-04 | 1.02e-02 | 15 |
| GO:0060348 | Colorectum | CRC | bone development | 37/2078 | 205/18723 | 1.96e-03 | 1.96e-02 | 37 |
| GO:00603485 | Esophagus | ESCC | bone development | 115/8552 | 205/18723 | 1.67e-03 | 7.72e-03 | 115 |
| GO:00603484 | Oral cavity | OSCC | bone development | 99/7305 | 205/18723 | 4.13e-03 | 1.68e-02 | 99 |
| GO:006034812 | Oral cavity | EOLP | bone development | 37/2218 | 205/18723 | 5.84e-03 | 2.95e-02 | 37 |
| GO:006034821 | Oral cavity | NEOLP | bone development | 38/2005 | 205/18723 | 5.28e-04 | 4.64e-03 | 38 |
| GO:00603483 | Prostate | BPH | bone development | 50/3107 | 205/18723 | 2.60e-03 | 1.39e-02 | 50 |
| GO:006034811 | Prostate | Tumor | bone development | 50/3246 | 205/18723 | 6.30e-03 | 2.89e-02 | 50 |
| GO:00603486 | Thyroid | PTC | bone development | 90/5968 | 205/18723 | 1.89e-04 | 1.42e-03 | 90 |
| GO:006034813 | Thyroid | ATC | bone development | 102/6293 | 205/18723 | 1.18e-06 | 1.52e-05 | 102 |
| Page: 1 |
| Pathway ID | Tissue | Disease Stage | Description | Gene Ratio | Bg Ratio | pvalue | p.adjust | qvalue | Count |
| Page: 1 |
Top |
Cell-cell communication analysis |
| Identification of potential cell-cell interactions between two cell types and their ligand-receptor pairs for different disease states |
| Ligand | Receptor | LRpair | Pathway | Tissue | Disease Stage |
| Page: 1 |
Top |
Single-cell gene regulatory network inference analysis |
| Find out the significant the regulons (TFs) and the target genes of each regulon across cell types for different disease states |
| TF | Cell Type | Tissue | Disease Stage | Target Gene | RSS | Regulon Activity |
| BBX | pDC | Breast | Healthy | PPIL2,HSPA14.1,MTR, etc. | 2.22e-02 |  |
| BBX | pDC | Breast | IDC | PPIL2,HSPA14.1,MTR, etc. | 2.20e-02 |  |
| BBX | CD8TEREX | Breast | Precancer | PPIL2,HSPA14.1,MTR, etc. | 2.21e-02 |  |
| BBX | NK | Oral cavity | ADJ | CABLES1,N4BP2L2,ARHGAP12, etc. | 4.09e-02 |  |
| BBX | ISLET | Pancreas | Healthy | MRPL48,OLFM4,HACD2, etc. | 3.56e-02 |  |
| BBX | CD8TEXINT | Pancreas | PanIN | ZBTB20,AC245297.3,TGFBR2, etc. | 3.01e-01 |  |
| BBX | BN | Pancreas | PDAC | ZBTB20,AC245297.3,TGFBR2, etc. | 1.83e-01 |  |
| BBX | MYOFIB | Pancreas | PanIN | IFIH1,FMNL2,N4BP2L2, etc. | 3.20e-01 | |
| BBX | INCAF | Skin | ADJ | DTD2,MYNN,CERS2, etc. | 1.99e-01 |  |
| BBX | SMC | Skin | cSCC | DTD2,MYNN,CERS2, etc. | 1.33e-02 |  |
| ∗The dot plots of a searched regulon are shown for all cell subpopulations in each disease state of each tissue based on the regulon specific score inferred using pySCENIC and by calculating the average expression. |
| Page: 1 2 |
Top |
Somatic mutation of malignant transformation related genes |
| Annotation of somatic variants for genes involved in malignant transformation |
| Hugo Symbol | Variant Class | Variant Classification | dbSNP RS | HGVSc | HGVSp | HGVSp Short | SWISSPROT | BIOTYPE | SIFT | PolyPhen | Tumor Sample Barcode | Tissue | Histology | Sex | Age | Stage | Therapy Types | Drugs | Outcome |
| BBX | SNV | Missense_Mutation | novel | c.745N>T | p.Ala249Ser | p.A249S | Q8WY36 | protein_coding | tolerated(0.06) | benign(0.23) | TCGA-3C-AALJ-01 | Breast | breast invasive carcinoma | Female | <65 | I/II | Chemotherapy | doxorubicin | SD |
| BBX | SNV | Missense_Mutation | rs771843919 | c.530C>G | p.Ser177Cys | p.S177C | Q8WY36 | protein_coding | deleterious(0) | probably_damaging(0.969) | TCGA-5L-AAT1-01 | Breast | breast invasive carcinoma | Female | <65 | III/IV | Hormone Therapy | letrozol | SD |
| BBX | SNV | Missense_Mutation | c.784N>G | p.Thr262Ala | p.T262A | Q8WY36 | protein_coding | tolerated(0.78) | benign(0) | TCGA-A1-A0SO-01 | Breast | breast invasive carcinoma | Female | >=65 | I/II | Chemotherapy | SD | ||
| BBX | SNV | Missense_Mutation | c.41N>C | p.Gly14Ala | p.G14A | Q8WY36 | protein_coding | deleterious(0.03) | probably_damaging(0.999) | TCGA-A8-A0A9-01 | Breast | breast invasive carcinoma | Female | >=65 | I/II | Hormone Therapy | anastrozole | SD | |
| BBX | SNV | Missense_Mutation | c.823N>C | p.Glu275Gln | p.E275Q | Q8WY36 | protein_coding | tolerated(0.07) | possibly_damaging(0.705) | TCGA-AN-A0AJ-01 | Breast | breast invasive carcinoma | Female | >=65 | I/II | Unknown | Unknown | SD | |
| BBX | SNV | Missense_Mutation | c.2483N>T | p.Arg828Met | p.R828M | Q8WY36 | protein_coding | deleterious(0) | probably_damaging(0.999) | TCGA-AN-A0AK-01 | Breast | breast invasive carcinoma | Female | >=65 | I/II | Unknown | Unknown | SD | |
| BBX | SNV | Missense_Mutation | novel | c.2736C>A | p.His912Gln | p.H912Q | Q8WY36 | protein_coding | deleterious(0) | probably_damaging(0.981) | TCGA-BH-A0BZ-01 | Breast | breast invasive carcinoma | Female | <65 | III/IV | Chemotherapy | doxorubicin | CR |
| BBX | SNV | Missense_Mutation | c.1744N>A | p.Asp582Asn | p.D582N | Q8WY36 | protein_coding | tolerated(0.06) | benign(0.21) | TCGA-D8-A27G-01 | Breast | breast invasive carcinoma | Female | >=65 | I/II | Unknown | Unknown | SD | |
| BBX | SNV | Missense_Mutation | c.617G>C | p.Gly206Ala | p.G206A | Q8WY36 | protein_coding | deleterious(0.01) | probably_damaging(1) | TCGA-EW-A1PB-01 | Breast | breast invasive carcinoma | Female | >=65 | III/IV | Unknown | Unknown | SD | |
| BBX | SNV | Missense_Mutation | c.1444N>T | p.Asp482Tyr | p.D482Y | Q8WY36 | protein_coding | deleterious(0) | probably_damaging(0.997) | TCGA-GM-A2DH-01 | Breast | breast invasive carcinoma | Female | <65 | I/II | Chemotherapy | taxol | CR |
| Page: 1 2 3 4 5 6 7 8 9 10 11 12 |
Top |
Related drugs of malignant transformation related genes |
| Identification of chemicals and drugs interact with genes involved in malignant transfromation |
| (DGIdb 4.0) |
| Entrez ID | Symbol | Category | Interaction Types | Drug Claim Name | Drug Name | PMIDs |
| Page: 1 |

Copyright 2023-Present -The University of Texas Health Science Center at Houston |