
|
|||||
|
 | |
| |
| |
| |
| |
| |
|
Gene: BBS9 |
Gene summary for BBS9 |
| Gene information | Species | Human | Gene symbol | BBS9 | Gene ID | 27241 |
| Gene name | Bardet-Biedl syndrome 9 | |
| Gene Alias | B1 | |
| Cytomap | 7p14.3 | |
| Gene Type | protein-coding | GO ID | GO:0003008 | UniProtAcc | Q3SYG4 |
Top |
Malignant transformation analysis |
| Identification of the aberrant gene expression in precancerous and cancerous lesions by comparing the gene expression of stem-like cells in diseased tissues with normal stem cells |
| Entrez ID | Symbol | Replicates | Species | Organ | Tissue | Adj P-value | Log2FC | Malignancy |
| 27241 | BBS9 | CCI_3 | Human | Cervix | CC | 8.43e-08 | 5.33e-01 | 0.516 |
| 27241 | BBS9 | HTA11_3410_2000001011 | Human | Colorectum | AD | 3.51e-02 | -2.40e-01 | 0.0155 |
| 27241 | BBS9 | HTA11_10711_2000001011 | Human | Colorectum | AD | 2.71e-10 | 8.09e-01 | 0.0338 |
| 27241 | BBS9 | HTA11_6818_2000001011 | Human | Colorectum | AD | 2.87e-15 | 1.17e+00 | 0.0112 |
| 27241 | BBS9 | HTA11_6818_2000001021 | Human | Colorectum | AD | 1.89e-02 | 5.24e-01 | 0.0588 |
| 27241 | BBS9 | HTA11_99999974143_84620 | Human | Colorectum | MSS | 1.85e-36 | 1.28e+00 | 0.3005 |
| 27241 | BBS9 | A015-C-203 | Human | Colorectum | FAP | 1.97e-10 | -1.47e-01 | -0.1294 |
| 27241 | BBS9 | A002-C-201 | Human | Colorectum | FAP | 2.05e-03 | -1.77e-01 | 0.0324 |
| 27241 | BBS9 | A001-C-108 | Human | Colorectum | FAP | 6.32e-06 | -1.38e-01 | -0.0272 |
| 27241 | BBS9 | A002-C-205 | Human | Colorectum | FAP | 7.73e-10 | -2.75e-01 | -0.1236 |
| 27241 | BBS9 | A015-C-006 | Human | Colorectum | FAP | 8.21e-06 | -2.45e-01 | -0.0994 |
| 27241 | BBS9 | A002-C-114 | Human | Colorectum | FAP | 8.86e-07 | -2.78e-01 | -0.1561 |
| 27241 | BBS9 | A015-C-104 | Human | Colorectum | FAP | 1.71e-10 | -1.65e-01 | -0.1899 |
| 27241 | BBS9 | A001-C-014 | Human | Colorectum | FAP | 1.91e-04 | -6.82e-02 | 0.0135 |
| 27241 | BBS9 | A002-C-016 | Human | Colorectum | FAP | 1.64e-07 | -1.16e-01 | 0.0521 |
| 27241 | BBS9 | A015-C-002 | Human | Colorectum | FAP | 6.54e-05 | -2.95e-01 | -0.0763 |
| 27241 | BBS9 | A002-C-116 | Human | Colorectum | FAP | 1.90e-13 | -2.70e-01 | -0.0452 |
| 27241 | BBS9 | A014-C-008 | Human | Colorectum | FAP | 5.02e-06 | -3.43e-01 | -0.191 |
| 27241 | BBS9 | A018-E-020 | Human | Colorectum | FAP | 1.29e-06 | -1.48e-01 | -0.2034 |
| 27241 | BBS9 | F034 | Human | Colorectum | FAP | 1.16e-05 | -1.23e-01 | -0.0665 |
| Page: 1 2 3 |
| Tissue | Expression Dynamics | Abbreviation |
| Cervix | 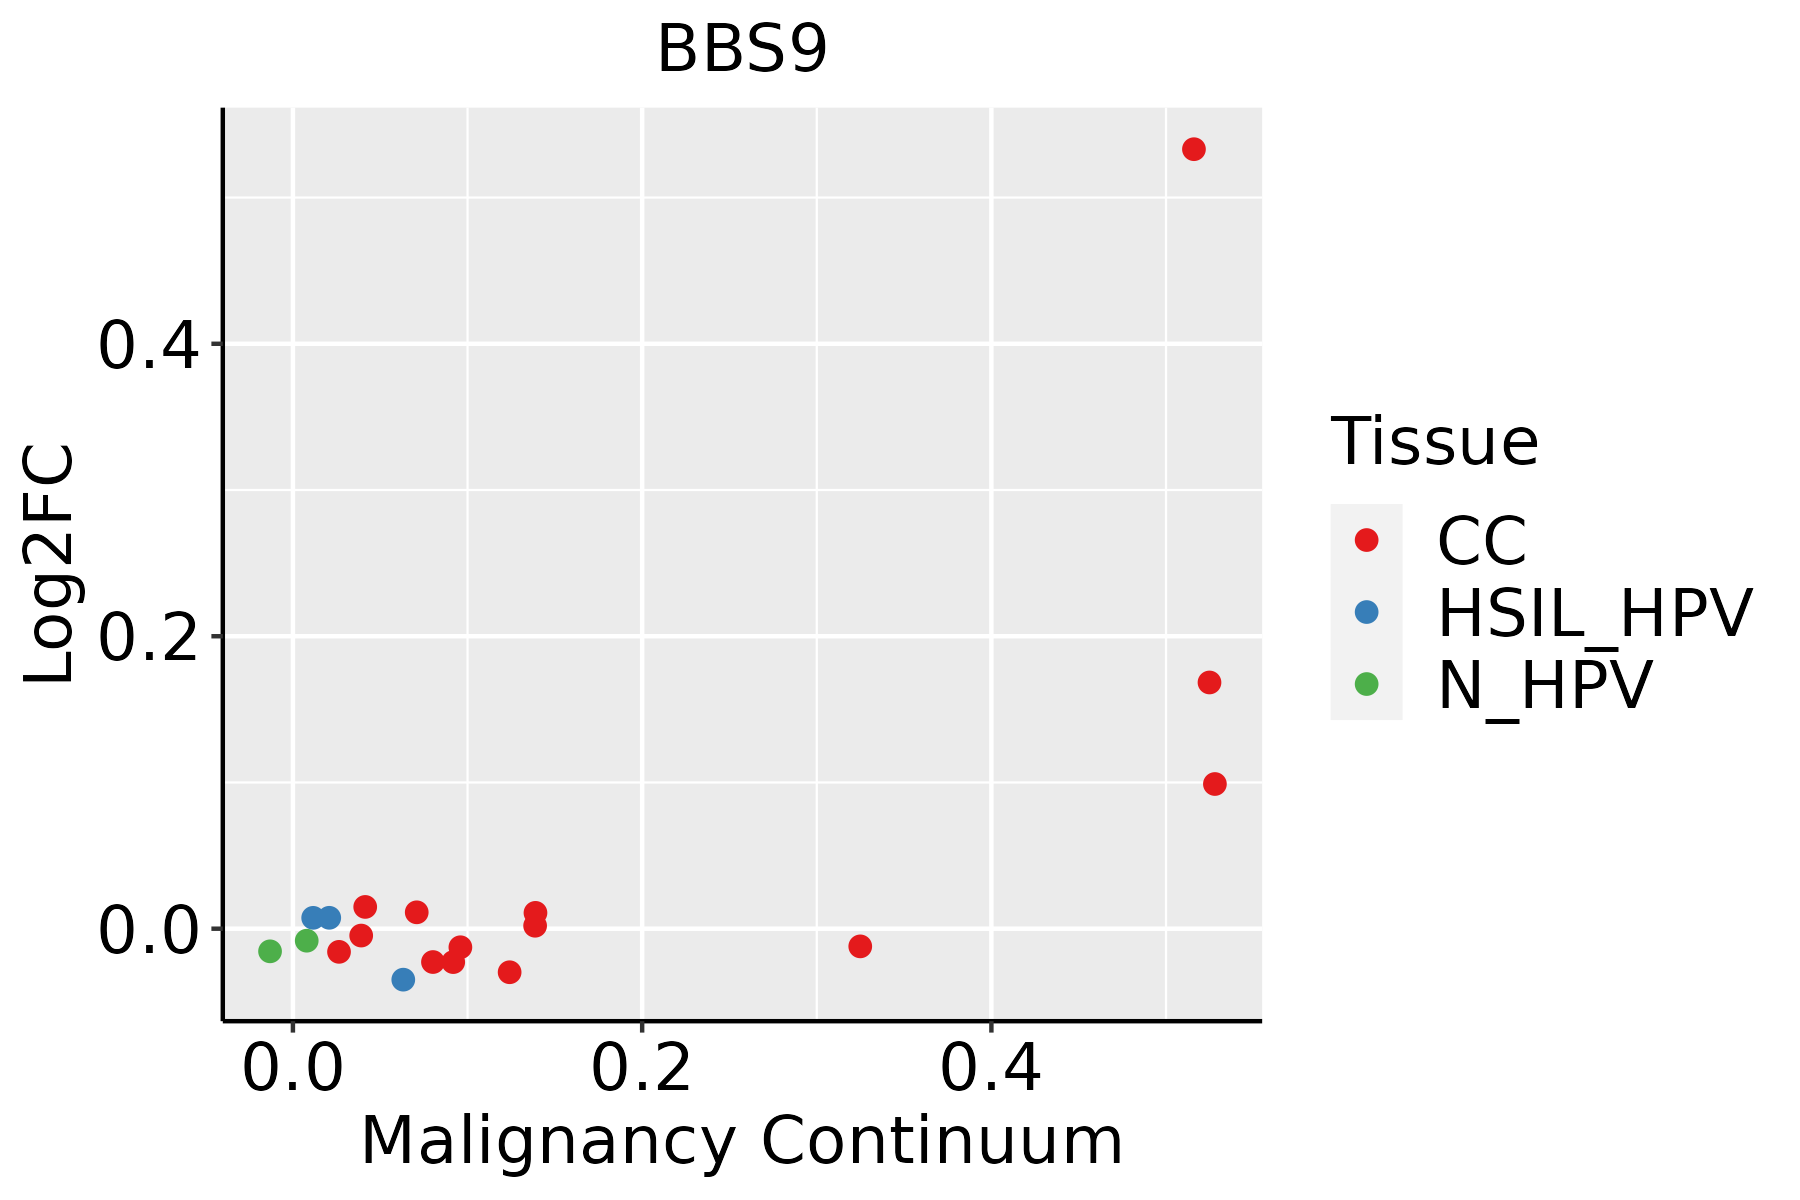 | CC: Cervix cancer |
| HSIL_HPV: HPV-infected high-grade squamous intraepithelial lesions | ||
| N_HPV: HPV-infected normal cervix | ||
| Colorectum (GSE201348) |  | FAP: Familial adenomatous polyposis |
| CRC: Colorectal cancer | ||
| Colorectum (HTA11) |  | AD: Adenomas |
| SER: Sessile serrated lesions | ||
| MSI-H: Microsatellite-high colorectal cancer | ||
| MSS: Microsatellite stable colorectal cancer | ||
| Endometrium |  | AEH: Atypical endometrial hyperplasia |
| EEC: Endometrioid Cancer | ||
| Lung |  | AAH: Atypical adenomatous hyperplasia |
| AIS: Adenocarcinoma in situ | ||
| IAC: Invasive lung adenocarcinoma | ||
| MIA: Minimally invasive adenocarcinoma |
| ∗log2FC in expression of this searched gene in stem-like cells from each diseased tissue sample relative to stem-like cells in normal samples in each tissue plotted against the malignancy continuum. Samples are colored based on if they are from different disease stage. |
Top |
Malignant transformation related pathway analysis |
| Find out the enriched GO biological processes and KEGG pathways involved in transition from healthy to precancer to cancer |
| Tissue | Disease Stage | Enriched GO biological Processes |
| Colorectum | AD |  |
| Colorectum | SER |  |
| Colorectum | MSS |  |
| Colorectum | MSI-H |  |
| Colorectum | FAP |  |
| ∗Top 15 enriched GO BP terms are showed in the bar plot of each disease state in each tissue. Each row represents a significant GO biological process which is colored according to the -log10(p.adjust). |
| Page: 1 2 3 4 5 6 7 8 9 |
| GO ID | Tissue | Disease Stage | Description | Gene Ratio | Bg Ratio | pvalue | p.adjust | Count |
| GO:00454445 | Cervix | CC | fat cell differentiation | 53/2311 | 229/18723 | 3.72e-06 | 9.75e-05 | 53 |
| GO:00454446 | Endometrium | EEC | fat cell differentiation | 39/2168 | 229/18723 | 8.69e-03 | 4.71e-02 | 39 |
| GO:00454443 | Lung | IAC | fat cell differentiation | 42/2061 | 229/18723 | 6.19e-04 | 8.50e-03 | 42 |
| GO:0060271 | Lung | IAC | cilium assembly | 55/2061 | 337/18723 | 1.84e-03 | 1.88e-02 | 55 |
| GO:0044782 | Lung | IAC | cilium organization | 58/2061 | 368/18723 | 3.15e-03 | 2.75e-02 | 58 |
| GO:004544411 | Lung | AIS | fat cell differentiation | 37/1849 | 229/18723 | 1.88e-03 | 2.08e-02 | 37 |
| GO:00602711 | Lung | MIAC | cilium assembly | 37/967 | 337/18723 | 1.29e-05 | 9.85e-04 | 37 |
| GO:00447821 | Lung | MIAC | cilium organization | 38/967 | 368/18723 | 3.93e-05 | 2.08e-03 | 38 |
| Page: 1 |
| Pathway ID | Tissue | Disease Stage | Description | Gene Ratio | Bg Ratio | pvalue | p.adjust | qvalue | Count |
| Page: 1 |
Top |
Cell-cell communication analysis |
| Identification of potential cell-cell interactions between two cell types and their ligand-receptor pairs for different disease states |
| Ligand | Receptor | LRpair | Pathway | Tissue | Disease Stage |
| Page: 1 |
Top |
Single-cell gene regulatory network inference analysis |
| Find out the significant the regulons (TFs) and the target genes of each regulon across cell types for different disease states |
| TF | Cell Type | Tissue | Disease Stage | Target Gene | RSS | Regulon Activity |
| ∗The dot plots of a searched regulon are shown for all cell subpopulations in each disease state of each tissue based on the regulon specific score inferred using pySCENIC and by calculating the average expression. |
| Page: 1 |
Top |
Somatic mutation of malignant transformation related genes |
| Annotation of somatic variants for genes involved in malignant transformation |
| Hugo Symbol | Variant Class | Variant Classification | dbSNP RS | HGVSc | HGVSp | HGVSp Short | SWISSPROT | BIOTYPE | SIFT | PolyPhen | Tumor Sample Barcode | Tissue | Histology | Sex | Age | Stage | Therapy Types | Drugs | Outcome |
| BBS9 | SNV | Missense_Mutation | novel | c.643G>T | p.Asp215Tyr | p.D215Y | Q3SYG4 | protein_coding | deleterious(0) | probably_damaging(0.992) | TCGA-AN-A046-01 | Breast | breast invasive carcinoma | Female | >=65 | I/II | Unknown | Unknown | SD |
| BBS9 | SNV | Missense_Mutation | c.1367N>C | p.Lys456Thr | p.K456T | Q3SYG4 | protein_coding | tolerated(0.34) | benign(0.036) | TCGA-C8-A12P-01 | Breast | breast invasive carcinoma | Female | <65 | I/II | Unknown | Unknown | SD | |
| BBS9 | SNV | Missense_Mutation | c.538N>G | p.Leu180Val | p.L180V | Q3SYG4 | protein_coding | deleterious(0.05) | probably_damaging(0.999) | TCGA-D8-A1JA-01 | Breast | breast invasive carcinoma | Female | <65 | III/IV | Chemotherapy | adriamycin | PD | |
| BBS9 | SNV | Missense_Mutation | novel | c.1771N>T | p.Leu591Phe | p.L591F | Q3SYG4 | protein_coding | deleterious(0) | probably_damaging(0.996) | TCGA-E2-A14P-01 | Breast | breast invasive carcinoma | Female | >=65 | III/IV | Targeted Molecular therapy | trastuzumab | SD |
| BBS9 | SNV | Missense_Mutation | c.2419C>G | p.Gln807Glu | p.Q807E | Q3SYG4 | protein_coding | deleterious(0) | benign(0.007) | TCGA-E2-A1LH-01 | Breast | breast invasive carcinoma | Female | <65 | I/II | Chemotherapy | adriamycin | SD | |
| BBS9 | SNV | Missense_Mutation | c.1784N>A | p.Thr595Asn | p.T595N | Q3SYG4 | protein_coding | tolerated(0.14) | probably_damaging(0.982) | TCGA-GM-A2DB-01 | Breast | breast invasive carcinoma | Female | <65 | I/II | Chemotherapy | taxol | CR | |
| BBS9 | insertion | Frame_Shift_Ins | novel | c.2276_2277insCTGCCTACATCTCTTTTCCAGTATCTCCG | p.Gln760CysfsTer31 | p.Q760Cfs*31 | Q3SYG4 | protein_coding | TCGA-A8-A08H-01 | Breast | breast invasive carcinoma | Female | >=65 | I/II | Unknown | Unknown | SD | ||
| BBS9 | insertion | Frame_Shift_Ins | novel | c.195_196insTGGGTAGCTGGGATTACGGGCATGCGCCACCACACCTA | p.Glu66TrpfsTer13 | p.E66Wfs*13 | Q3SYG4 | protein_coding | TCGA-BH-A0B8-01 | Breast | breast invasive carcinoma | Female | <65 | I/II | Hormone Therapy | arimidex | SD | ||
| BBS9 | SNV | Missense_Mutation | novel | c.1507A>C | p.Asn503His | p.N503H | Q3SYG4 | protein_coding | tolerated(0.1) | possibly_damaging(0.717) | TCGA-2W-A8YY-01 | Cervix | cervical & endocervical cancer | Female | <65 | I/II | Chemotherapy | cisplatin | CR |
| BBS9 | SNV | Missense_Mutation | novel | c.2442N>T | p.Leu814Phe | p.L814F | Q3SYG4 | protein_coding | deleterious(0.01) | possibly_damaging(0.889) | TCGA-C5-A8XK-01 | Cervix | cervical & endocervical cancer | Female | <65 | I/II | Chemotherapy | cisplatin | SD |
| Page: 1 2 3 4 5 6 7 8 9 10 11 12 |
Top |
Related drugs of malignant transformation related genes |
| Identification of chemicals and drugs interact with genes involved in malignant transfromation |
| (DGIdb 4.0) |
| Entrez ID | Symbol | Category | Interaction Types | Drug Claim Name | Drug Name | PMIDs |
| Page: 1 |

Copyright 2023-Present -The University of Texas Health Science Center at Houston |