
|
|||||
|
 | |
| |
| |
| |
| |
| |
|
Gene: BBOX1 |
Gene summary for BBOX1 |
| Gene information | Species | Human | Gene symbol | BBOX1 | Gene ID | 8424 |
| Gene name | gamma-butyrobetaine hydroxylase 1 | |
| Gene Alias | BBH | |
| Cytomap | 11p14.2 | |
| Gene Type | protein-coding | GO ID | GO:0006575 | UniProtAcc | O75936 |
Top |
Malignant transformation analysis |
| Identification of the aberrant gene expression in precancerous and cancerous lesions by comparing the gene expression of stem-like cells in diseased tissues with normal stem cells |
| Entrez ID | Symbol | Replicates | Species | Organ | Tissue | Adj P-value | Log2FC | Malignancy |
| 8424 | BBOX1 | P2T-E | Human | Esophagus | ESCC | 4.76e-05 | 2.26e-01 | 0.1177 |
| 8424 | BBOX1 | P8T-E | Human | Esophagus | ESCC | 1.59e-14 | 2.46e-01 | 0.0889 |
| 8424 | BBOX1 | P9T-E | Human | Esophagus | ESCC | 9.00e-17 | 3.83e-01 | 0.1131 |
| 8424 | BBOX1 | P39T-E | Human | Esophagus | ESCC | 1.94e-47 | 8.70e-01 | 0.0894 |
| 8424 | BBOX1 | P62T-E | Human | Esophagus | ESCC | 7.57e-05 | 3.21e-01 | 0.1302 |
| 8424 | BBOX1 | P79T-E | Human | Esophagus | ESCC | 2.14e-04 | 1.55e-01 | 0.1154 |
| 8424 | BBOX1 | P89T-E | Human | Esophagus | ESCC | 1.43e-16 | 6.44e-01 | 0.1752 |
| 8424 | BBOX1 | HCC1 | Human | Liver | HCC | 4.21e-02 | 3.58e+00 | 0.5336 |
| 8424 | BBOX1 | HCC2 | Human | Liver | HCC | 2.97e-11 | 3.68e+00 | 0.5341 |
| 8424 | BBOX1 | HCC5 | Human | Liver | HCC | 1.49e-04 | -2.68e-02 | 0.4932 |
| 8424 | BBOX1 | Pt13.a | Human | Liver | HCC | 4.06e-02 | -1.21e-01 | 0.021 |
| 8424 | BBOX1 | Pt14.d | Human | Liver | HCC | 4.06e-02 | -1.21e-01 | 0.0143 |
| Page: 1 |
| Tissue | Expression Dynamics | Abbreviation |
| Esophagus | 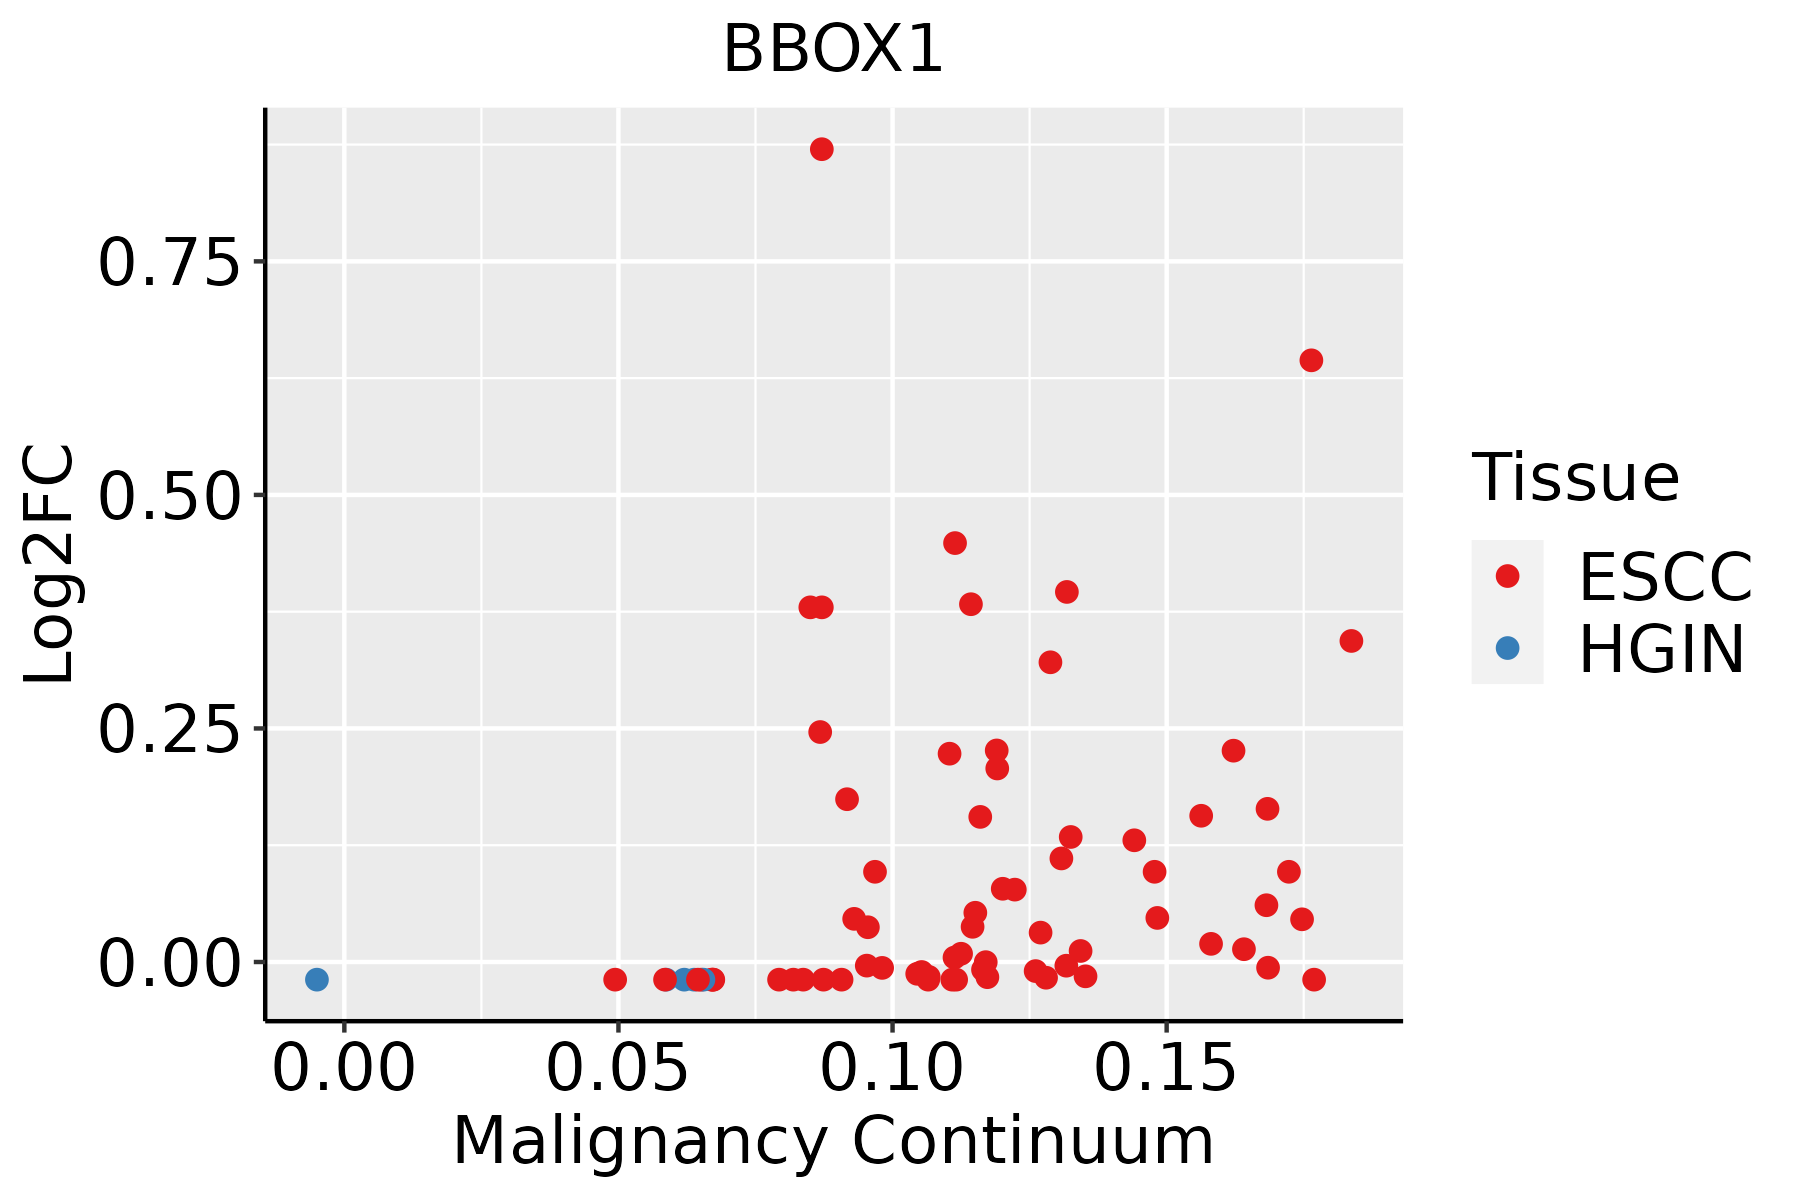 | ESCC: Esophageal squamous cell carcinoma |
| HGIN: High-grade intraepithelial neoplasias | ||
| LGIN: Low-grade intraepithelial neoplasias | ||
| Liver | 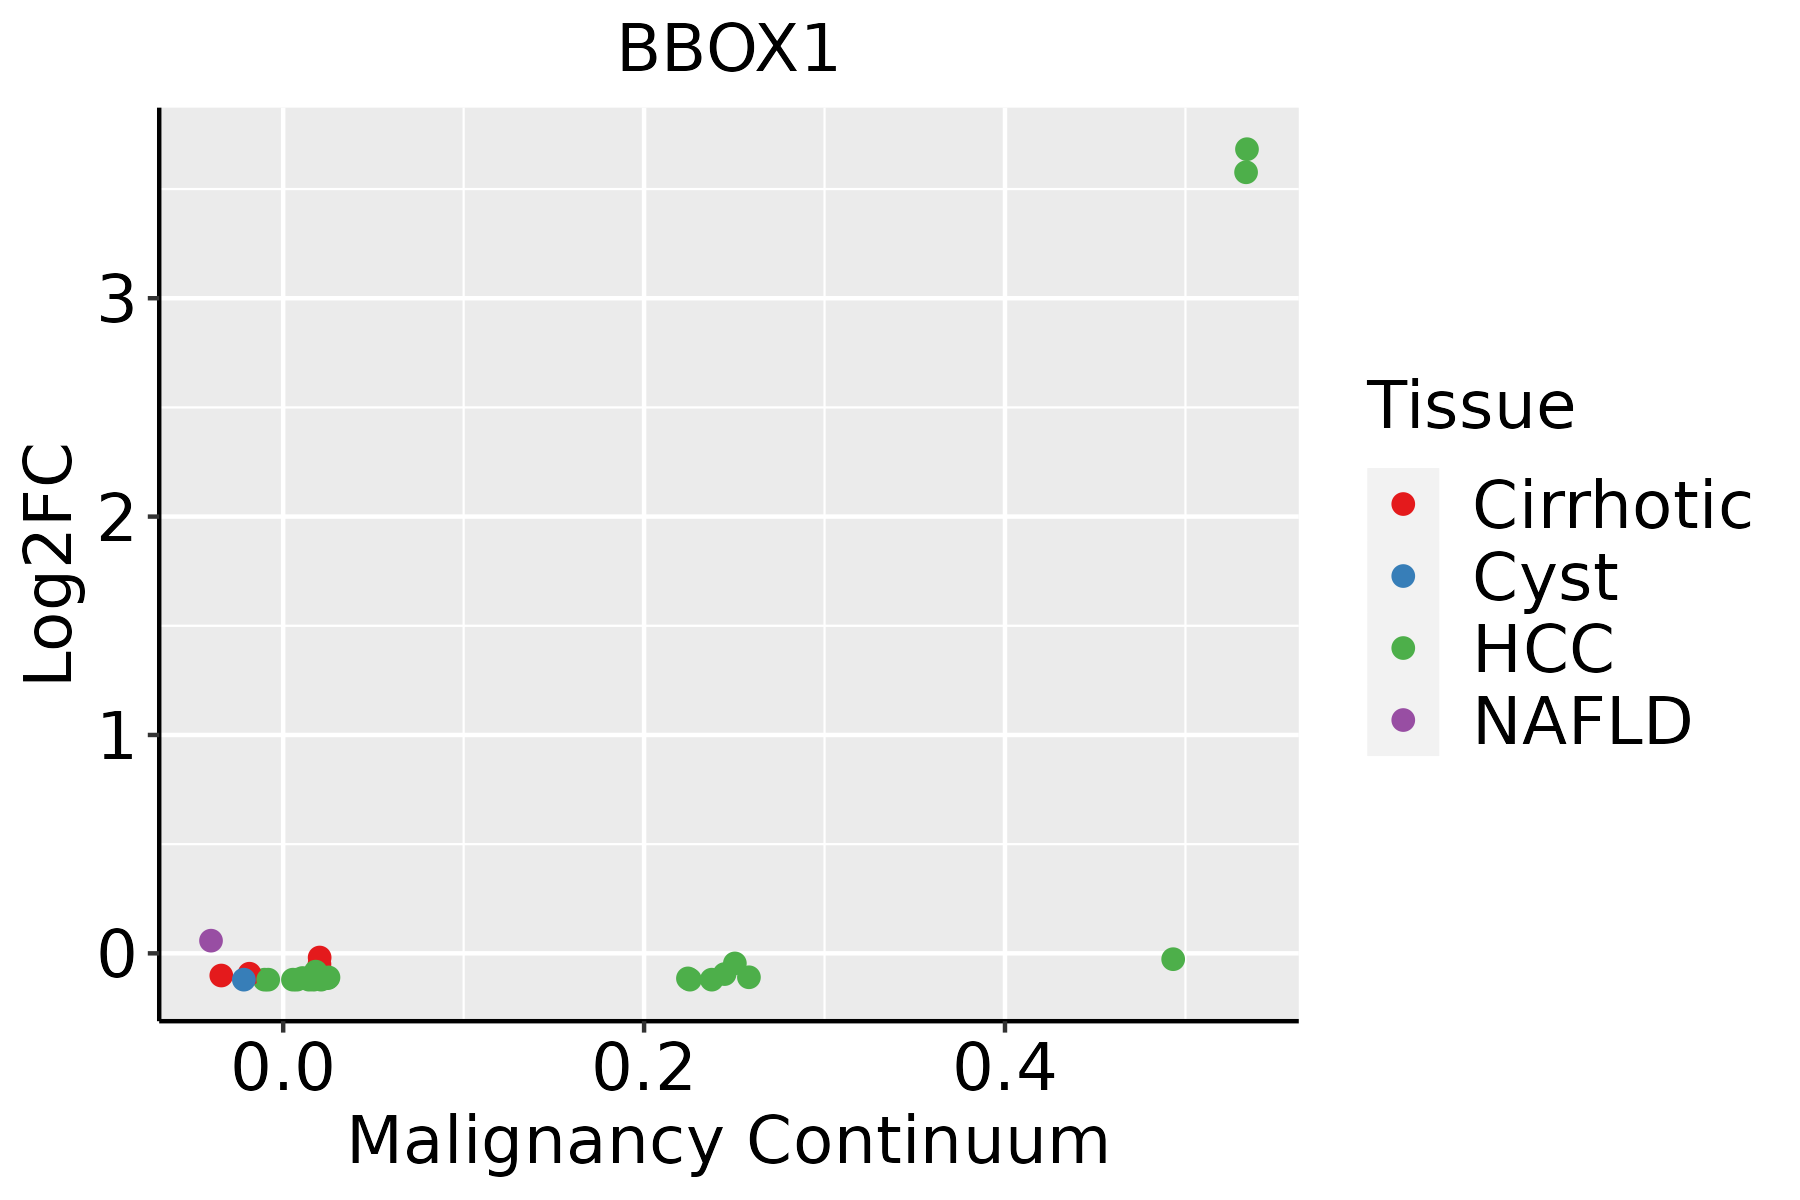 | HCC: Hepatocellular carcinoma |
| NAFLD: Non-alcoholic fatty liver disease |
| ∗log2FC in expression of this searched gene in stem-like cells from each diseased tissue sample relative to stem-like cells in normal samples in each tissue plotted against the malignancy continuum. Samples are colored based on if they are from different disease stage. |
Top |
Malignant transformation related pathway analysis |
| Find out the enriched GO biological processes and KEGG pathways involved in transition from healthy to precancer to cancer |
| Tissue | Disease Stage | Enriched GO biological Processes |
| Colorectum | AD |  |
| Colorectum | SER |  |
| Colorectum | MSS |  |
| Colorectum | MSI-H |  |
| Colorectum | FAP |  |
| ∗Top 15 enriched GO BP terms are showed in the bar plot of each disease state in each tissue. Each row represents a significant GO biological process which is colored according to the -log10(p.adjust). |
| Page: 1 2 3 4 5 6 7 8 9 |
| GO ID | Tissue | Disease Stage | Description | Gene Ratio | Bg Ratio | pvalue | p.adjust | Count |
| GO:00065757 | Esophagus | ESCC | cellular modified amino acid metabolic process | 112/8552 | 188/18723 | 8.31e-05 | 6.06e-04 | 112 |
| GO:00423986 | Esophagus | ESCC | cellular modified amino acid biosynthetic process | 34/8552 | 46/18723 | 9.39e-05 | 6.70e-04 | 34 |
| GO:000657521 | Liver | HCC | cellular modified amino acid metabolic process | 119/7958 | 188/18723 | 6.47e-09 | 1.67e-07 | 119 |
| GO:004239821 | Liver | HCC | cellular modified amino acid biosynthetic process | 34/7958 | 46/18723 | 1.53e-05 | 1.67e-04 | 34 |
| GO:0006577 | Liver | HCC | amino-acid betaine metabolic process | 13/7958 | 17/18723 | 4.77e-03 | 2.02e-02 | 13 |
| Page: 1 |
| Pathway ID | Tissue | Disease Stage | Description | Gene Ratio | Bg Ratio | pvalue | p.adjust | qvalue | Count |
| hsa0031041 | Liver | HCC | Lysine degradation | 47/4020 | 63/8465 | 1.02e-05 | 7.58e-05 | 4.22e-05 | 47 |
| hsa0031051 | Liver | HCC | Lysine degradation | 47/4020 | 63/8465 | 1.02e-05 | 7.58e-05 | 4.22e-05 | 47 |
| Page: 1 |
Top |
Cell-cell communication analysis |
| Identification of potential cell-cell interactions between two cell types and their ligand-receptor pairs for different disease states |
| Ligand | Receptor | LRpair | Pathway | Tissue | Disease Stage |
| Page: 1 |
Top |
Single-cell gene regulatory network inference analysis |
| Find out the significant the regulons (TFs) and the target genes of each regulon across cell types for different disease states |
| TF | Cell Type | Tissue | Disease Stage | Target Gene | RSS | Regulon Activity |
| ∗The dot plots of a searched regulon are shown for all cell subpopulations in each disease state of each tissue based on the regulon specific score inferred using pySCENIC and by calculating the average expression. |
| Page: 1 |
Top |
Somatic mutation of malignant transformation related genes |
| Annotation of somatic variants for genes involved in malignant transformation |
| Hugo Symbol | Variant Class | Variant Classification | dbSNP RS | HGVSc | HGVSp | HGVSp Short | SWISSPROT | BIOTYPE | SIFT | PolyPhen | Tumor Sample Barcode | Tissue | Histology | Sex | Age | Stage | Therapy Types | Drugs | Outcome |
| BBOX1 | SNV | Missense_Mutation | novel | c.80N>A | p.Ser27Tyr | p.S27Y | O75936 | protein_coding | deleterious(0) | probably_damaging(0.994) | TCGA-AC-A5EH-01 | Breast | breast invasive carcinoma | Female | >=65 | I/II | Unknown | Unknown | SD |
| BBOX1 | SNV | Missense_Mutation | c.523N>G | p.Thr175Ala | p.T175A | O75936 | protein_coding | deleterious(0) | probably_damaging(0.994) | TCGA-AA-3663-01 | Colorectum | colon adenocarcinoma | Male | <65 | I/II | Unknown | Unknown | SD | |
| BBOX1 | SNV | Missense_Mutation | c.526N>G | p.Phe176Val | p.F176V | O75936 | protein_coding | deleterious(0.02) | benign(0.29) | TCGA-AA-A010-01 | Colorectum | colon adenocarcinoma | Female | <65 | I/II | Chemotherapy | folinic | CR | |
| BBOX1 | SNV | Missense_Mutation | novel | c.811N>T | p.Val271Leu | p.V271L | O75936 | protein_coding | tolerated(0.93) | benign(0) | TCGA-AM-5821-01 | Colorectum | colon adenocarcinoma | Female | >=65 | I/II | Unknown | Unknown | SD |
| BBOX1 | SNV | Missense_Mutation | novel | c.641T>C | p.Val214Ala | p.V214A | O75936 | protein_coding | tolerated(0.07) | probably_damaging(0.977) | TCGA-AZ-4315-01 | Colorectum | colon adenocarcinoma | Male | <65 | I/II | Unknown | Unknown | SD |
| BBOX1 | SNV | Missense_Mutation | novel | c.192N>G | p.Ile64Met | p.I64M | O75936 | protein_coding | tolerated(0.13) | benign(0.019) | TCGA-CA-6717-01 | Colorectum | colon adenocarcinoma | Male | <65 | I/II | Chemotherapy | oxaliplatin | CR |
| BBOX1 | SNV | Missense_Mutation | rs764375198 | c.1030N>T | p.Arg344Cys | p.R344C | O75936 | protein_coding | deleterious(0) | probably_damaging(1) | TCGA-D5-6932-01 | Colorectum | colon adenocarcinoma | Male | >=65 | I/II | Unknown | Unknown | SD |
| BBOX1 | SNV | Missense_Mutation | c.862N>T | p.Arg288Cys | p.R288C | O75936 | protein_coding | deleterious(0) | probably_damaging(0.994) | TCGA-AG-3892-01 | Colorectum | rectum adenocarcinoma | Female | <65 | I/II | Unknown | Unknown | SD | |
| BBOX1 | SNV | Missense_Mutation | c.526N>G | p.Phe176Val | p.F176V | O75936 | protein_coding | deleterious(0.02) | benign(0.29) | TCGA-AG-A002-01 | Colorectum | rectum adenocarcinoma | Male | <65 | I/II | Unknown | Unknown | SD | |
| BBOX1 | insertion | Frame_Shift_Ins | novel | c.813_814insGTTTTTGG | p.Gln272ValfsTer10 | p.Q272Vfs*10 | O75936 | protein_coding | TCGA-AM-5821-01 | Colorectum | colon adenocarcinoma | Female | >=65 | I/II | Unknown | Unknown | SD |
| Page: 1 2 3 4 5 |
Top |
Related drugs of malignant transformation related genes |
| Identification of chemicals and drugs interact with genes involved in malignant transfromation |
| (DGIdb 4.0) |
| Entrez ID | Symbol | Category | Interaction Types | Drug Claim Name | Drug Name | PMIDs |
| 8424 | BBOX1 | DRUGGABLE GENOME | EBSELEN | EBSELEN | 25266780 | |
| 8424 | BBOX1 | DRUGGABLE GENOME | THIRAM | THIRAM | 25266780 | |
| 8424 | BBOX1 | DRUGGABLE GENOME | BENZENE SELENOIC ACID | BENZENE SELENOIC ACID | 25266780 |
| Page: 1 |

Copyright 2023-Present -The University of Texas Health Science Center at Houston |