
|
|||||
|
 | |
| |
| |
| |
| |
| |
|
Gene: BBIP1 |
Gene summary for BBIP1 |
| Gene information | Species | Human | Gene symbol | BBIP1 | Gene ID | 92482 |
| Gene name | BBSome interacting protein 1 | |
| Gene Alias | BBIP10 | |
| Cytomap | 10q25.2 | |
| Gene Type | protein-coding | GO ID | GO:0006810 | UniProtAcc | A8MTZ0 |
Top |
Malignant transformation analysis |
| Identification of the aberrant gene expression in precancerous and cancerous lesions by comparing the gene expression of stem-like cells in diseased tissues with normal stem cells |
| Entrez ID | Symbol | Replicates | Species | Organ | Tissue | Adj P-value | Log2FC | Malignancy |
| 92482 | BBIP1 | LZE4T | Human | Esophagus | ESCC | 2.31e-05 | 1.42e-01 | 0.0811 |
| 92482 | BBIP1 | LZE8T | Human | Esophagus | ESCC | 2.70e-07 | 1.62e-01 | 0.067 |
| 92482 | BBIP1 | LZE24T | Human | Esophagus | ESCC | 2.85e-10 | 3.50e-01 | 0.0596 |
| 92482 | BBIP1 | P1T-E | Human | Esophagus | ESCC | 1.73e-09 | 2.42e-01 | 0.0875 |
| 92482 | BBIP1 | P2T-E | Human | Esophagus | ESCC | 1.04e-23 | 4.69e-01 | 0.1177 |
| 92482 | BBIP1 | P4T-E | Human | Esophagus | ESCC | 5.89e-16 | 3.83e-01 | 0.1323 |
| 92482 | BBIP1 | P5T-E | Human | Esophagus | ESCC | 1.87e-16 | 3.65e-01 | 0.1327 |
| 92482 | BBIP1 | P8T-E | Human | Esophagus | ESCC | 1.17e-24 | 3.63e-01 | 0.0889 |
| 92482 | BBIP1 | P9T-E | Human | Esophagus | ESCC | 2.79e-15 | 3.02e-01 | 0.1131 |
| 92482 | BBIP1 | P10T-E | Human | Esophagus | ESCC | 3.62e-09 | 1.58e-01 | 0.116 |
| 92482 | BBIP1 | P11T-E | Human | Esophagus | ESCC | 6.01e-17 | 5.92e-01 | 0.1426 |
| 92482 | BBIP1 | P12T-E | Human | Esophagus | ESCC | 2.03e-21 | 3.09e-01 | 0.1122 |
| 92482 | BBIP1 | P15T-E | Human | Esophagus | ESCC | 1.06e-12 | 2.19e-01 | 0.1149 |
| 92482 | BBIP1 | P16T-E | Human | Esophagus | ESCC | 2.08e-21 | 3.70e-01 | 0.1153 |
| 92482 | BBIP1 | P17T-E | Human | Esophagus | ESCC | 8.04e-05 | 3.58e-01 | 0.1278 |
| 92482 | BBIP1 | P19T-E | Human | Esophagus | ESCC | 1.76e-04 | 5.01e-01 | 0.1662 |
| 92482 | BBIP1 | P20T-E | Human | Esophagus | ESCC | 1.20e-04 | 2.31e-01 | 0.1124 |
| 92482 | BBIP1 | P21T-E | Human | Esophagus | ESCC | 2.43e-25 | 4.53e-01 | 0.1617 |
| 92482 | BBIP1 | P22T-E | Human | Esophagus | ESCC | 1.34e-13 | 2.09e-01 | 0.1236 |
| 92482 | BBIP1 | P23T-E | Human | Esophagus | ESCC | 3.92e-14 | 3.04e-01 | 0.108 |
| Page: 1 2 3 4 5 |
| Tissue | Expression Dynamics | Abbreviation |
| Esophagus | 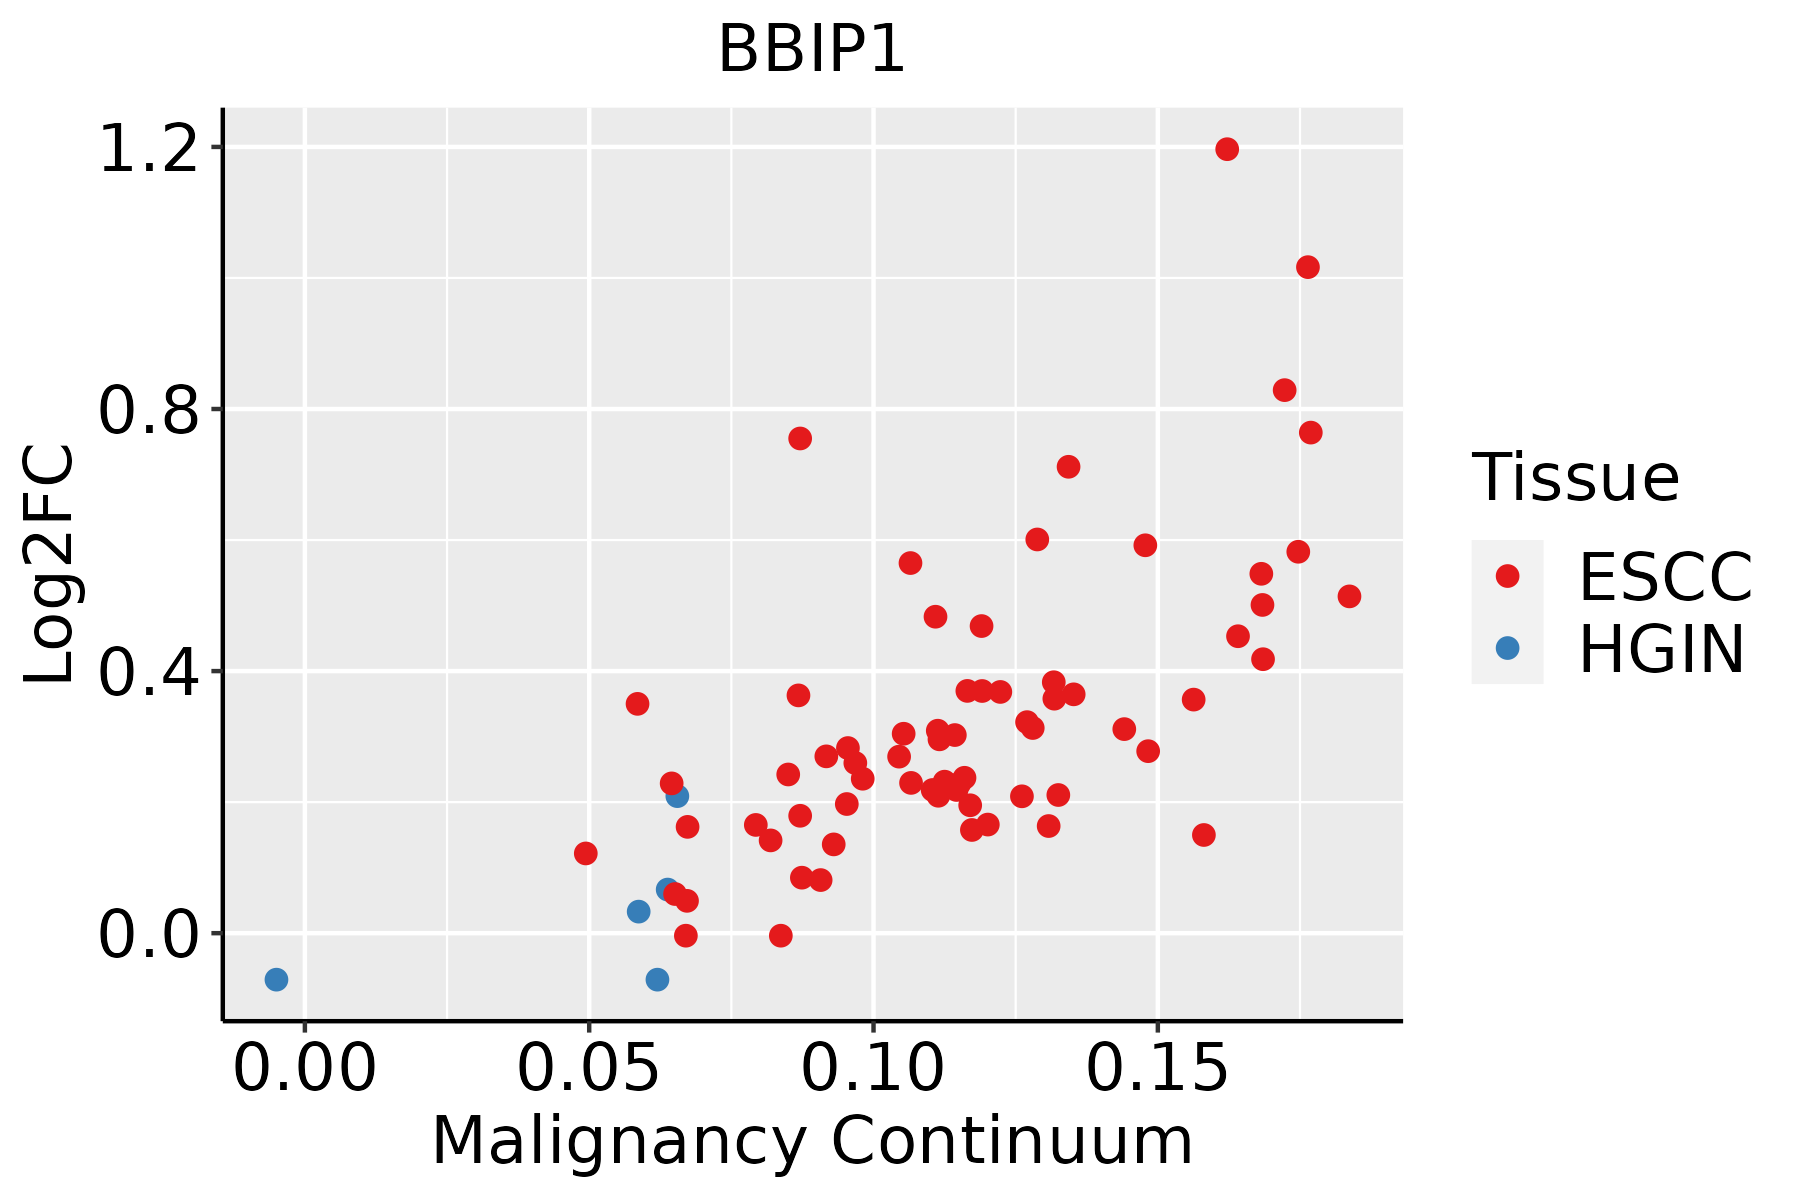 | ESCC: Esophageal squamous cell carcinoma |
| HGIN: High-grade intraepithelial neoplasias | ||
| LGIN: Low-grade intraepithelial neoplasias | ||
| Liver | 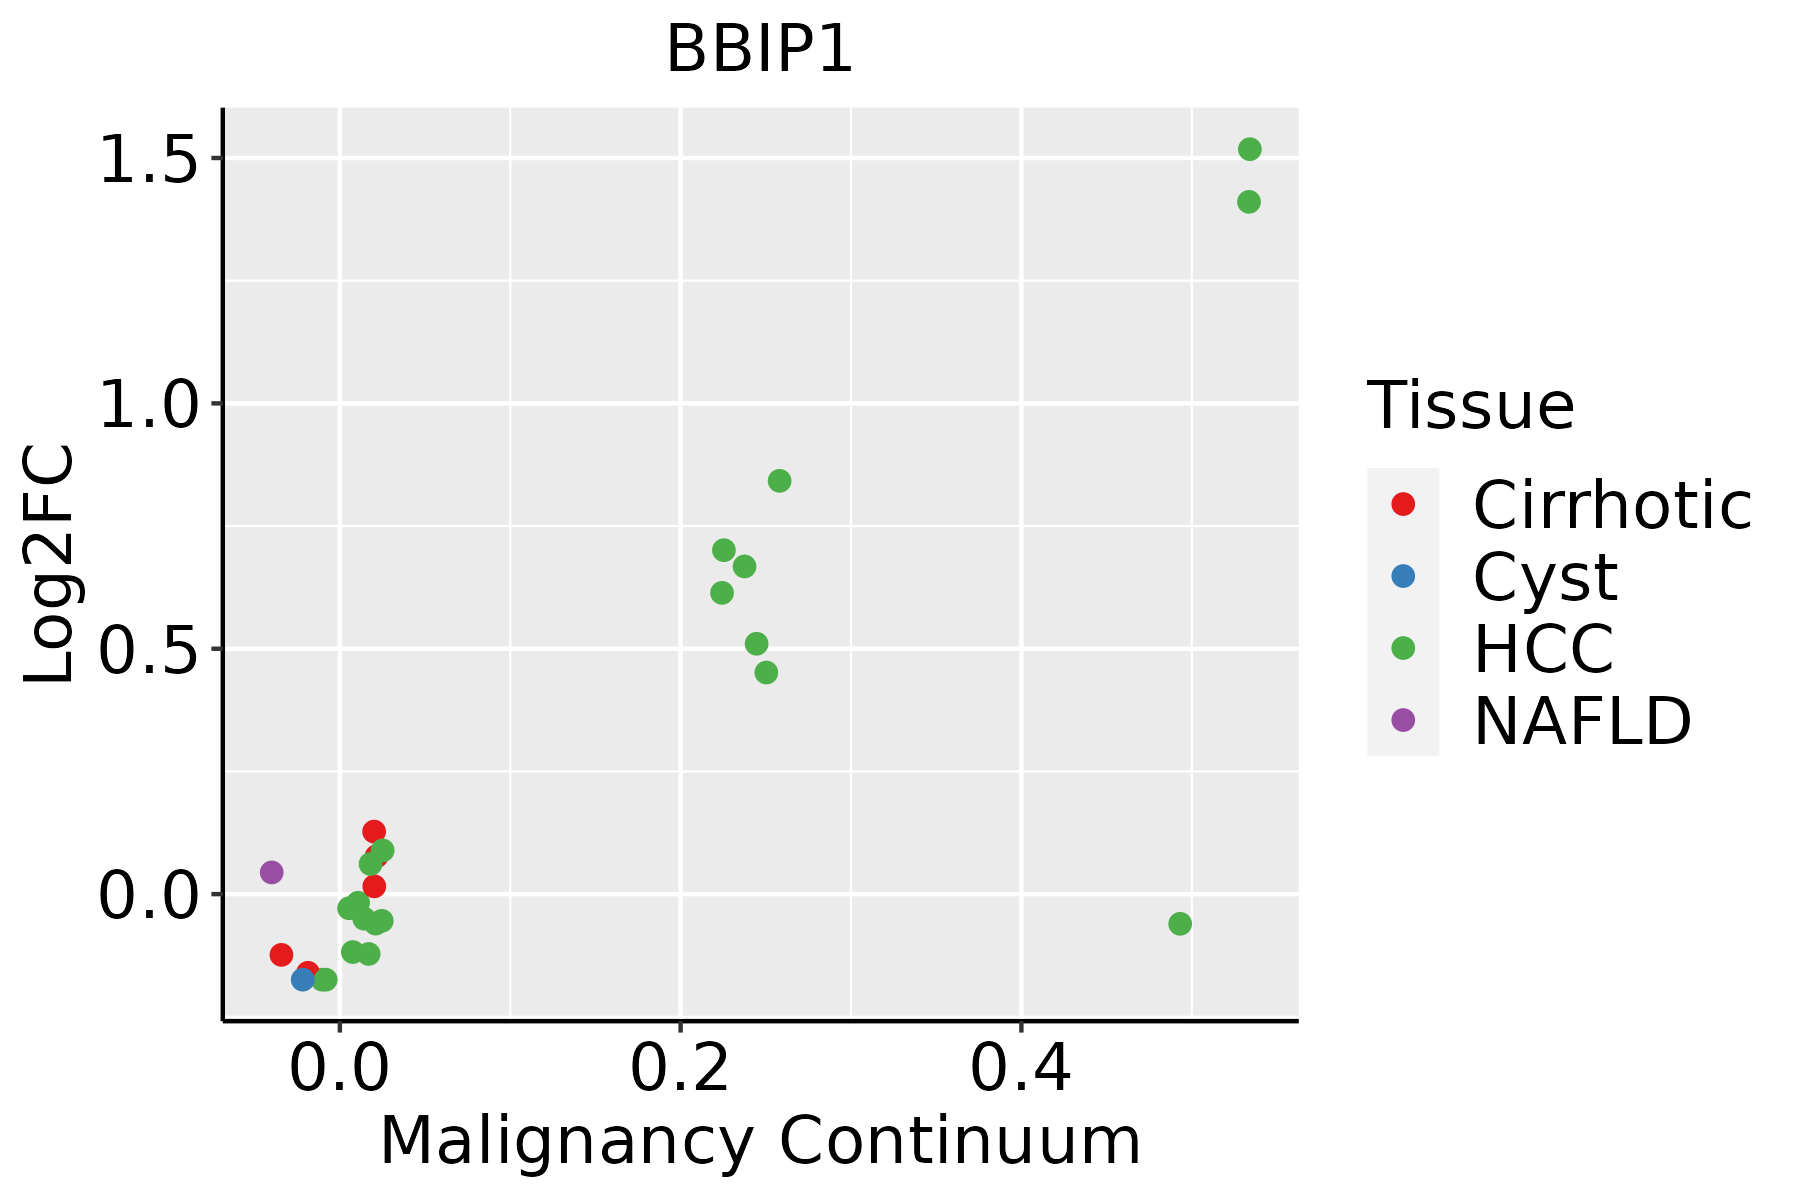 | HCC: Hepatocellular carcinoma |
| NAFLD: Non-alcoholic fatty liver disease | ||
| Oral Cavity | 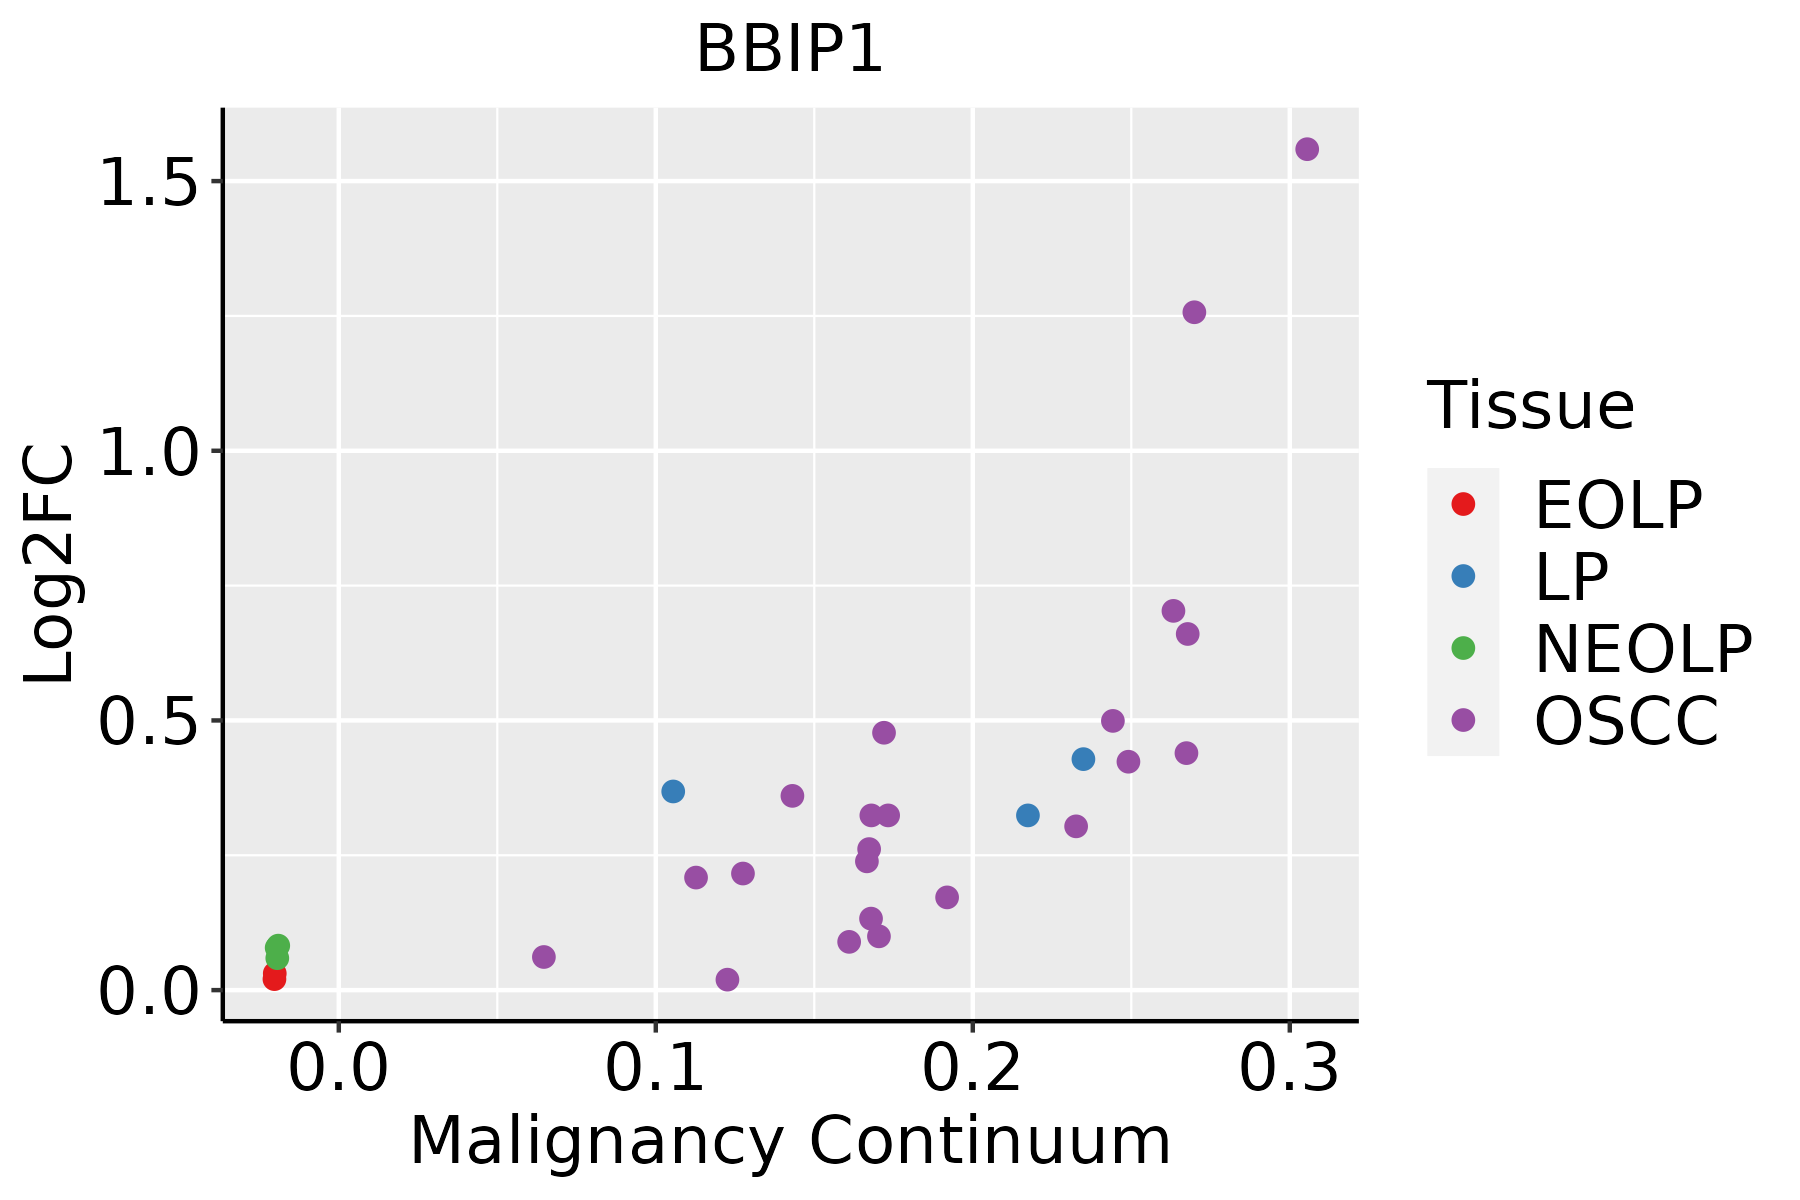 | EOLP: Erosive Oral lichen planus |
| LP: leukoplakia | ||
| NEOLP: Non-erosive oral lichen planus | ||
| OSCC: Oral squamous cell carcinoma |
| ∗log2FC in expression of this searched gene in stem-like cells from each diseased tissue sample relative to stem-like cells in normal samples in each tissue plotted against the malignancy continuum. Samples are colored based on if they are from different disease stage. |
Top |
Malignant transformation related pathway analysis |
| Find out the enriched GO biological processes and KEGG pathways involved in transition from healthy to precancer to cancer |
| Tissue | Disease Stage | Enriched GO biological Processes |
| Colorectum | AD |  |
| Colorectum | SER |  |
| Colorectum | MSS |  |
| Colorectum | MSI-H |  |
| Colorectum | FAP |  |
| ∗Top 15 enriched GO BP terms are showed in the bar plot of each disease state in each tissue. Each row represents a significant GO biological process which is colored according to the -log10(p.adjust). |
| Page: 1 2 3 4 5 6 7 8 9 |
| GO ID | Tissue | Disease Stage | Description | Gene Ratio | Bg Ratio | pvalue | p.adjust | Count |
| GO:199077819 | Esophagus | ESCC | protein localization to cell periphery | 217/8552 | 333/18723 | 4.08e-13 | 1.88e-11 | 217 |
| GO:199077811 | Liver | Cirrhotic | protein localization to cell periphery | 135/4634 | 333/18723 | 1.18e-10 | 6.21e-09 | 135 |
| GO:199077821 | Liver | HCC | protein localization to cell periphery | 200/7958 | 333/18723 | 6.07e-11 | 2.23e-09 | 200 |
| GO:199077816 | Oral cavity | OSCC | protein localization to cell periphery | 190/7305 | 333/18723 | 1.46e-11 | 5.13e-10 | 190 |
| Page: 1 |
| Pathway ID | Tissue | Disease Stage | Description | Gene Ratio | Bg Ratio | pvalue | p.adjust | qvalue | Count |
| Page: 1 |
Top |
Cell-cell communication analysis |
| Identification of potential cell-cell interactions between two cell types and their ligand-receptor pairs for different disease states |
| Ligand | Receptor | LRpair | Pathway | Tissue | Disease Stage |
| Page: 1 |
Top |
Single-cell gene regulatory network inference analysis |
| Find out the significant the regulons (TFs) and the target genes of each regulon across cell types for different disease states |
| TF | Cell Type | Tissue | Disease Stage | Target Gene | RSS | Regulon Activity |
| ∗The dot plots of a searched regulon are shown for all cell subpopulations in each disease state of each tissue based on the regulon specific score inferred using pySCENIC and by calculating the average expression. |
| Page: 1 |
Top |
Somatic mutation of malignant transformation related genes |
| Annotation of somatic variants for genes involved in malignant transformation |
| Hugo Symbol | Variant Class | Variant Classification | dbSNP RS | HGVSc | HGVSp | HGVSp Short | SWISSPROT | BIOTYPE | SIFT | PolyPhen | Tumor Sample Barcode | Tissue | Histology | Sex | Age | Stage | Therapy Types | Drugs | Outcome |
| BBIP1 | SNV | Missense_Mutation | novel | c.70T>G | p.Ser24Ala | p.S24A | A8MTZ0 | protein_coding | benign(0.205) | TCGA-AJ-A5DW-01 | Endometrium | uterine corpus endometrioid carcinoma | Female | <65 | I/II | Unknown | Unknown | SD | |
| BBIP1 | SNV | Missense_Mutation | novel | c.89C>A | p.Ser30Tyr | p.S30Y | A8MTZ0 | protein_coding | possibly_damaging(0.788) | TCGA-AP-A1E0-01 | Endometrium | uterine corpus endometrioid carcinoma | Female | <65 | III/IV | Chemotherapy | paclitaxel | SD | |
| BBIP1 | SNV | Missense_Mutation | novel | c.79N>A | p.Pro27Thr | p.P27T | A8MTZ0 | protein_coding | possibly_damaging(0.81) | TCGA-AX-A1CE-01 | Endometrium | uterine corpus endometrioid carcinoma | Female | <65 | I/II | Unspecific | Paclitaxel | SD |
| Page: 1 |
Top |
Related drugs of malignant transformation related genes |
| Identification of chemicals and drugs interact with genes involved in malignant transfromation |
| (DGIdb 4.0) |
| Entrez ID | Symbol | Category | Interaction Types | Drug Claim Name | Drug Name | PMIDs |
| Page: 1 |

Copyright 2023-Present -The University of Texas Health Science Center at Houston |