
|
|||||
|
 | |
| |
| |
| |
| |
| |
|
Gene: BAZ2B |
Gene summary for BAZ2B |
| Gene information | Species | Human | Gene symbol | BAZ2B | Gene ID | 29994 |
| Gene name | bromodomain adjacent to zinc finger domain 2B | |
| Gene Alias | WALp4 | |
| Cytomap | 2q24.2 | |
| Gene Type | protein-coding | GO ID | GO:0006139 | UniProtAcc | Q9UIF8 |
Top |
Malignant transformation analysis |
| Identification of the aberrant gene expression in precancerous and cancerous lesions by comparing the gene expression of stem-like cells in diseased tissues with normal stem cells |
| Entrez ID | Symbol | Replicates | Species | Organ | Tissue | Adj P-value | Log2FC | Malignancy |
| 29994 | BAZ2B | CA_HPV_1 | Human | Cervix | CC | 1.99e-04 | -8.92e-02 | 0.0264 |
| 29994 | BAZ2B | CCI_1 | Human | Cervix | CC | 3.22e-05 | 8.90e-01 | 0.528 |
| 29994 | BAZ2B | CCI_3 | Human | Cervix | CC | 1.07e-10 | 9.55e-01 | 0.516 |
| 29994 | BAZ2B | Tumor | Human | Cervix | CC | 6.80e-07 | -3.36e-01 | 0.1241 |
| 29994 | BAZ2B | sample3 | Human | Cervix | CC | 2.51e-03 | -2.52e-01 | 0.1387 |
| 29994 | BAZ2B | L1 | Human | Cervix | CC | 1.41e-02 | -2.92e-01 | 0.0802 |
| 29994 | BAZ2B | T3 | Human | Cervix | CC | 8.82e-05 | -2.48e-01 | 0.1389 |
| 29994 | BAZ2B | HTA11_3410_2000001011 | Human | Colorectum | AD | 2.27e-14 | -4.75e-01 | 0.0155 |
| 29994 | BAZ2B | HTA11_2487_2000001011 | Human | Colorectum | SER | 2.68e-02 | -3.82e-01 | -0.1808 |
| 29994 | BAZ2B | HTA11_347_2000001011 | Human | Colorectum | AD | 8.39e-04 | 4.53e-01 | -0.1954 |
| 29994 | BAZ2B | HTA11_3361_2000001011 | Human | Colorectum | AD | 3.18e-09 | -5.83e-01 | -0.1207 |
| 29994 | BAZ2B | HTA11_866_3004761011 | Human | Colorectum | AD | 1.12e-02 | -3.93e-01 | 0.096 |
| 29994 | BAZ2B | HTA11_6801_2000001011 | Human | Colorectum | SER | 2.55e-05 | -6.58e-01 | 0.0171 |
| 29994 | BAZ2B | HTA11_7696_3000711011 | Human | Colorectum | AD | 8.71e-04 | -2.96e-01 | 0.0674 |
| 29994 | BAZ2B | HTA11_99999970781_79442 | Human | Colorectum | MSS | 6.45e-06 | -3.69e-01 | 0.294 |
| 29994 | BAZ2B | HTA11_99999971662_82457 | Human | Colorectum | MSS | 9.19e-10 | -4.16e-01 | 0.3859 |
| 29994 | BAZ2B | HTA11_99999973899_84307 | Human | Colorectum | MSS | 1.72e-05 | -5.56e-01 | 0.2585 |
| 29994 | BAZ2B | HTA11_99999974143_84620 | Human | Colorectum | MSS | 3.92e-16 | -4.78e-01 | 0.3005 |
| 29994 | BAZ2B | F007 | Human | Colorectum | FAP | 2.84e-08 | 3.37e-01 | 0.1176 |
| 29994 | BAZ2B | A001-C-207 | Human | Colorectum | FAP | 7.65e-04 | 1.65e-01 | 0.1278 |
| Page: 1 2 3 4 5 6 7 8 9 10 11 12 13 |
| Tissue | Expression Dynamics | Abbreviation |
| Cervix |  | CC: Cervix cancer |
| HSIL_HPV: HPV-infected high-grade squamous intraepithelial lesions | ||
| N_HPV: HPV-infected normal cervix | ||
| Colorectum (GSE201348) |  | FAP: Familial adenomatous polyposis |
| CRC: Colorectal cancer | ||
| Colorectum (HTA11) |  | AD: Adenomas |
| SER: Sessile serrated lesions | ||
| MSI-H: Microsatellite-high colorectal cancer | ||
| MSS: Microsatellite stable colorectal cancer | ||
| Endometrium | 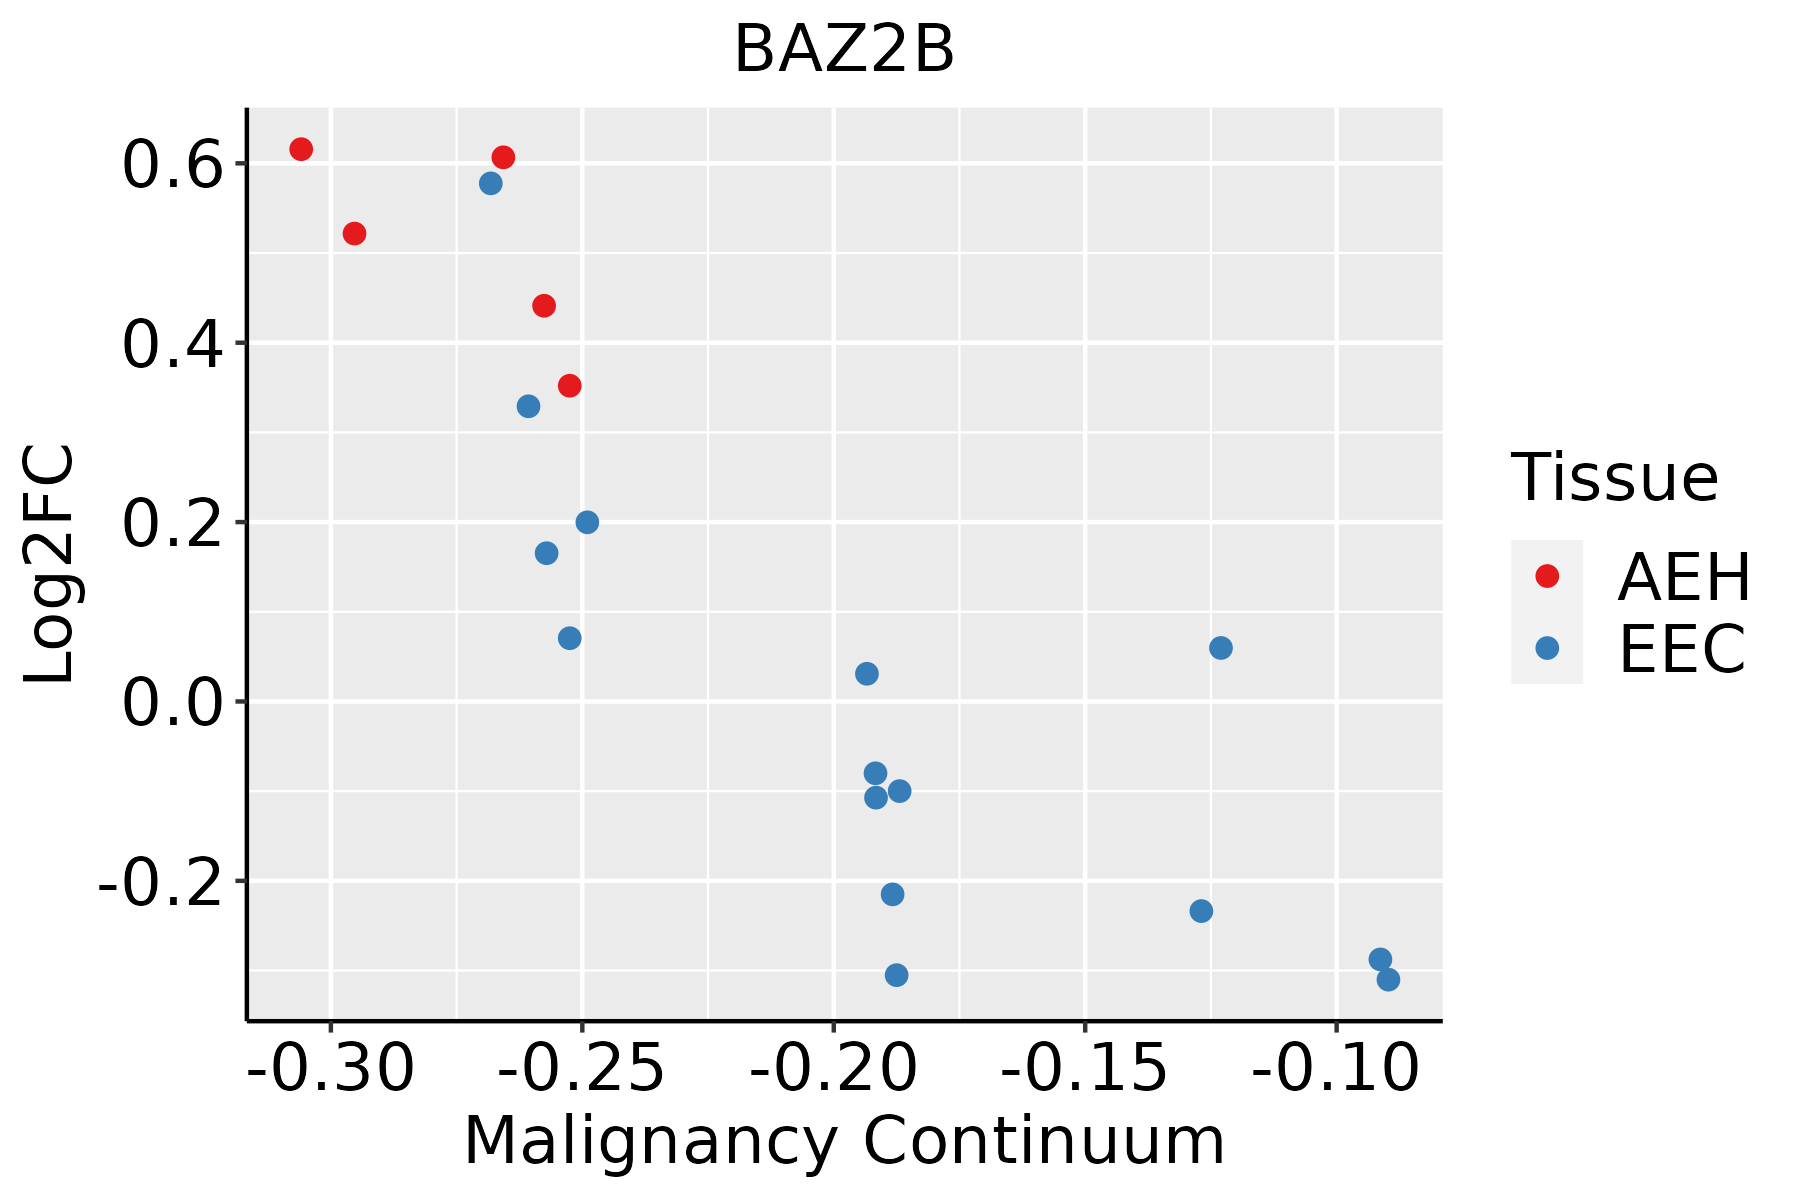 | AEH: Atypical endometrial hyperplasia |
| EEC: Endometrioid Cancer | ||
| Esophagus | 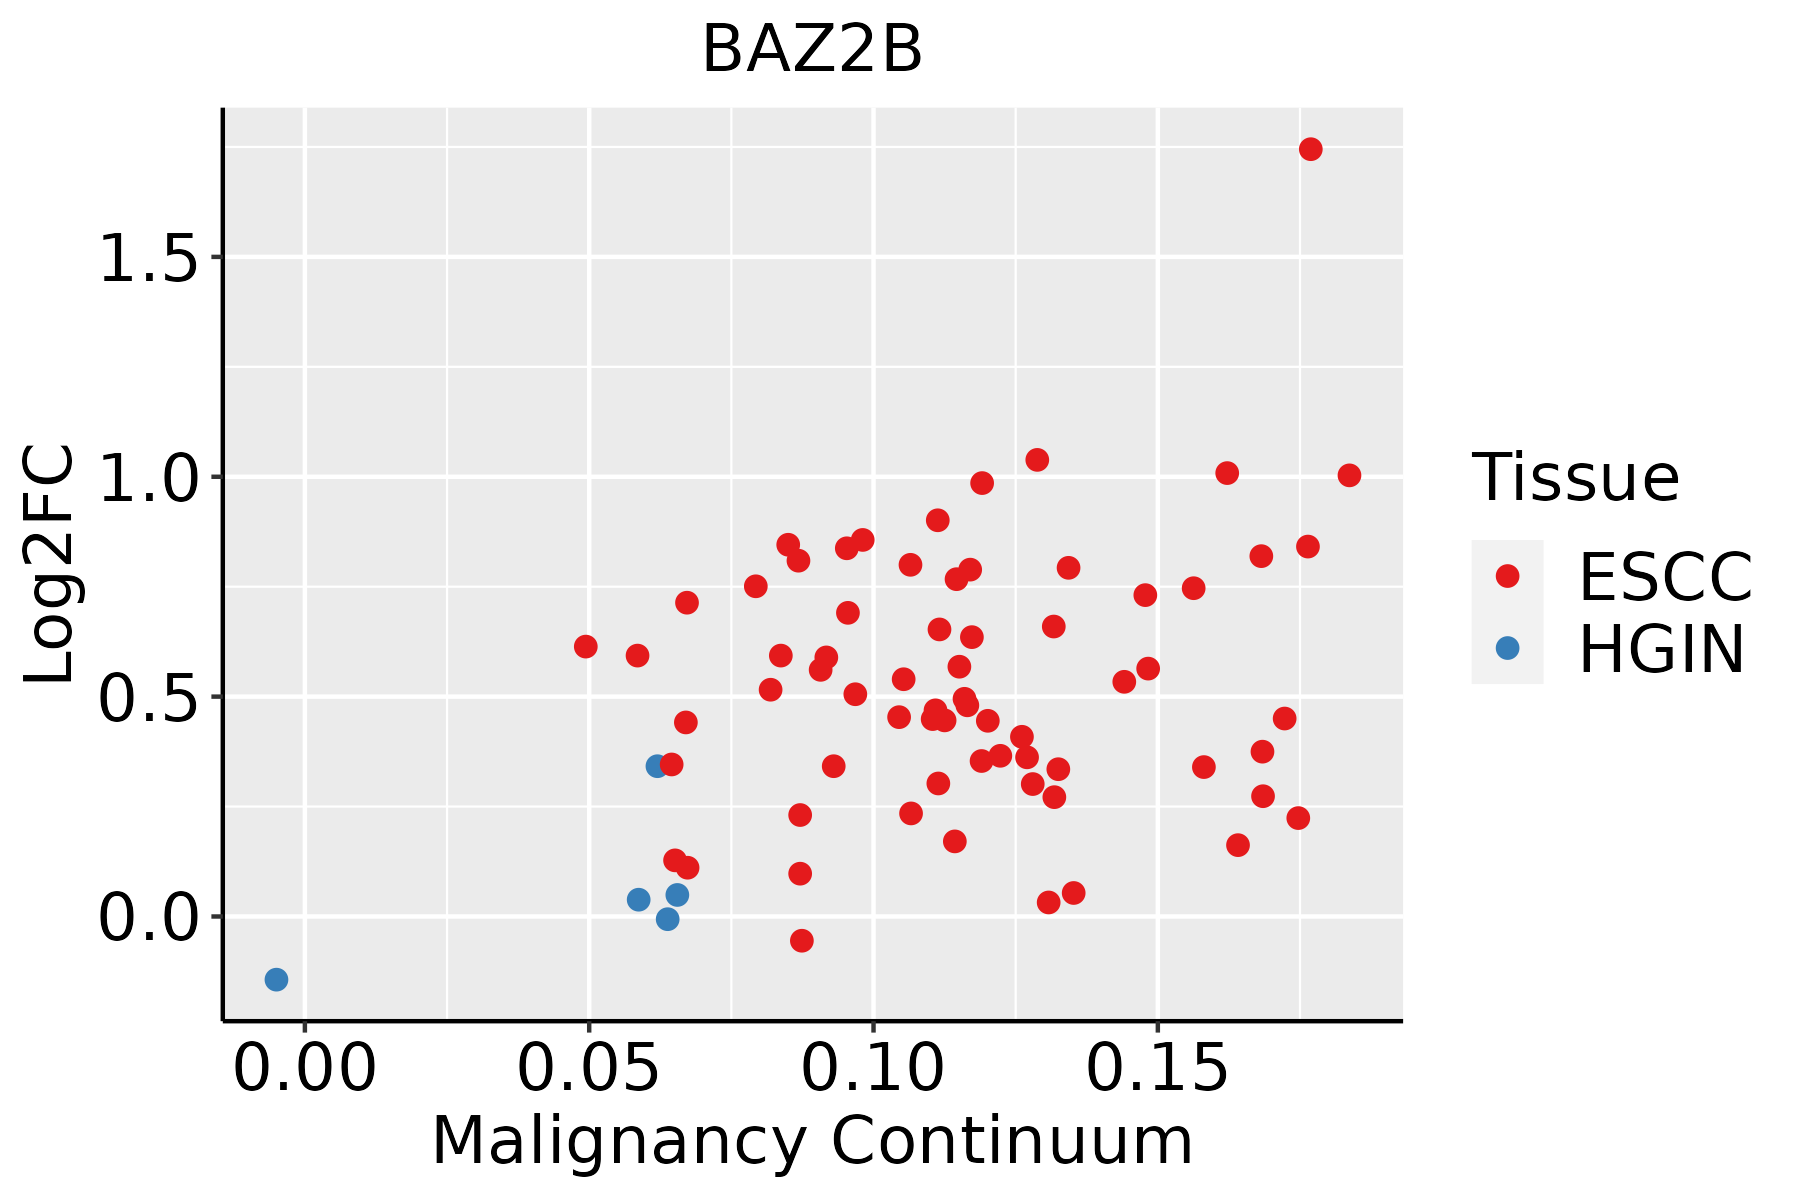 | ESCC: Esophageal squamous cell carcinoma |
| HGIN: High-grade intraepithelial neoplasias | ||
| LGIN: Low-grade intraepithelial neoplasias | ||
| Liver | 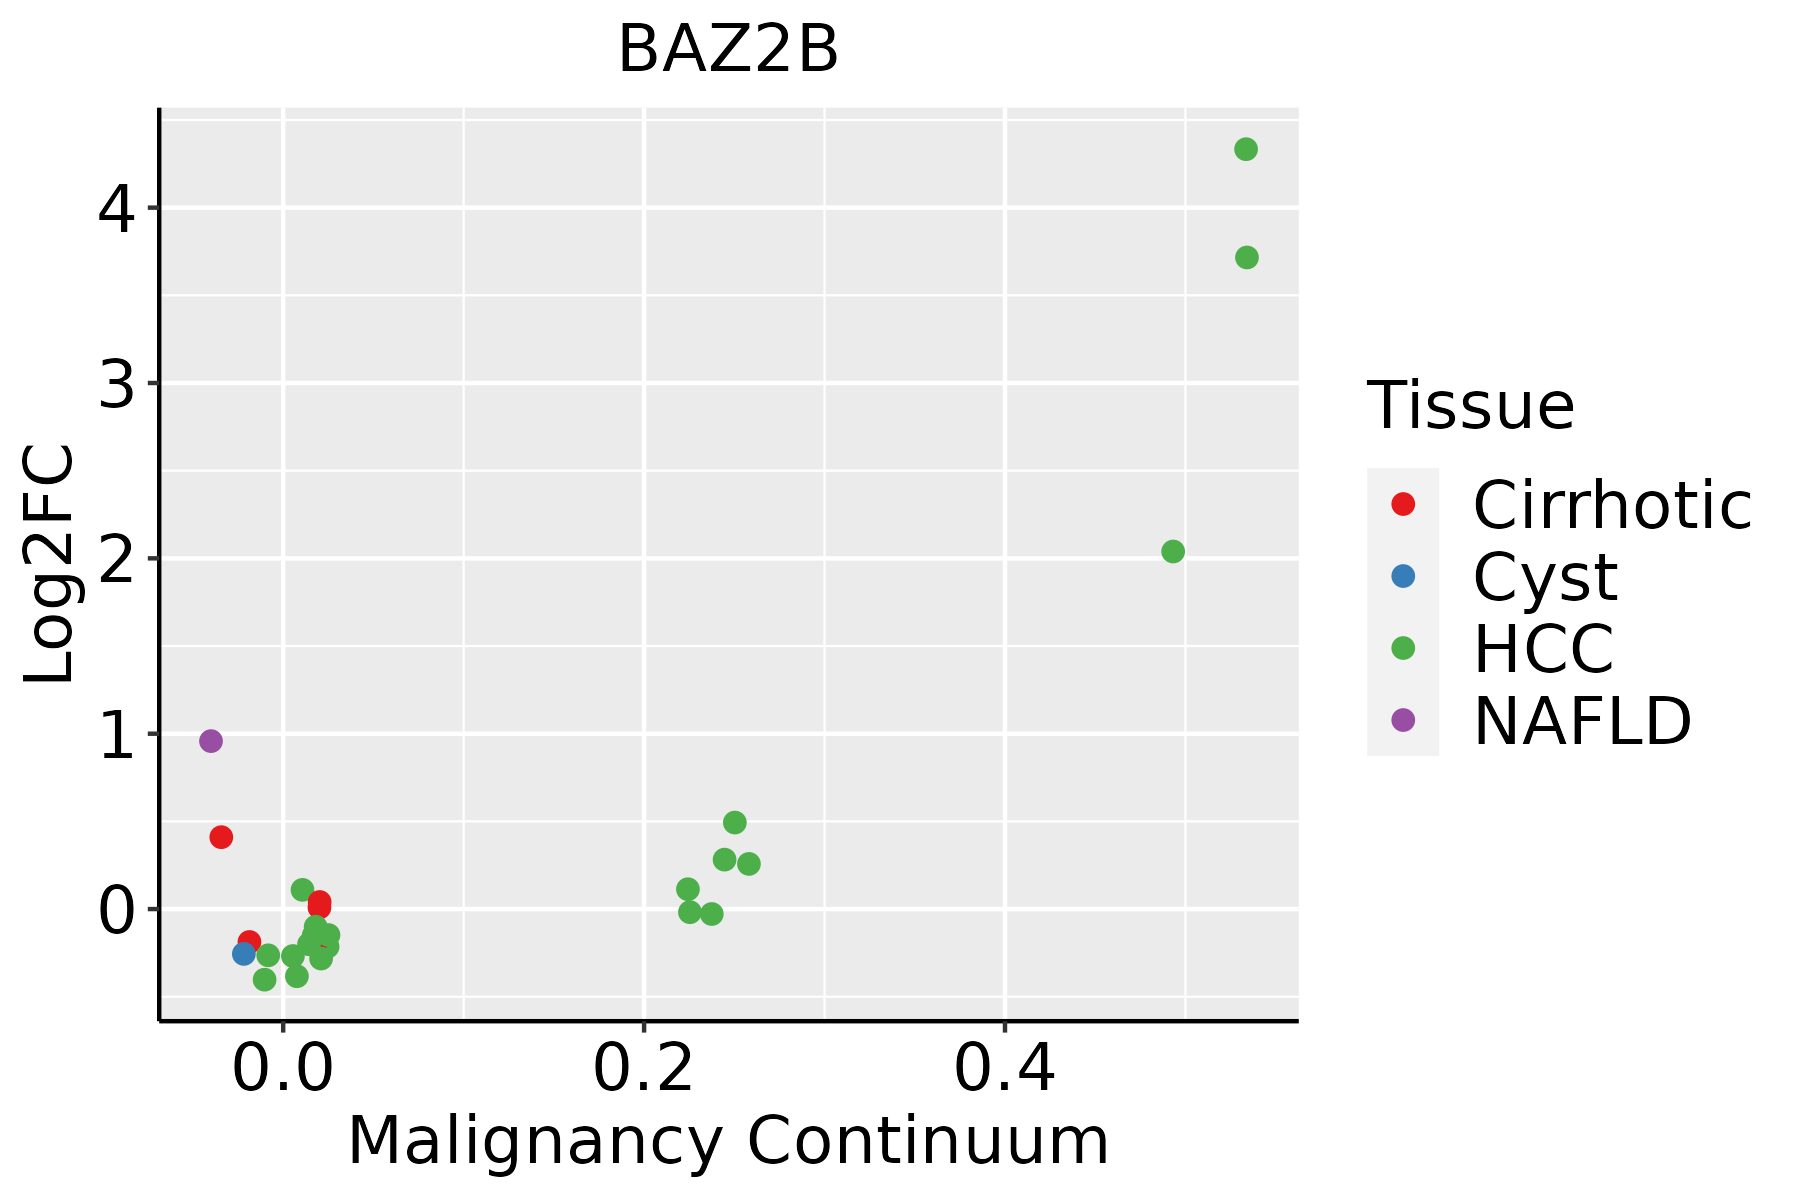 | HCC: Hepatocellular carcinoma |
| NAFLD: Non-alcoholic fatty liver disease | ||
| Lung | 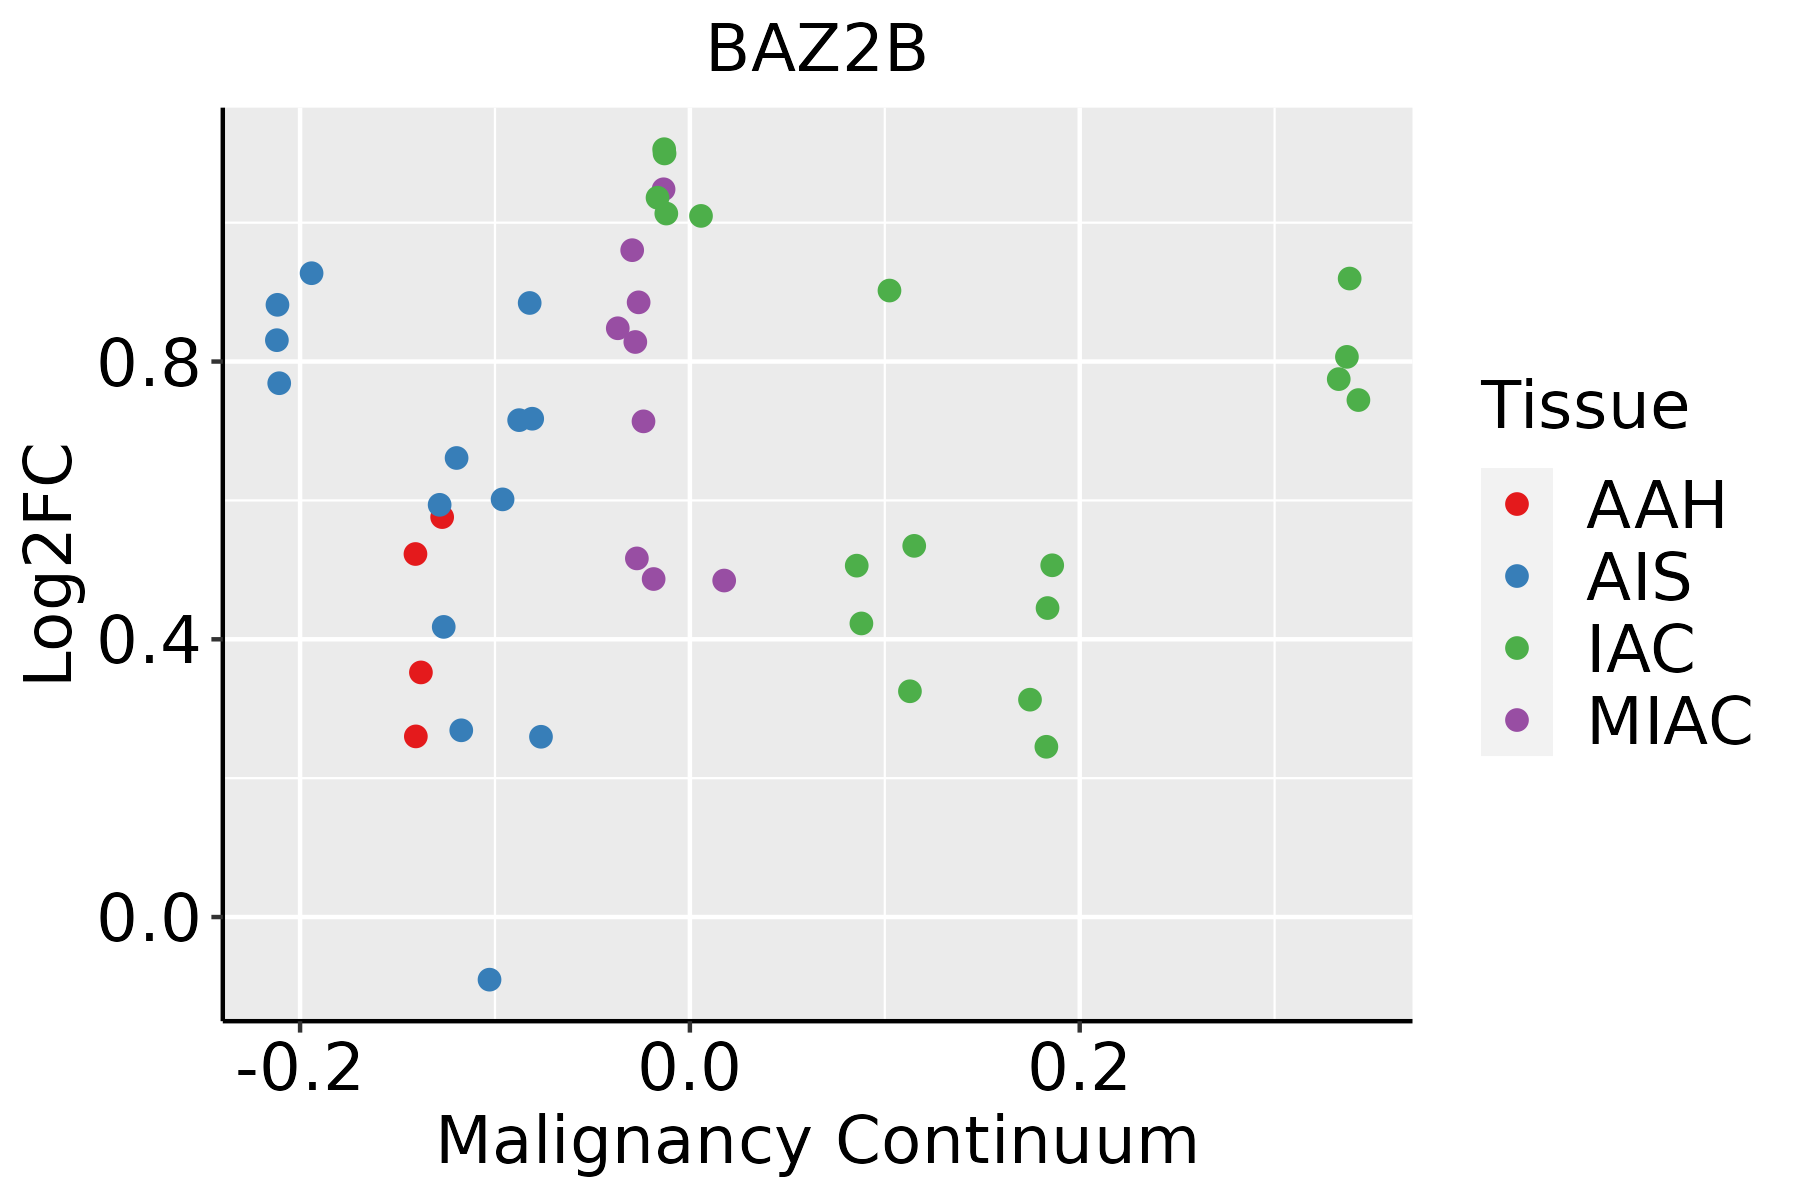 | AAH: Atypical adenomatous hyperplasia |
| AIS: Adenocarcinoma in situ | ||
| IAC: Invasive lung adenocarcinoma | ||
| MIA: Minimally invasive adenocarcinoma | ||
| Oral Cavity | 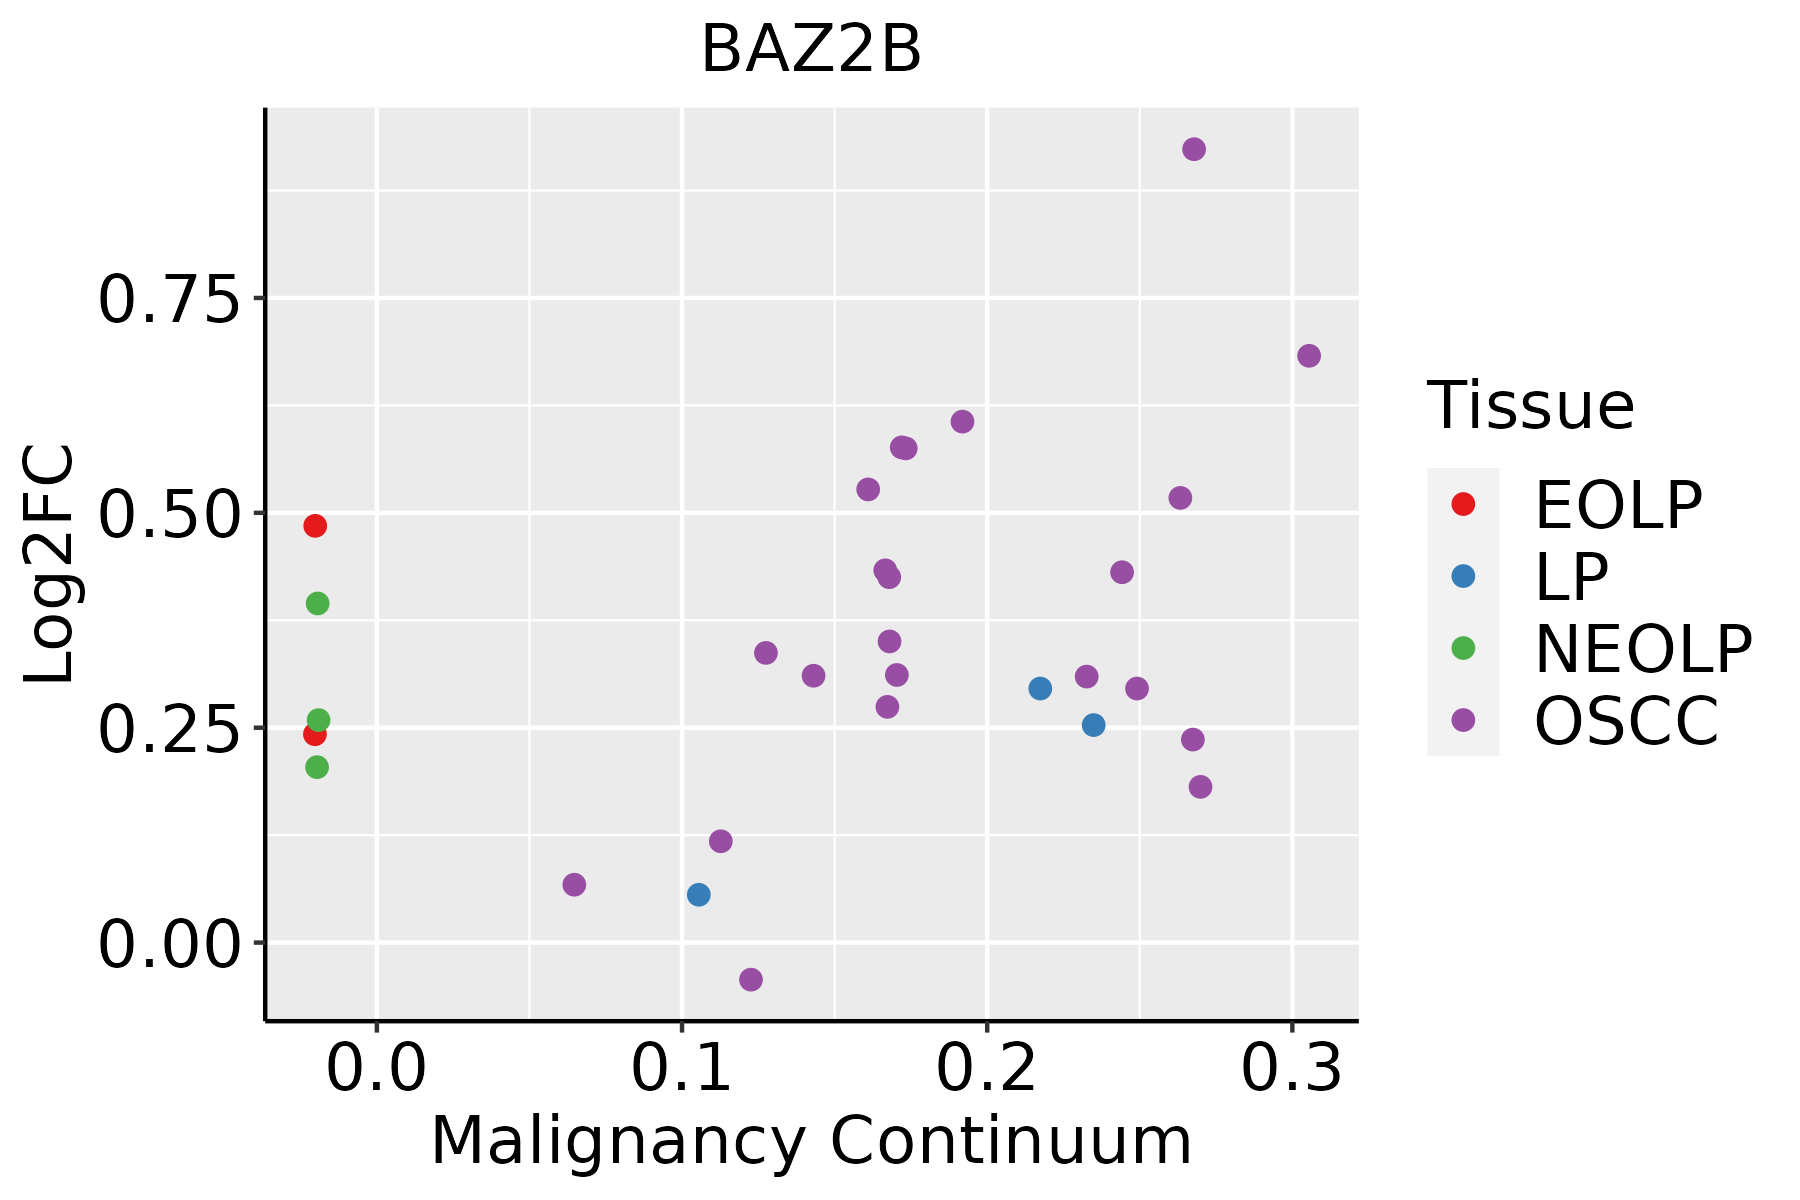 | EOLP: Erosive Oral lichen planus |
| LP: leukoplakia | ||
| NEOLP: Non-erosive oral lichen planus | ||
| OSCC: Oral squamous cell carcinoma | ||
| Prostate | 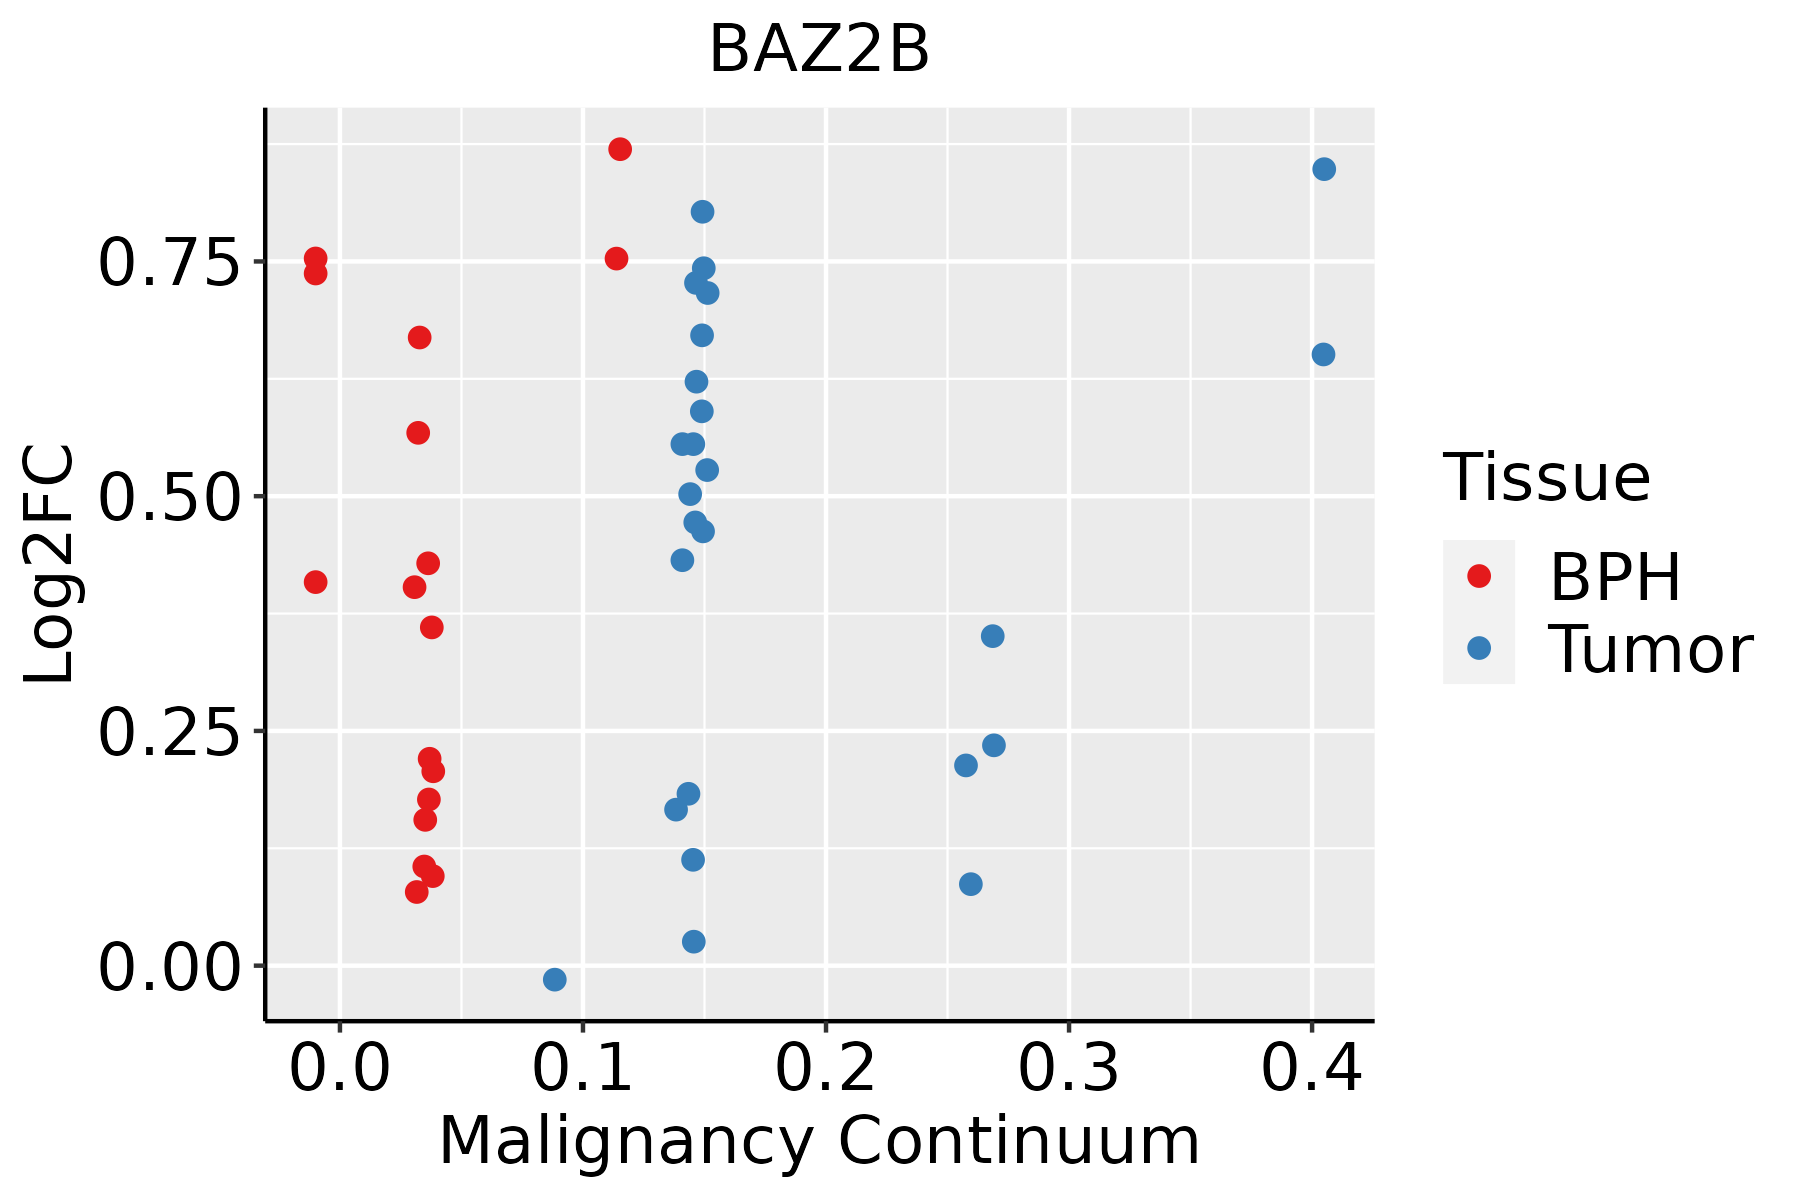 | BPH: Benign Prostatic Hyperplasia |
| Skin |  | AK: Actinic keratosis |
| cSCC: Cutaneous squamous cell carcinoma | ||
| SCCIS:squamous cell carcinoma in situ | ||
| Thyroid |  | ATC: Anaplastic thyroid cancer |
| HT: Hashimoto's thyroiditis | ||
| PTC: Papillary thyroid cancer |
| ∗log2FC in expression of this searched gene in stem-like cells from each diseased tissue sample relative to stem-like cells in normal samples in each tissue plotted against the malignancy continuum. Samples are colored based on if they are from different disease stage. |
Top |
Malignant transformation related pathway analysis |
| Find out the enriched GO biological processes and KEGG pathways involved in transition from healthy to precancer to cancer |
| Tissue | Disease Stage | Enriched GO biological Processes |
| Colorectum | AD |  |
| Colorectum | SER |  |
| Colorectum | MSS |  |
| Colorectum | MSI-H |  |
| Colorectum | FAP |  |
| ∗Top 15 enriched GO BP terms are showed in the bar plot of each disease state in each tissue. Each row represents a significant GO biological process which is colored according to the -log10(p.adjust). |
| Page: 1 2 3 4 5 6 7 8 9 |
| GO ID | Tissue | Disease Stage | Description | Gene Ratio | Bg Ratio | pvalue | p.adjust | Count |
| GO:00075689 | Cervix | CC | aging | 75/2311 | 339/18723 | 2.75e-07 | 1.13e-05 | 75 |
| GO:00063257 | Cervix | CC | chromatin organization | 78/2311 | 409/18723 | 5.40e-05 | 8.02e-04 | 78 |
| GO:00906473 | Cervix | CC | modulation of age-related behavioral decline | 5/2311 | 10/18723 | 4.20e-03 | 2.58e-02 | 5 |
| GO:00063381 | Cervix | CC | chromatin remodeling | 45/2311 | 255/18723 | 8.33e-03 | 4.30e-02 | 45 |
| GO:0006325 | Colorectum | AD | chromatin organization | 119/3918 | 409/18723 | 4.85e-05 | 8.33e-04 | 119 |
| GO:0007568 | Colorectum | AD | aging | 98/3918 | 339/18723 | 2.77e-04 | 3.39e-03 | 98 |
| GO:0006338 | Colorectum | AD | chromatin remodeling | 70/3918 | 255/18723 | 7.44e-03 | 4.53e-02 | 70 |
| GO:00063251 | Colorectum | SER | chromatin organization | 89/2897 | 409/18723 | 4.15e-04 | 6.17e-03 | 89 |
| GO:00063252 | Colorectum | MSS | chromatin organization | 107/3467 | 409/18723 | 7.22e-05 | 1.21e-03 | 107 |
| GO:00075681 | Colorectum | MSS | aging | 90/3467 | 339/18723 | 1.51e-04 | 2.19e-03 | 90 |
| GO:00063253 | Colorectum | FAP | chromatin organization | 84/2622 | 409/18723 | 1.62e-04 | 2.47e-03 | 84 |
| GO:00075682 | Colorectum | FAP | aging | 69/2622 | 339/18723 | 7.66e-04 | 8.12e-03 | 69 |
| GO:0090647 | Colorectum | FAP | modulation of age-related behavioral decline | 5/2622 | 10/18723 | 7.32e-03 | 4.38e-02 | 5 |
| GO:00063254 | Colorectum | CRC | chromatin organization | 74/2078 | 409/18723 | 1.48e-05 | 4.61e-04 | 74 |
| GO:00906471 | Colorectum | CRC | modulation of age-related behavioral decline | 5/2078 | 10/18723 | 2.61e-03 | 2.40e-02 | 5 |
| GO:000756810 | Endometrium | AEH | aging | 59/2100 | 339/18723 | 4.00e-04 | 4.28e-03 | 59 |
| GO:00063258 | Endometrium | AEH | chromatin organization | 64/2100 | 409/18723 | 3.69e-03 | 2.52e-02 | 64 |
| GO:000756815 | Endometrium | EEC | aging | 66/2168 | 339/18723 | 1.46e-05 | 2.87e-04 | 66 |
| GO:000632513 | Endometrium | EEC | chromatin organization | 65/2168 | 409/18723 | 4.98e-03 | 3.14e-02 | 65 |
| GO:000632516 | Esophagus | HGIN | chromatin organization | 92/2587 | 409/18723 | 1.05e-06 | 4.16e-05 | 92 |
| Page: 1 2 3 |
| Pathway ID | Tissue | Disease Stage | Description | Gene Ratio | Bg Ratio | pvalue | p.adjust | qvalue | Count |
| Page: 1 |
Top |
Cell-cell communication analysis |
| Identification of potential cell-cell interactions between two cell types and their ligand-receptor pairs for different disease states |
| Ligand | Receptor | LRpair | Pathway | Tissue | Disease Stage |
| Page: 1 |
Top |
Single-cell gene regulatory network inference analysis |
| Find out the significant the regulons (TFs) and the target genes of each regulon across cell types for different disease states |
| TF | Cell Type | Tissue | Disease Stage | Target Gene | RSS | Regulon Activity |
| ∗The dot plots of a searched regulon are shown for all cell subpopulations in each disease state of each tissue based on the regulon specific score inferred using pySCENIC and by calculating the average expression. |
| Page: 1 |
Top |
Somatic mutation of malignant transformation related genes |
| Annotation of somatic variants for genes involved in malignant transformation |
| Hugo Symbol | Variant Class | Variant Classification | dbSNP RS | HGVSc | HGVSp | HGVSp Short | SWISSPROT | BIOTYPE | SIFT | PolyPhen | Tumor Sample Barcode | Tissue | Histology | Sex | Age | Stage | Therapy Types | Drugs | Outcome |
| BAZ2B | SNV | Missense_Mutation | c.6056N>G | p.Ser2019Cys | p.S2019C | Q9UIF8 | protein_coding | tolerated(0.06) | possibly_damaging(0.894) | TCGA-A8-A07F-01 | Breast | breast invasive carcinoma | Female | >=65 | I/II | Hormone Therapy | tamoxiphen | SD | |
| BAZ2B | SNV | Missense_Mutation | rs756567864 | c.2411G>C | p.Ser804Thr | p.S804T | Q9UIF8 | protein_coding | deleterious(0) | benign(0.308) | TCGA-A8-A08X-01 | Breast | breast invasive carcinoma | Female | <65 | III/IV | Chemotherapy | doxorubicin | PD |
| BAZ2B | SNV | Missense_Mutation | c.6001N>A | p.Glu2001Lys | p.E2001K | Q9UIF8 | protein_coding | tolerated(0.12) | possibly_damaging(0.63) | TCGA-AC-A23H-01 | Breast | breast invasive carcinoma | Female | >=65 | I/II | Unknown | Unknown | PD | |
| BAZ2B | SNV | Missense_Mutation | c.5827N>A | p.Glu1943Lys | p.E1943K | Q9UIF8 | protein_coding | deleterious(0.04) | probably_damaging(0.998) | TCGA-AC-A23H-01 | Breast | breast invasive carcinoma | Female | >=65 | I/II | Unknown | Unknown | PD | |
| BAZ2B | SNV | Missense_Mutation | rs771370768 | c.2192N>G | p.Ser731Cys | p.S731C | Q9UIF8 | protein_coding | tolerated(0.3) | benign(0.001) | TCGA-AC-A23H-01 | Breast | breast invasive carcinoma | Female | >=65 | I/II | Unknown | Unknown | PD |
| BAZ2B | SNV | Missense_Mutation | c.1661N>G | p.Ser554Cys | p.S554C | Q9UIF8 | protein_coding | deleterious(0) | benign(0.299) | TCGA-AC-A23H-01 | Breast | breast invasive carcinoma | Female | >=65 | I/II | Unknown | Unknown | PD | |
| BAZ2B | SNV | Missense_Mutation | novel | c.4003N>A | p.Glu1335Lys | p.E1335K | Q9UIF8 | protein_coding | deleterious(0.01) | possibly_damaging(0.76) | TCGA-AC-A5XS-01 | Breast | breast invasive carcinoma | Female | >=65 | I/II | Hormone Therapy | femara | SD |
| BAZ2B | SNV | Missense_Mutation | rs755763510 | c.2740N>T | p.Arg914Trp | p.R914W | Q9UIF8 | protein_coding | deleterious(0) | probably_damaging(0.983) | TCGA-AN-A046-01 | Breast | breast invasive carcinoma | Female | >=65 | I/II | Unknown | Unknown | SD |
| BAZ2B | SNV | Missense_Mutation | novel | c.409N>T | p.Pro137Ser | p.P137S | Q9UIF8 | protein_coding | tolerated(0.12) | benign(0.014) | TCGA-AN-A046-01 | Breast | breast invasive carcinoma | Female | >=65 | I/II | Unknown | Unknown | SD |
| BAZ2B | SNV | Missense_Mutation | novel | c.1859N>G | p.Glu620Gly | p.E620G | Q9UIF8 | protein_coding | deleterious(0.03) | benign(0.356) | TCGA-AN-A0AK-01 | Breast | breast invasive carcinoma | Female | >=65 | I/II | Unknown | Unknown | SD |
| Page: 1 2 3 4 5 6 7 8 9 10 11 12 13 14 15 16 17 18 19 20 21 22 23 24 25 26 |
Top |
Related drugs of malignant transformation related genes |
| Identification of chemicals and drugs interact with genes involved in malignant transfromation |
| (DGIdb 4.0) |
| Entrez ID | Symbol | Category | Interaction Types | Drug Claim Name | Drug Name | PMIDs |
| 29994 | BAZ2B | NA | ELLIPTECINE | ELLIPTECINE | ||
| 29994 | BAZ2B | NA | 4-HYDROXYESTRADIOL | CHEMBL1412489 | ||
| 29994 | BAZ2B | NA | SJ000018300 | CHEMBL590927 | ||
| 29994 | BAZ2B | NA | METHYLTHIONINIUM CHLORIDE | METHYLTHIONINIUM CHLORIDE | ||
| 29994 | BAZ2B | NA | GNF-PF-5381 | CHEMBL578109 | ||
| 29994 | BAZ2B | NA | BAS 01152706 | CHEMBL2002487 | ||
| 29994 | BAZ2B | NA | GNF-PF-4967 | CHEMBL585827 | ||
| 29994 | BAZ2B | NA | CEFACLOR | CEFACLOR | ||
| 29994 | BAZ2B | NA | LIPOIC ACID, ALPHA | LIPOIC ACID, ALPHA | ||
| 29994 | BAZ2B | NA | DNDI1417165 | CHEMBL1406948 |
| Page: 1 2 3 4 5 6 7 8 9 10 11 12 13 14 15 16 17 18 19 20 21 22 23 24 25 26 27 28 29 30 31 32 33 34 35 |

Copyright 2023-Present -The University of Texas Health Science Center at Houston |