
|
|||||
|
 | |
| |
| |
| |
| |
| |
|
Gene: BAZ2A |
Gene summary for BAZ2A |
| Gene information | Species | Human | Gene symbol | BAZ2A | Gene ID | 11176 |
| Gene name | bromodomain adjacent to zinc finger domain 2A | |
| Gene Alias | TIP5 | |
| Cytomap | 12q13.3 | |
| Gene Type | protein-coding | GO ID | GO:0000183 | UniProtAcc | F8VU39 |
Top |
Malignant transformation analysis |
| Identification of the aberrant gene expression in precancerous and cancerous lesions by comparing the gene expression of stem-like cells in diseased tissues with normal stem cells |
| Entrez ID | Symbol | Replicates | Species | Organ | Tissue | Adj P-value | Log2FC | Malignancy |
| 11176 | BAZ2A | LZE4T | Human | Esophagus | ESCC | 3.25e-07 | 3.07e-01 | 0.0811 |
| 11176 | BAZ2A | LZE7T | Human | Esophagus | ESCC | 1.63e-06 | 5.95e-01 | 0.0667 |
| 11176 | BAZ2A | LZE8T | Human | Esophagus | ESCC | 6.72e-09 | 1.85e-01 | 0.067 |
| 11176 | BAZ2A | LZE22T | Human | Esophagus | ESCC | 9.28e-03 | 1.98e-01 | 0.068 |
| 11176 | BAZ2A | LZE24T | Human | Esophagus | ESCC | 1.87e-20 | 5.41e-01 | 0.0596 |
| 11176 | BAZ2A | LZE21T | Human | Esophagus | ESCC | 2.03e-05 | 3.75e-01 | 0.0655 |
| 11176 | BAZ2A | LZE6T | Human | Esophagus | ESCC | 3.52e-02 | 1.20e-01 | 0.0845 |
| 11176 | BAZ2A | P1T-E | Human | Esophagus | ESCC | 7.89e-16 | 8.31e-01 | 0.0875 |
| 11176 | BAZ2A | P2T-E | Human | Esophagus | ESCC | 8.55e-43 | 8.06e-01 | 0.1177 |
| 11176 | BAZ2A | P4T-E | Human | Esophagus | ESCC | 4.38e-16 | 3.27e-01 | 0.1323 |
| 11176 | BAZ2A | P5T-E | Human | Esophagus | ESCC | 1.39e-09 | 2.28e-01 | 0.1327 |
| 11176 | BAZ2A | P8T-E | Human | Esophagus | ESCC | 1.91e-35 | 7.01e-01 | 0.0889 |
| 11176 | BAZ2A | P9T-E | Human | Esophagus | ESCC | 1.16e-05 | 1.23e-01 | 0.1131 |
| 11176 | BAZ2A | P10T-E | Human | Esophagus | ESCC | 1.24e-25 | 4.04e-01 | 0.116 |
| 11176 | BAZ2A | P11T-E | Human | Esophagus | ESCC | 9.87e-07 | 3.35e-01 | 0.1426 |
| 11176 | BAZ2A | P12T-E | Human | Esophagus | ESCC | 6.33e-24 | 5.25e-01 | 0.1122 |
| 11176 | BAZ2A | P15T-E | Human | Esophagus | ESCC | 1.49e-16 | 5.15e-01 | 0.1149 |
| 11176 | BAZ2A | P16T-E | Human | Esophagus | ESCC | 1.01e-23 | 3.45e-01 | 0.1153 |
| 11176 | BAZ2A | P17T-E | Human | Esophagus | ESCC | 1.37e-14 | 5.79e-01 | 0.1278 |
| 11176 | BAZ2A | P19T-E | Human | Esophagus | ESCC | 3.05e-06 | 4.07e-01 | 0.1662 |
| Page: 1 2 3 4 5 6 7 |
| Tissue | Expression Dynamics | Abbreviation |
| Esophagus | 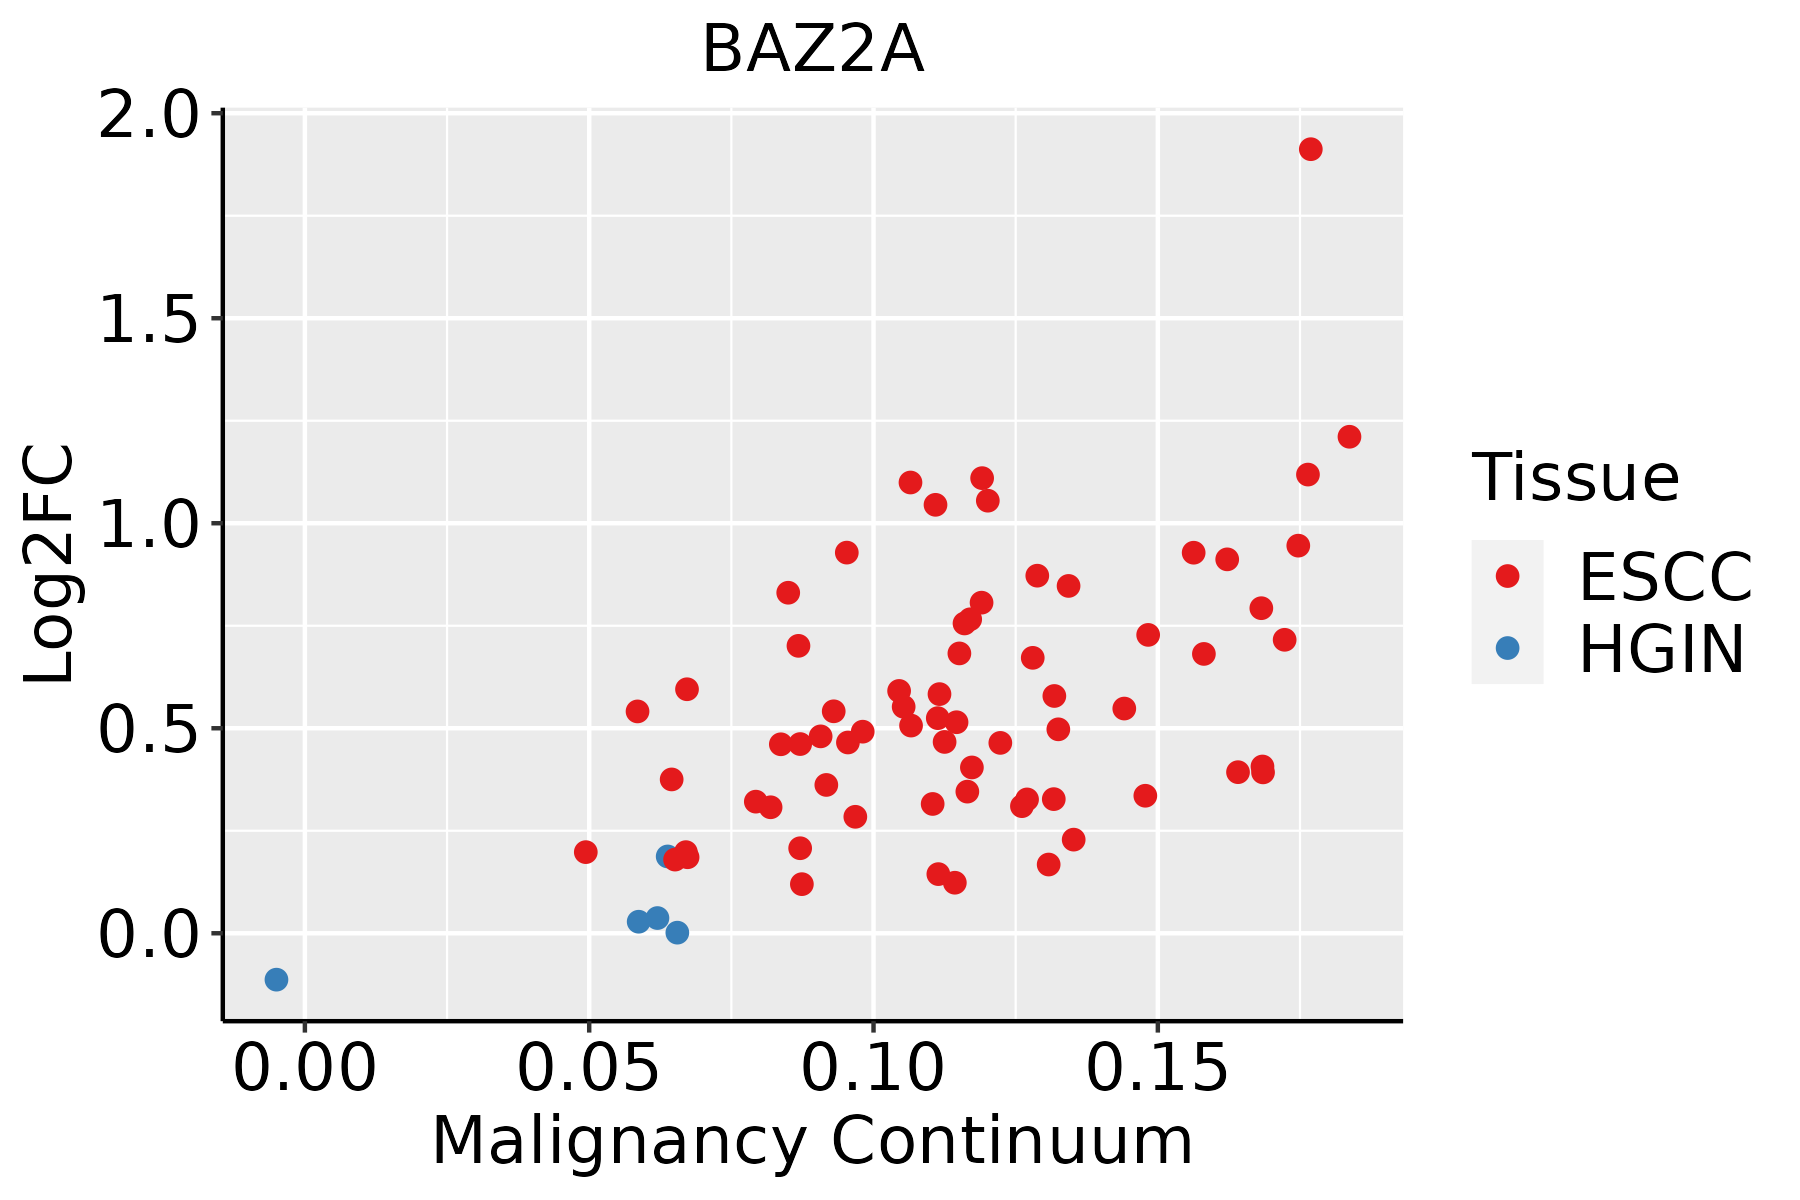 | ESCC: Esophageal squamous cell carcinoma |
| HGIN: High-grade intraepithelial neoplasias | ||
| LGIN: Low-grade intraepithelial neoplasias | ||
| Liver |  | HCC: Hepatocellular carcinoma |
| NAFLD: Non-alcoholic fatty liver disease | ||
| Oral Cavity | 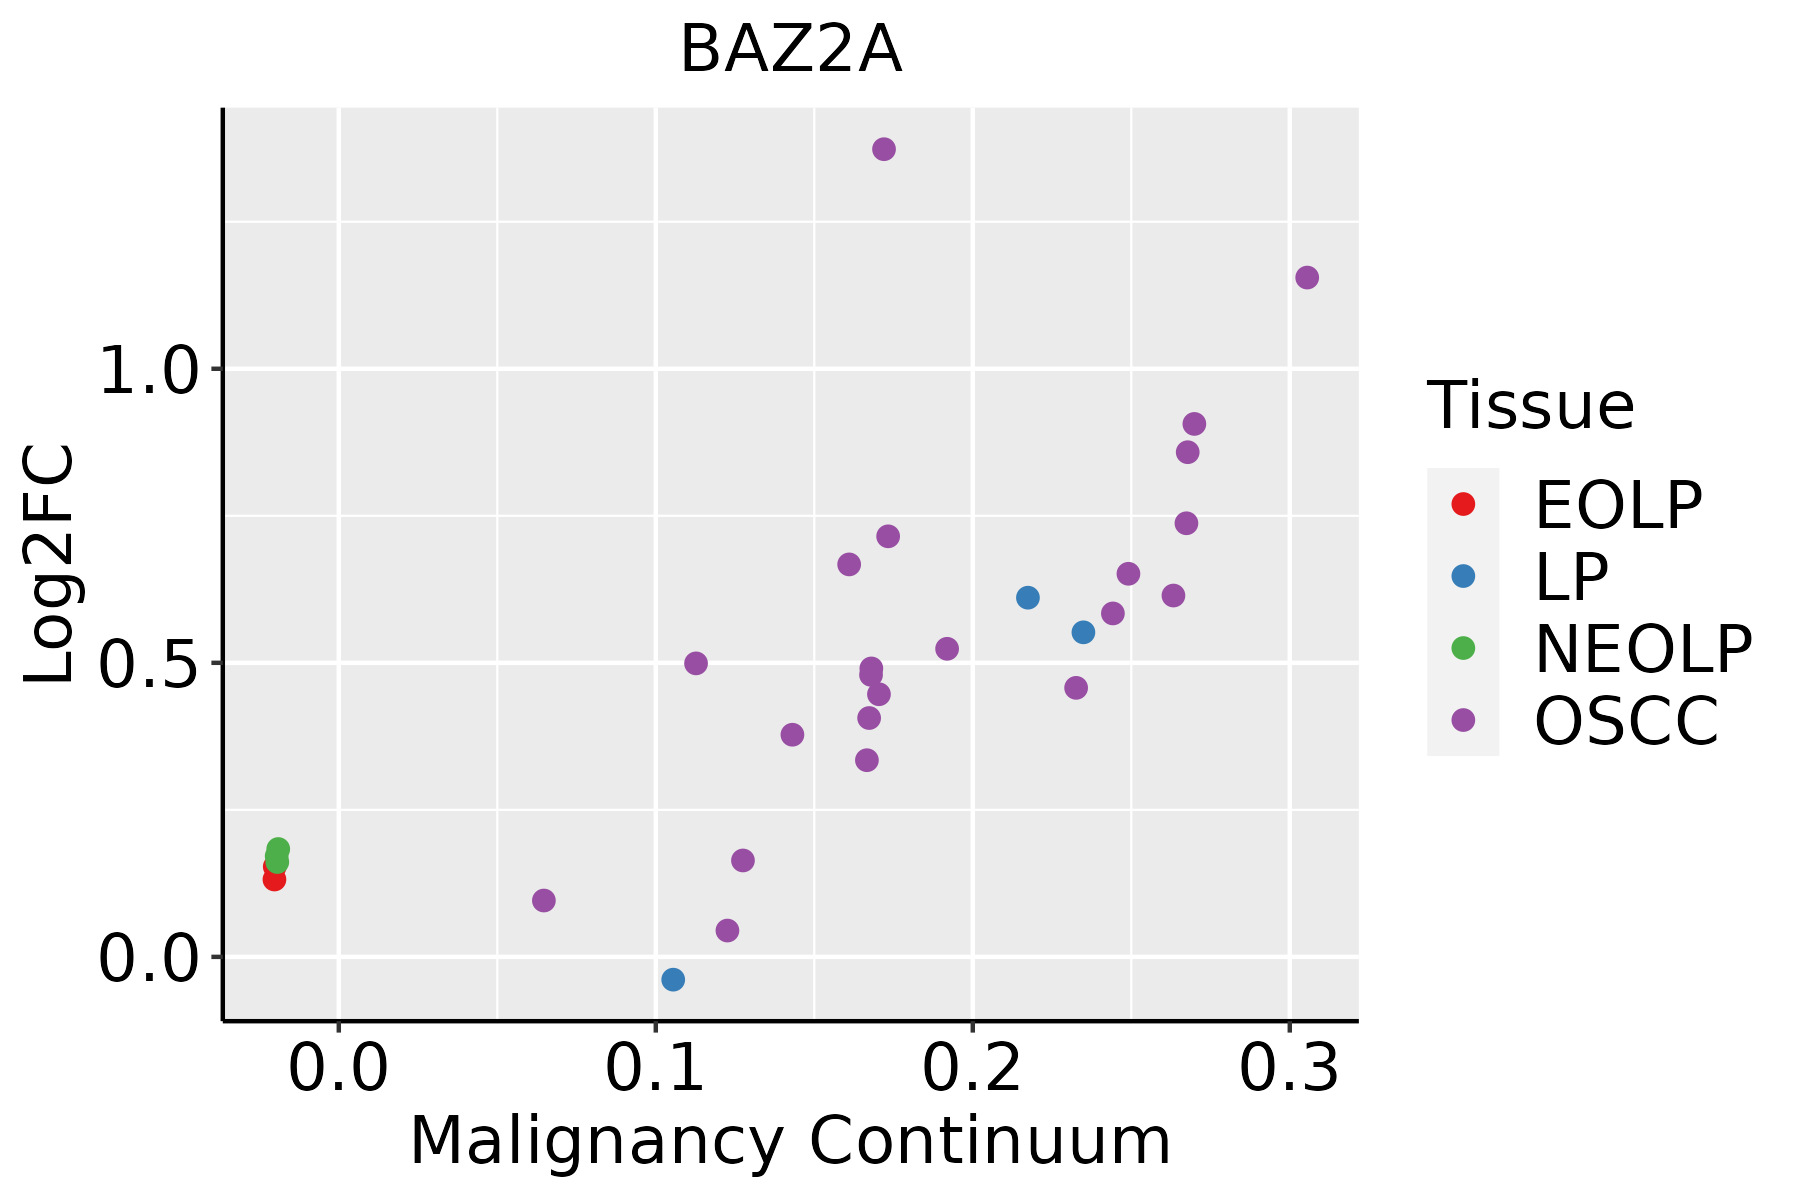 | EOLP: Erosive Oral lichen planus |
| LP: leukoplakia | ||
| NEOLP: Non-erosive oral lichen planus | ||
| OSCC: Oral squamous cell carcinoma | ||
| Prostate | 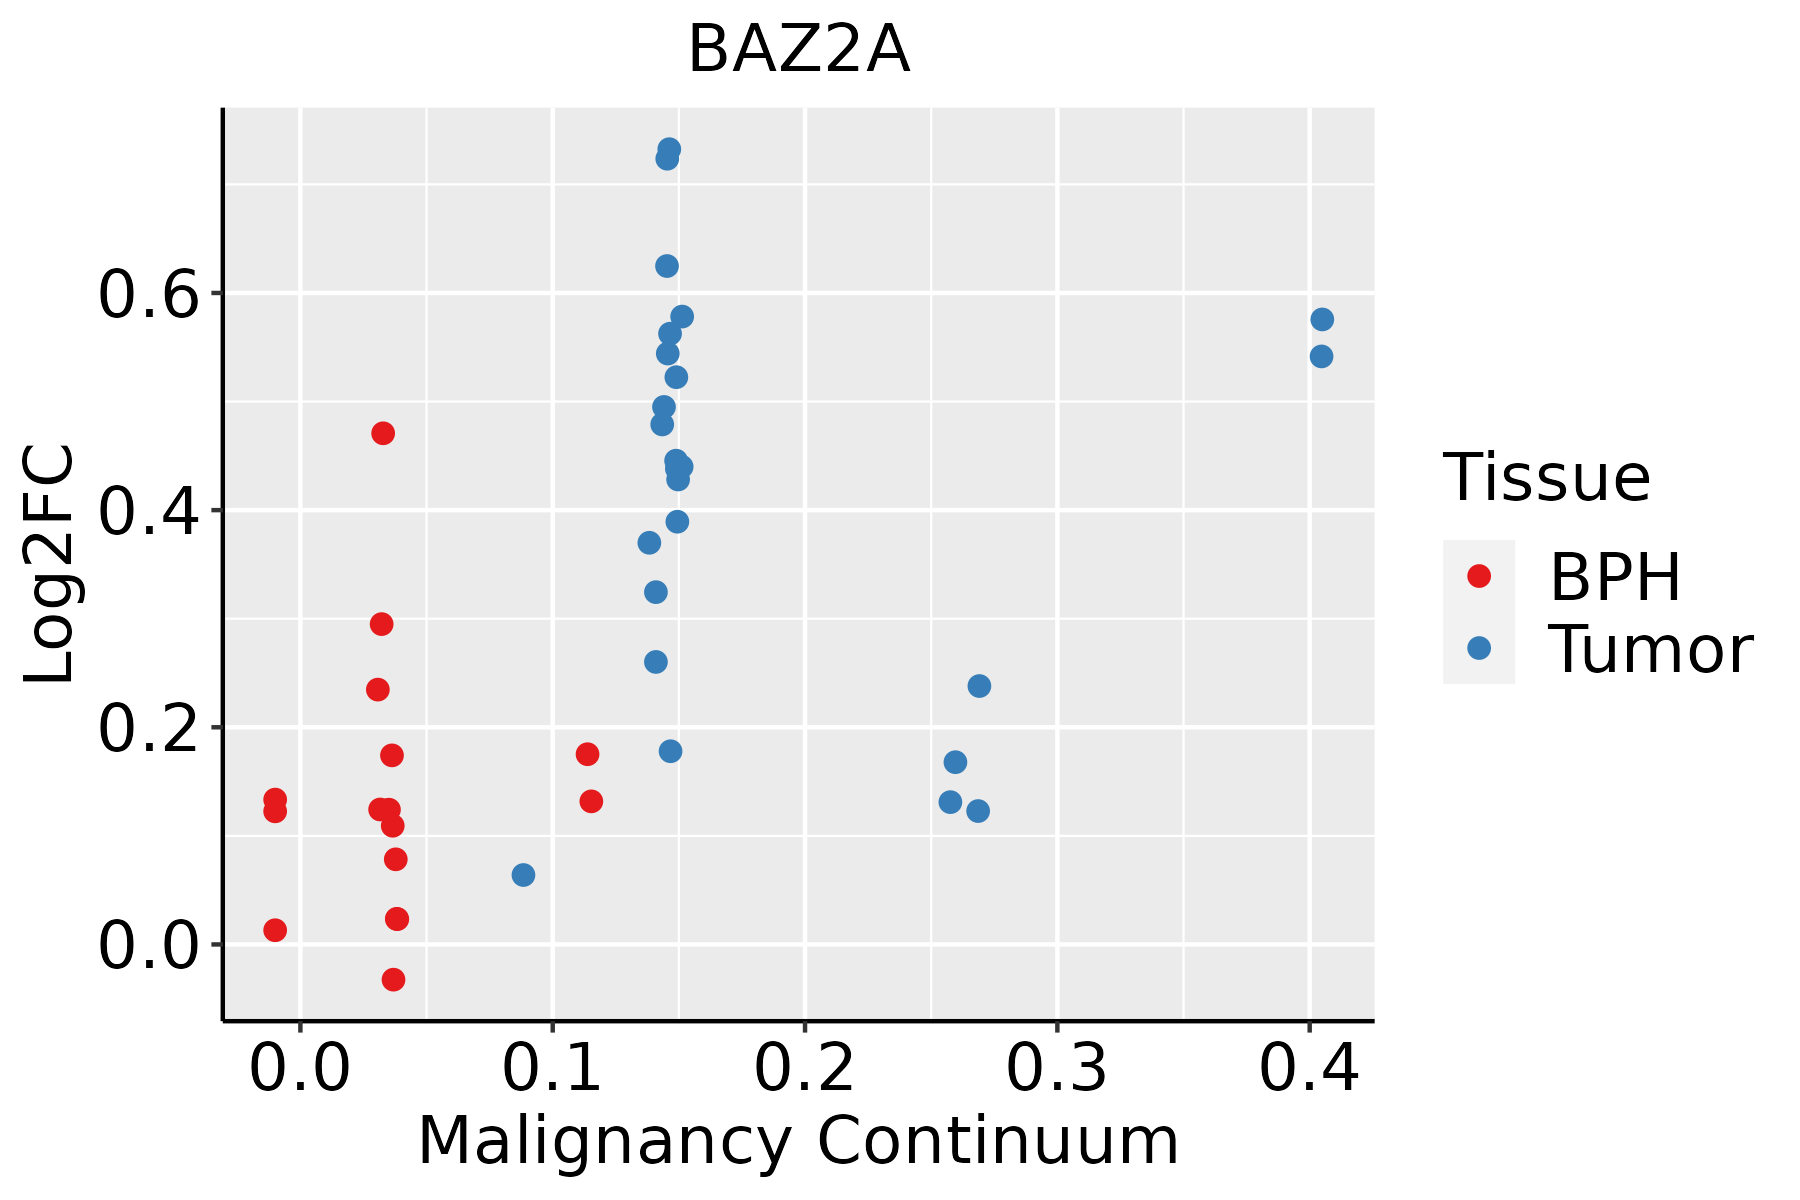 | BPH: Benign Prostatic Hyperplasia |
| Skin |  | AK: Actinic keratosis |
| cSCC: Cutaneous squamous cell carcinoma | ||
| SCCIS:squamous cell carcinoma in situ | ||
| Thyroid | 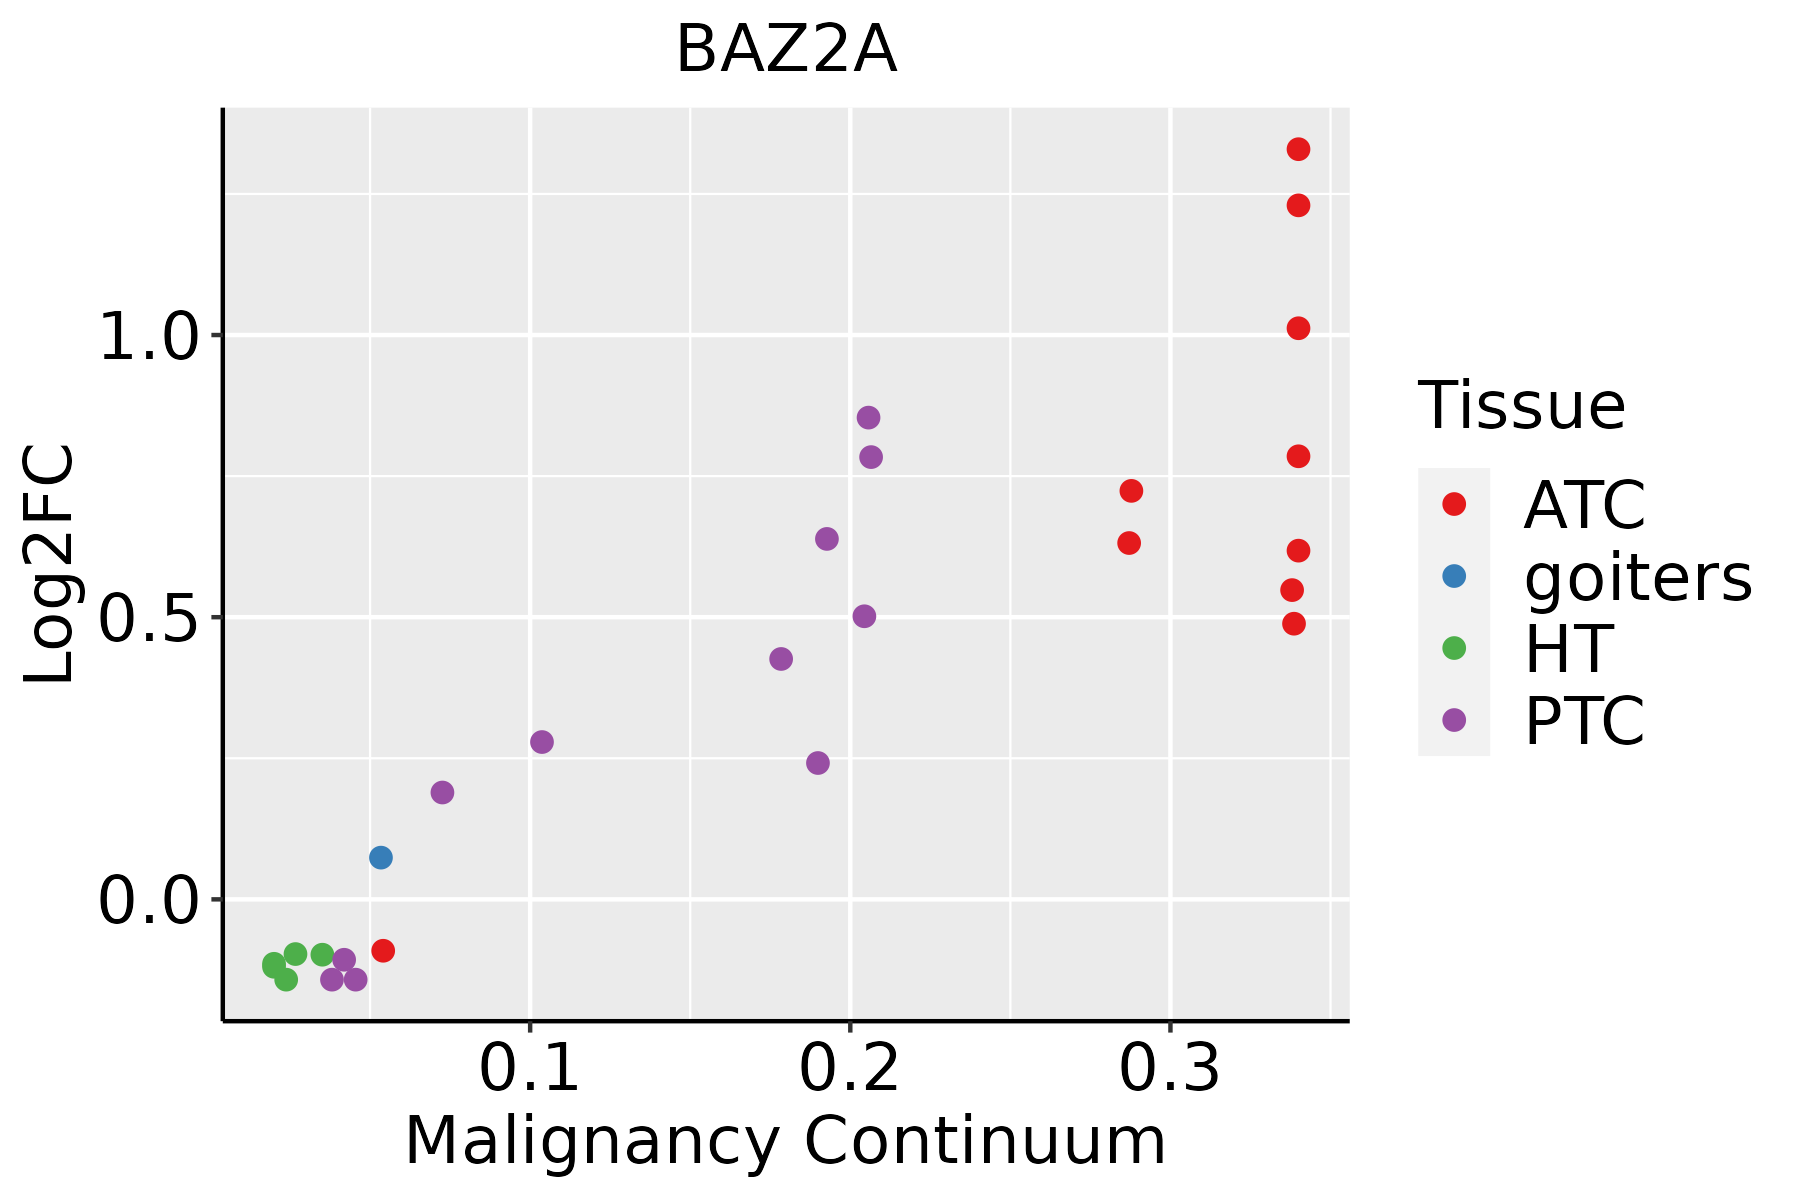 | ATC: Anaplastic thyroid cancer |
| HT: Hashimoto's thyroiditis | ||
| PTC: Papillary thyroid cancer |
| ∗log2FC in expression of this searched gene in stem-like cells from each diseased tissue sample relative to stem-like cells in normal samples in each tissue plotted against the malignancy continuum. Samples are colored based on if they are from different disease stage. |
Top |
Malignant transformation related pathway analysis |
| Find out the enriched GO biological processes and KEGG pathways involved in transition from healthy to precancer to cancer |
| Tissue | Disease Stage | Enriched GO biological Processes |
| Colorectum | AD |  |
| Colorectum | SER |  |
| Colorectum | MSS |  |
| Colorectum | MSI-H |  |
| Colorectum | FAP |  |
| ∗Top 15 enriched GO BP terms are showed in the bar plot of each disease state in each tissue. Each row represents a significant GO biological process which is colored according to the -log10(p.adjust). |
| Page: 1 2 3 4 5 6 7 8 9 |
| GO ID | Tissue | Disease Stage | Description | Gene Ratio | Bg Ratio | pvalue | p.adjust | Count |
| GO:001657015 | Esophagus | ESCC | histone modification | 323/8552 | 463/18723 | 2.61e-26 | 7.88e-24 | 323 |
| GO:00434143 | Esophagus | ESCC | macromolecule methylation | 199/8552 | 316/18723 | 3.44e-10 | 9.57e-09 | 199 |
| GO:000699713 | Esophagus | ESCC | nucleus organization | 96/8552 | 133/18723 | 4.66e-10 | 1.21e-08 | 96 |
| GO:00322592 | Esophagus | ESCC | methylation | 222/8552 | 364/18723 | 2.26e-09 | 5.09e-08 | 222 |
| GO:000632517 | Esophagus | ESCC | chromatin organization | 240/8552 | 409/18723 | 6.52e-08 | 1.14e-06 | 240 |
| GO:00356015 | Esophagus | ESCC | protein deacylation | 79/8552 | 112/18723 | 8.30e-08 | 1.42e-06 | 79 |
| GO:00400295 | Esophagus | ESCC | regulation of gene expression, epigenetic | 74/8552 | 105/18723 | 2.24e-07 | 3.42e-06 | 74 |
| GO:00987325 | Esophagus | ESCC | macromolecule deacylation | 80/8552 | 116/18723 | 3.19e-07 | 4.50e-06 | 80 |
| GO:00165754 | Esophagus | ESCC | histone deacetylation | 60/8552 | 82/18723 | 3.85e-07 | 5.32e-06 | 60 |
| GO:00064765 | Esophagus | ESCC | protein deacetylation | 70/8552 | 101/18723 | 1.29e-06 | 1.58e-05 | 70 |
| GO:000635211 | Esophagus | ESCC | DNA-templated transcription, initiation | 86/8552 | 130/18723 | 1.88e-06 | 2.19e-05 | 86 |
| GO:00063602 | Esophagus | ESCC | transcription by RNA polymerase I | 42/8552 | 55/18723 | 3.41e-06 | 3.78e-05 | 42 |
| GO:00708973 | Esophagus | ESCC | transcription preinitiation complex assembly | 30/8552 | 36/18723 | 3.60e-06 | 3.95e-05 | 30 |
| GO:00708281 | Esophagus | ESCC | heterochromatin organization | 31/8552 | 46/18723 | 2.42e-03 | 1.06e-02 | 31 |
| GO:00063611 | Esophagus | ESCC | transcription initiation from RNA polymerase I promoter | 11/8552 | 13/18723 | 4.76e-03 | 1.85e-02 | 11 |
| GO:0045814 | Esophagus | ESCC | negative regulation of gene expression, epigenetic | 32/8552 | 50/18723 | 6.90e-03 | 2.52e-02 | 32 |
| GO:0006304 | Esophagus | ESCC | DNA modification | 68/8552 | 120/18723 | 9.95e-03 | 3.42e-02 | 68 |
| GO:00165703 | Liver | NAFLD | histone modification | 90/1882 | 463/18723 | 5.74e-10 | 1.28e-07 | 90 |
| GO:00063255 | Liver | NAFLD | chromatin organization | 64/1882 | 409/18723 | 2.31e-04 | 3.89e-03 | 64 |
| GO:0043414 | Liver | NAFLD | macromolecule methylation | 47/1882 | 316/18723 | 4.08e-03 | 3.41e-02 | 47 |
| Page: 1 2 3 4 5 6 7 |
| Pathway ID | Tissue | Disease Stage | Description | Gene Ratio | Bg Ratio | pvalue | p.adjust | qvalue | Count |
| Page: 1 |
Top |
Cell-cell communication analysis |
| Identification of potential cell-cell interactions between two cell types and their ligand-receptor pairs for different disease states |
| Ligand | Receptor | LRpair | Pathway | Tissue | Disease Stage |
| Page: 1 |
Top |
Single-cell gene regulatory network inference analysis |
| Find out the significant the regulons (TFs) and the target genes of each regulon across cell types for different disease states |
| TF | Cell Type | Tissue | Disease Stage | Target Gene | RSS | Regulon Activity |
| ∗The dot plots of a searched regulon are shown for all cell subpopulations in each disease state of each tissue based on the regulon specific score inferred using pySCENIC and by calculating the average expression. |
| Page: 1 |
Top |
Somatic mutation of malignant transformation related genes |
| Annotation of somatic variants for genes involved in malignant transformation |
| Hugo Symbol | Variant Class | Variant Classification | dbSNP RS | HGVSc | HGVSp | HGVSp Short | SWISSPROT | BIOTYPE | SIFT | PolyPhen | Tumor Sample Barcode | Tissue | Histology | Sex | Age | Stage | Therapy Types | Drugs | Outcome |
| BAZ2A | SNV | Missense_Mutation | rs573868102 | c.4711N>A | p.Glu1571Lys | p.E1571K | Q9UIF9 | protein_coding | deleterious(0.01) | possibly_damaging(0.812) | TCGA-3C-AALI-01 | Breast | breast invasive carcinoma | Female | <65 | I/II | Unspecific | Poly E | Complete Response |
| BAZ2A | SNV | Missense_Mutation | novel | c.656C>A | p.Ala219Glu | p.A219E | Q9UIF9 | protein_coding | deleterious(0.01) | benign(0.06) | TCGA-A2-A0T4-01 | Breast | breast invasive carcinoma | Female | <65 | I/II | Hormone Therapy | femara | SD |
| BAZ2A | SNV | Missense_Mutation | rs759726101 | c.5479N>T | p.Val1827Leu | p.V1827L | Q9UIF9 | protein_coding | deleterious(0) | probably_damaging(0.942) | TCGA-A7-A13F-01 | Breast | breast invasive carcinoma | Female | <65 | III/IV | Chemotherapy | doxorubicin | SD |
| BAZ2A | SNV | Missense_Mutation | c.4906N>A | p.Glu1636Lys | p.E1636K | Q9UIF9 | protein_coding | deleterious(0.01) | possibly_damaging(0.867) | TCGA-AC-A23H-01 | Breast | breast invasive carcinoma | Female | >=65 | I/II | Unknown | Unknown | PD | |
| BAZ2A | SNV | Missense_Mutation | rs200742397 | c.5366N>A | p.Arg1789Gln | p.R1789Q | Q9UIF9 | protein_coding | deleterious(0) | possibly_damaging(0.875) | TCGA-B6-A0IK-01 | Breast | breast invasive carcinoma | Female | <65 | III/IV | Unknown | Unknown | PD |
| BAZ2A | SNV | Missense_Mutation | rs781722269 | c.2376G>C | p.Lys792Asn | p.K792N | Q9UIF9 | protein_coding | deleterious(0.04) | benign(0.109) | TCGA-C8-A273-01 | Breast | breast invasive carcinoma | Female | <65 | I/II | Hormone Therapy | tamoxiphen | SD |
| BAZ2A | SNV | Missense_Mutation | rs781722269 | c.2376G>C | p.Lys792Asn | p.K792N | Q9UIF9 | protein_coding | deleterious(0.04) | benign(0.109) | TCGA-D8-A1JA-01 | Breast | breast invasive carcinoma | Female | <65 | III/IV | Chemotherapy | adriamycin | PD |
| BAZ2A | SNV | Missense_Mutation | rs781722269 | c.2376N>C | p.Lys792Asn | p.K792N | Q9UIF9 | protein_coding | deleterious(0.04) | benign(0.109) | TCGA-D8-A1JD-01 | Breast | breast invasive carcinoma | Female | <65 | I/II | Chemotherapy | adriamycin | SD |
| BAZ2A | SNV | Missense_Mutation | c.859N>A | p.Gln287Lys | p.Q287K | Q9UIF9 | protein_coding | tolerated(0.55) | possibly_damaging(0.9) | TCGA-D8-A1JK-01 | Breast | breast invasive carcinoma | Female | >=65 | I/II | Unknown | Unknown | SD | |
| BAZ2A | SNV | Missense_Mutation | rs560947120 | c.3068N>A | p.Arg1023Gln | p.R1023Q | Q9UIF9 | protein_coding | deleterious(0.01) | probably_damaging(0.988) | TCGA-E2-A1L6-01 | Breast | breast invasive carcinoma | Female | <65 | I/II | Chemotherapy | cyclophosphamide | SD |
| Page: 1 2 3 4 5 6 7 8 9 10 11 12 13 14 |
Top |
Related drugs of malignant transformation related genes |
| Identification of chemicals and drugs interact with genes involved in malignant transfromation |
| (DGIdb 4.0) |
| Entrez ID | Symbol | Category | Interaction Types | Drug Claim Name | Drug Name | PMIDs |
| 11176 | BAZ2A | ENZYME | inhibitor | 252166772 | ||
| 11176 | BAZ2A | ENZYME | inhibitor | 249565913 |
| Page: 1 |

Copyright 2023-Present -The University of Texas Health Science Center at Houston |