
|
|||||
|
 | |
| |
| |
| |
| |
| |
|
Gene: BAZ1A |
Gene summary for BAZ1A |
| Gene information | Species | Human | Gene symbol | BAZ1A | Gene ID | 11177 |
| Gene name | bromodomain adjacent to zinc finger domain 1A | |
| Gene Alias | ACF1 | |
| Cytomap | 14q13.1-q13.2 | |
| Gene Type | protein-coding | GO ID | GO:0006139 | UniProtAcc | Q9NRL2 |
Top |
Malignant transformation analysis |
| Identification of the aberrant gene expression in precancerous and cancerous lesions by comparing the gene expression of stem-like cells in diseased tissues with normal stem cells |
| Entrez ID | Symbol | Replicates | Species | Organ | Tissue | Adj P-value | Log2FC | Malignancy |
| 11177 | BAZ1A | CA_HPV_1 | Human | Cervix | CC | 1.38e-04 | 1.10e-01 | 0.0264 |
| 11177 | BAZ1A | CCI_1 | Human | Cervix | CC | 3.60e-04 | 7.75e-01 | 0.528 |
| 11177 | BAZ1A | CCI_2 | Human | Cervix | CC | 3.79e-09 | 1.28e+00 | 0.5249 |
| 11177 | BAZ1A | T3 | Human | Cervix | CC | 9.99e-03 | 1.75e-01 | 0.1389 |
| 11177 | BAZ1A | AEH-subject1 | Human | Endometrium | AEH | 2.01e-22 | 5.05e-01 | -0.3059 |
| 11177 | BAZ1A | AEH-subject2 | Human | Endometrium | AEH | 3.91e-11 | 2.91e-01 | -0.2525 |
| 11177 | BAZ1A | AEH-subject3 | Human | Endometrium | AEH | 6.56e-14 | 4.45e-01 | -0.2576 |
| 11177 | BAZ1A | AEH-subject4 | Human | Endometrium | AEH | 5.77e-23 | 6.72e-01 | -0.2657 |
| 11177 | BAZ1A | AEH-subject5 | Human | Endometrium | AEH | 5.84e-16 | 5.78e-01 | -0.2953 |
| 11177 | BAZ1A | EEC-subject1 | Human | Endometrium | EEC | 6.42e-25 | 5.84e-01 | -0.2682 |
| 11177 | BAZ1A | EEC-subject2 | Human | Endometrium | EEC | 6.43e-15 | 4.50e-01 | -0.2607 |
| 11177 | BAZ1A | EEC-subject3 | Human | Endometrium | EEC | 1.34e-11 | 2.44e-01 | -0.2525 |
| 11177 | BAZ1A | EEC-subject4 | Human | Endometrium | EEC | 3.06e-16 | 4.58e-01 | -0.2571 |
| 11177 | BAZ1A | GSM5276934 | Human | Endometrium | EEC | 9.89e-13 | 4.42e-01 | -0.0913 |
| 11177 | BAZ1A | GSM5276937 | Human | Endometrium | EEC | 1.64e-04 | 3.34e-01 | -0.0897 |
| 11177 | BAZ1A | GSM6177620_NYU_UCEC1_lib1_lib1 | Human | Endometrium | EEC | 2.63e-22 | 1.13e-01 | -0.1869 |
| 11177 | BAZ1A | GSM6177620_NYU_UCEC1_lib2_lib2 | Human | Endometrium | EEC | 5.43e-26 | 9.06e-02 | -0.1875 |
| 11177 | BAZ1A | GSM6177620_NYU_UCEC1_lib3_lib3 | Human | Endometrium | EEC | 5.83e-29 | 1.03e-01 | -0.1883 |
| 11177 | BAZ1A | GSM6177621_NYU_UCEC2_lib1_lib1 | Human | Endometrium | EEC | 2.30e-20 | 2.71e-01 | -0.1934 |
| 11177 | BAZ1A | GSM6177622_NYU_UCEC3_lib1_lib1 | Human | Endometrium | EEC | 2.28e-26 | 1.19e-01 | -0.1917 |
| Page: 1 2 3 4 5 6 7 8 9 10 |
| Tissue | Expression Dynamics | Abbreviation |
| Cervix | 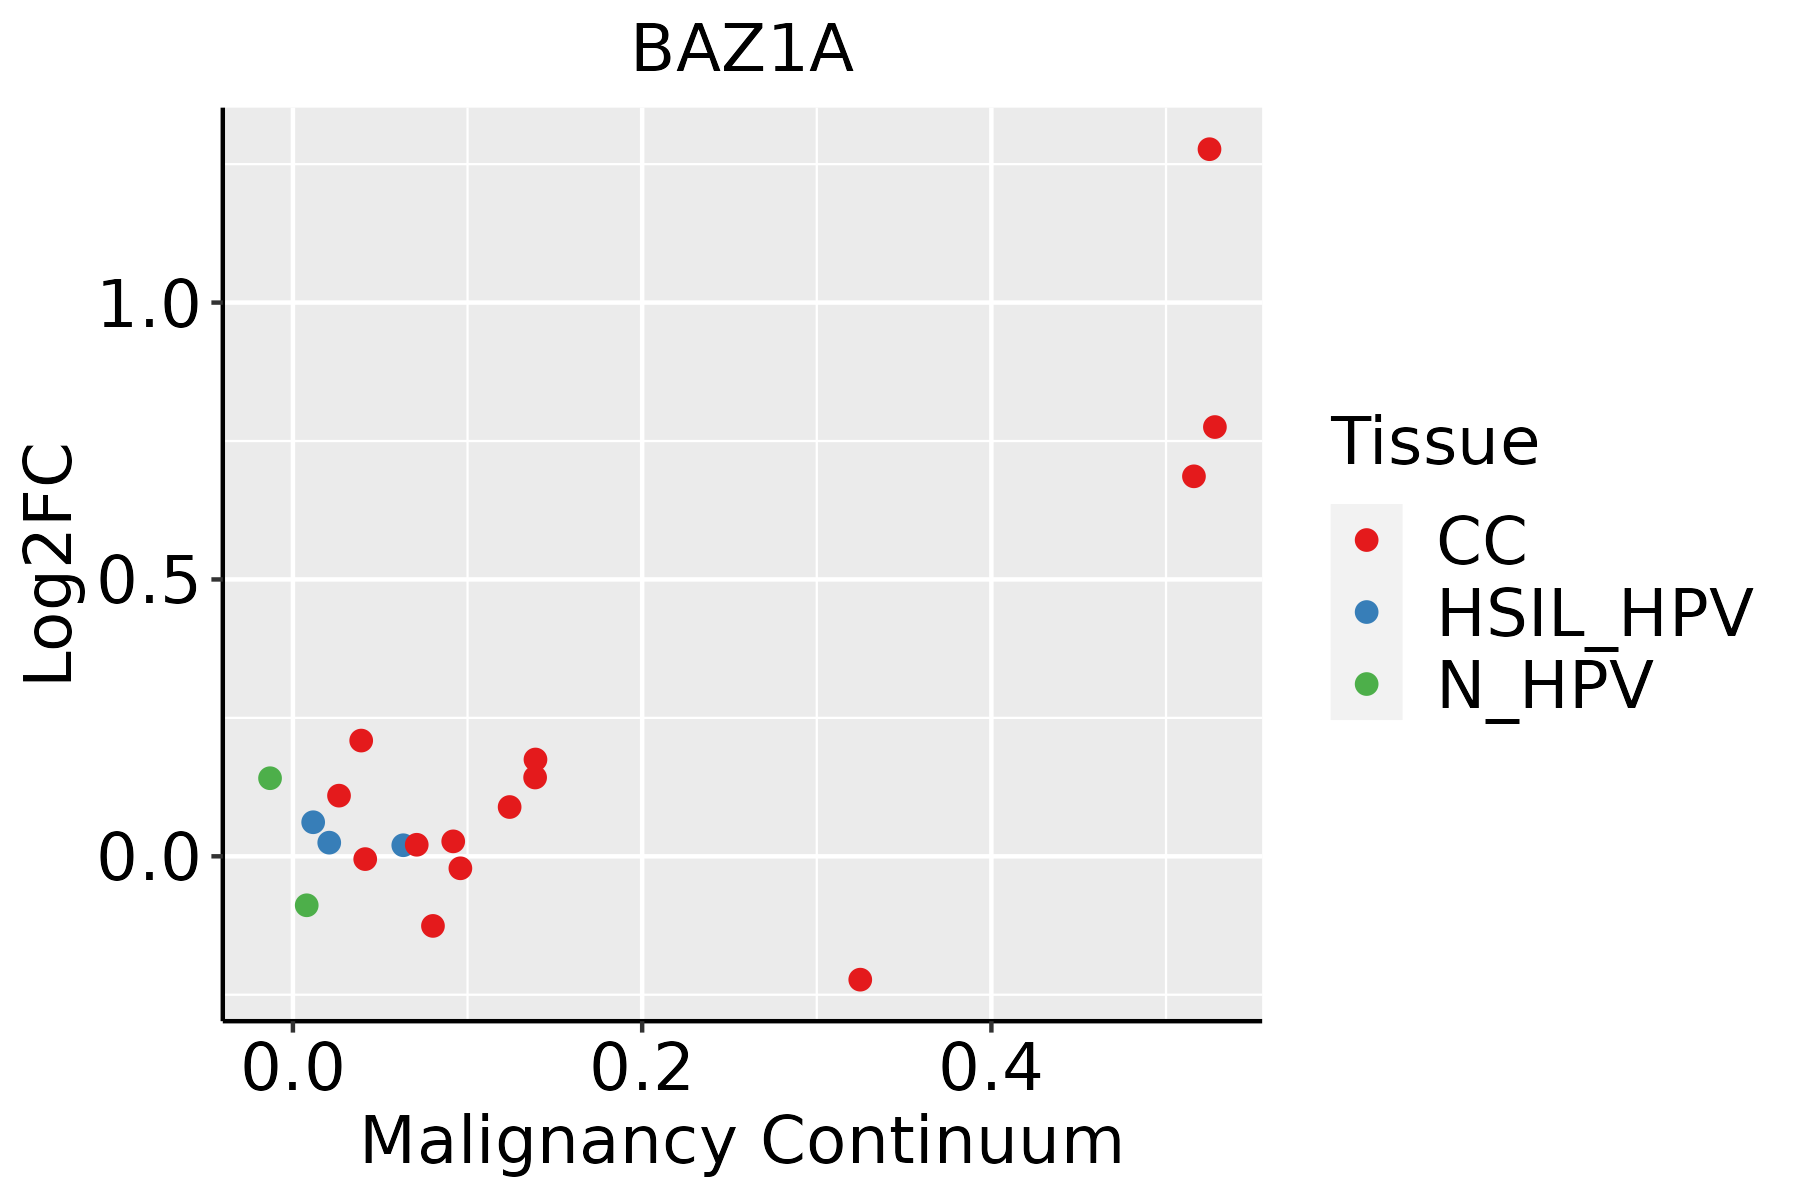 | CC: Cervix cancer |
| HSIL_HPV: HPV-infected high-grade squamous intraepithelial lesions | ||
| N_HPV: HPV-infected normal cervix | ||
| Endometrium | 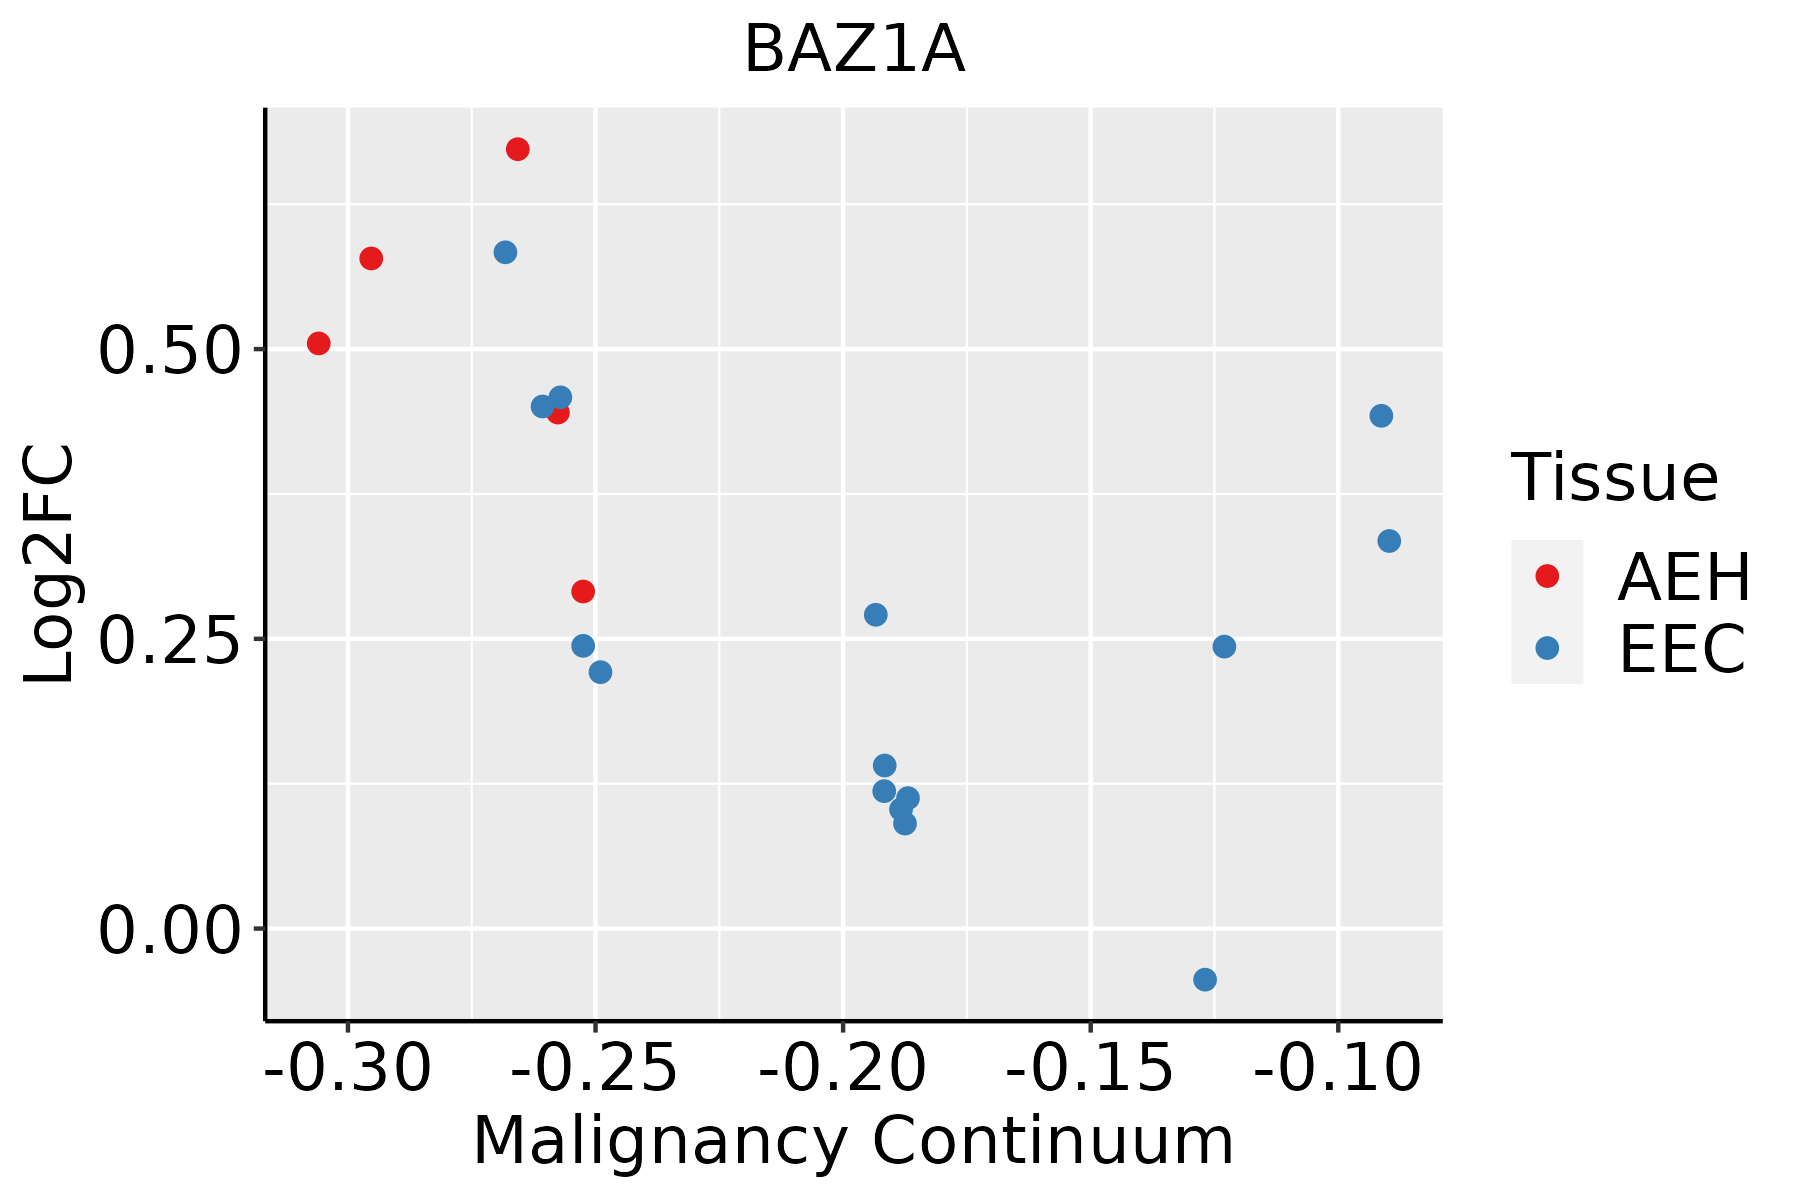 | AEH: Atypical endometrial hyperplasia |
| EEC: Endometrioid Cancer | ||
| Esophagus | 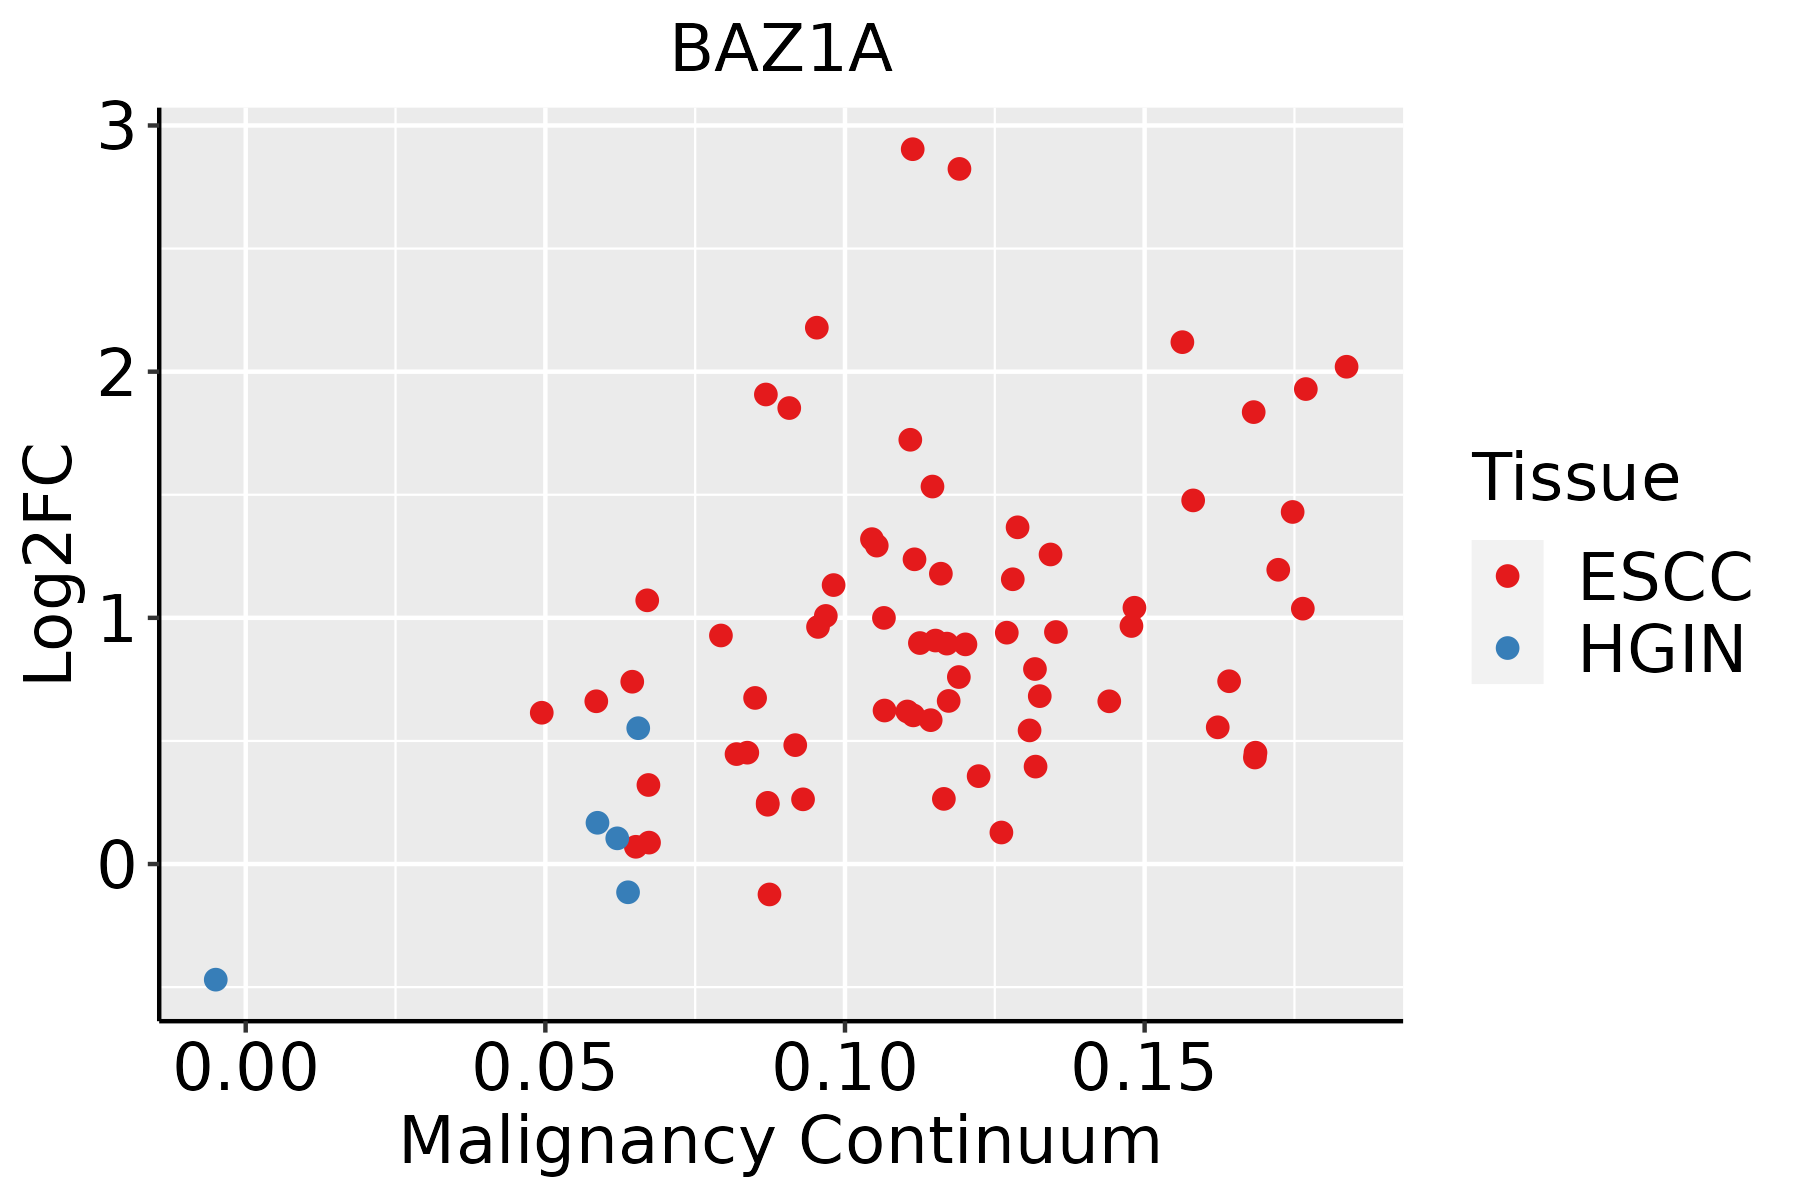 | ESCC: Esophageal squamous cell carcinoma |
| HGIN: High-grade intraepithelial neoplasias | ||
| LGIN: Low-grade intraepithelial neoplasias | ||
| Liver |  | HCC: Hepatocellular carcinoma |
| NAFLD: Non-alcoholic fatty liver disease | ||
| Lung |  | AAH: Atypical adenomatous hyperplasia |
| AIS: Adenocarcinoma in situ | ||
| IAC: Invasive lung adenocarcinoma | ||
| MIA: Minimally invasive adenocarcinoma | ||
| Oral Cavity | 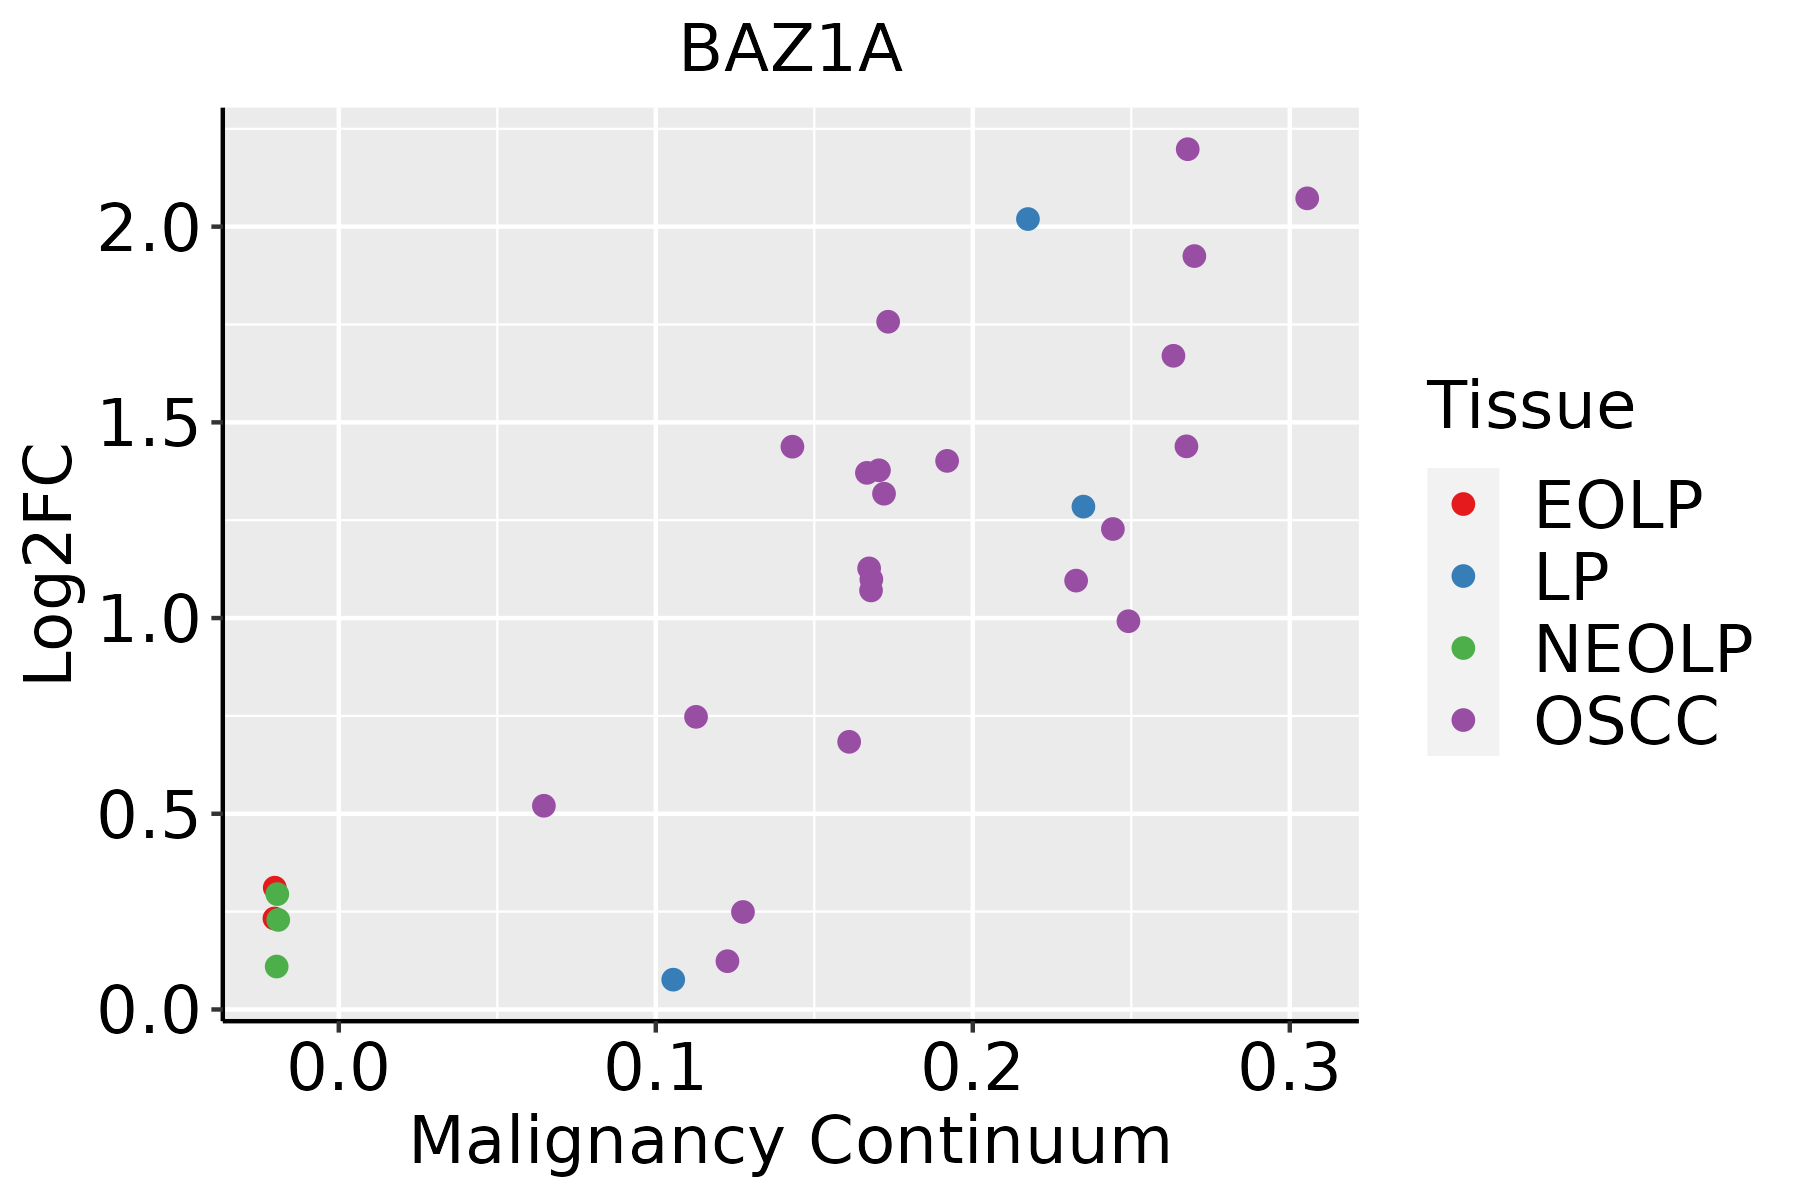 | EOLP: Erosive Oral lichen planus |
| LP: leukoplakia | ||
| NEOLP: Non-erosive oral lichen planus | ||
| OSCC: Oral squamous cell carcinoma | ||
| Prostate | 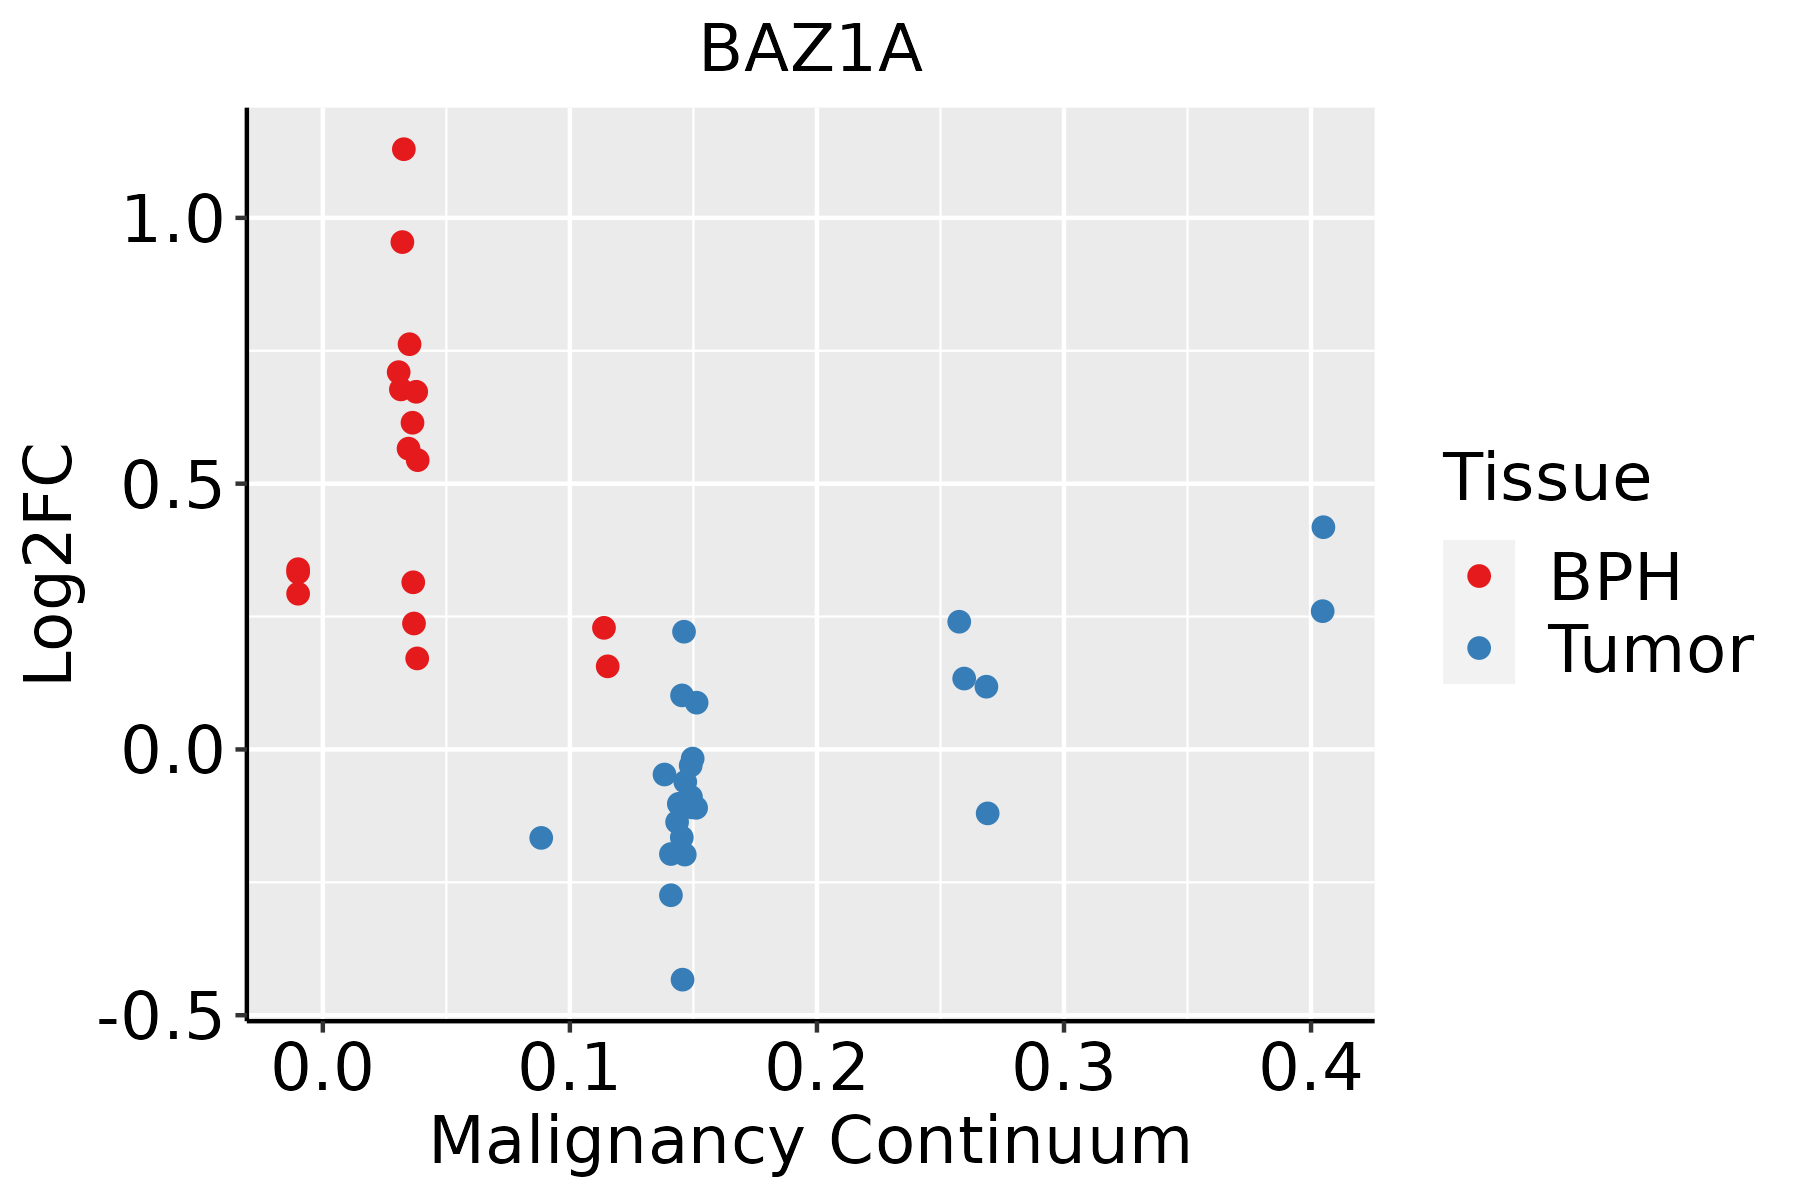 | BPH: Benign Prostatic Hyperplasia |
| Skin | 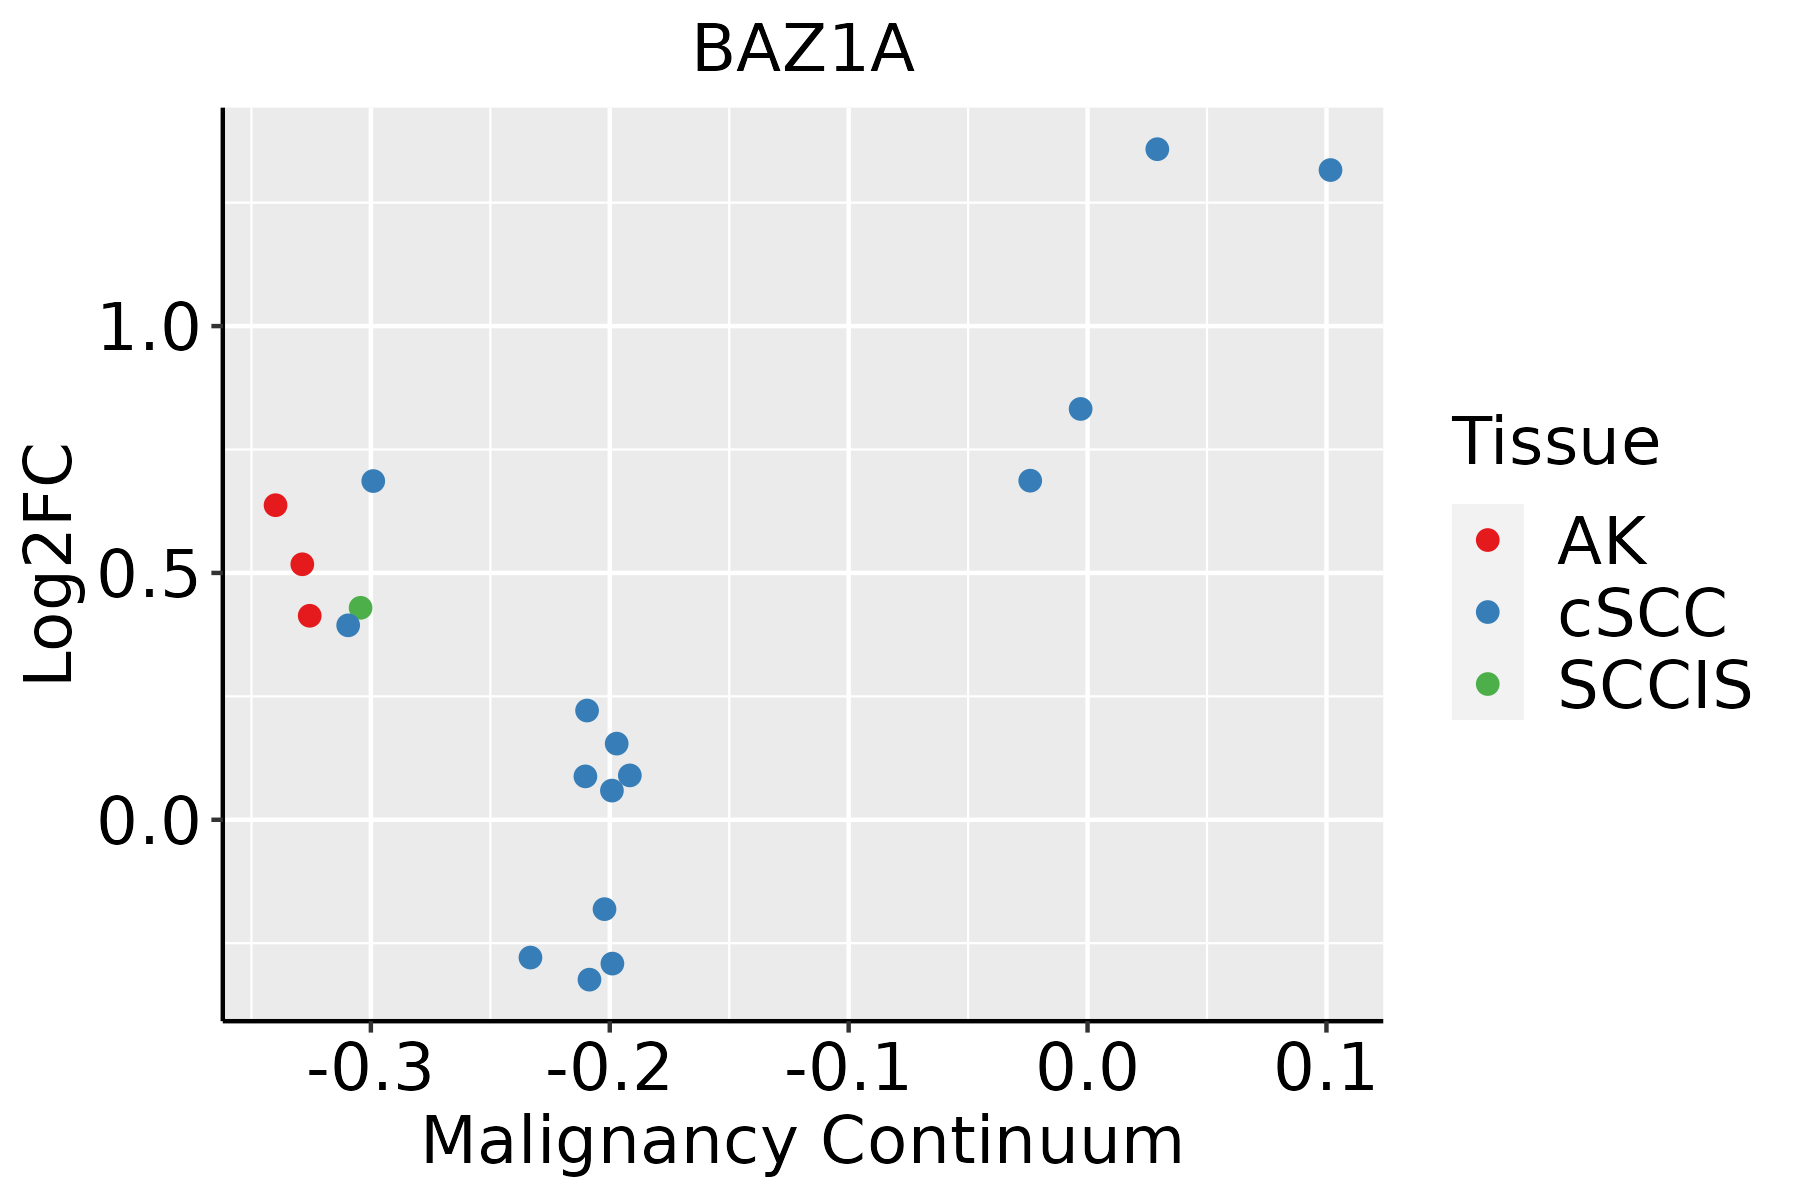 | AK: Actinic keratosis |
| cSCC: Cutaneous squamous cell carcinoma | ||
| SCCIS:squamous cell carcinoma in situ | ||
| Thyroid |  | ATC: Anaplastic thyroid cancer |
| HT: Hashimoto's thyroiditis | ||
| PTC: Papillary thyroid cancer |
| ∗log2FC in expression of this searched gene in stem-like cells from each diseased tissue sample relative to stem-like cells in normal samples in each tissue plotted against the malignancy continuum. Samples are colored based on if they are from different disease stage. |
Top |
Malignant transformation related pathway analysis |
| Find out the enriched GO biological processes and KEGG pathways involved in transition from healthy to precancer to cancer |
| Tissue | Disease Stage | Enriched GO biological Processes |
| Colorectum | AD |  |
| Colorectum | SER |  |
| Colorectum | MSS |  |
| Colorectum | MSI-H |  |
| Colorectum | FAP |  |
| ∗Top 15 enriched GO BP terms are showed in the bar plot of each disease state in each tissue. Each row represents a significant GO biological process which is colored according to the -log10(p.adjust). |
| Page: 1 2 3 4 5 6 7 8 9 |
| GO ID | Tissue | Disease Stage | Description | Gene Ratio | Bg Ratio | pvalue | p.adjust | Count |
| GO:00063257 | Cervix | CC | chromatin organization | 78/2311 | 409/18723 | 5.40e-05 | 8.02e-04 | 78 |
| GO:00062602 | Cervix | CC | DNA replication | 48/2311 | 260/18723 | 2.70e-03 | 1.85e-02 | 48 |
| GO:00063381 | Cervix | CC | chromatin remodeling | 45/2311 | 255/18723 | 8.33e-03 | 4.30e-02 | 45 |
| GO:00063258 | Endometrium | AEH | chromatin organization | 64/2100 | 409/18723 | 3.69e-03 | 2.52e-02 | 64 |
| GO:000632513 | Endometrium | EEC | chromatin organization | 65/2168 | 409/18723 | 4.98e-03 | 3.14e-02 | 65 |
| GO:000632516 | Esophagus | HGIN | chromatin organization | 92/2587 | 409/18723 | 1.05e-06 | 4.16e-05 | 92 |
| GO:00062604 | Esophagus | ESCC | DNA replication | 181/8552 | 260/18723 | 3.55e-15 | 2.05e-13 | 181 |
| GO:000632517 | Esophagus | ESCC | chromatin organization | 240/8552 | 409/18723 | 6.52e-08 | 1.14e-06 | 240 |
| GO:00062612 | Esophagus | ESCC | DNA-dependent DNA replication | 100/8552 | 151/18723 | 2.61e-07 | 3.94e-06 | 100 |
| GO:00063255 | Liver | NAFLD | chromatin organization | 64/1882 | 409/18723 | 2.31e-04 | 3.89e-03 | 64 |
| GO:00062601 | Liver | HCC | DNA replication | 146/7958 | 260/18723 | 5.68e-06 | 7.02e-05 | 146 |
| GO:000632511 | Liver | HCC | chromatin organization | 206/7958 | 409/18723 | 7.23e-04 | 4.41e-03 | 206 |
| GO:0006261 | Liver | HCC | DNA-dependent DNA replication | 80/7958 | 151/18723 | 5.91e-03 | 2.44e-02 | 80 |
| GO:00063256 | Lung | IAC | chromatin organization | 69/2061 | 409/18723 | 2.01e-04 | 3.53e-03 | 69 |
| GO:000632512 | Lung | AIS | chromatin organization | 62/1849 | 409/18723 | 4.24e-04 | 7.29e-03 | 62 |
| GO:00062603 | Oral cavity | OSCC | DNA replication | 159/7305 | 260/18723 | 3.25e-13 | 1.59e-11 | 159 |
| GO:00062611 | Oral cavity | OSCC | DNA-dependent DNA replication | 84/7305 | 151/18723 | 2.46e-05 | 2.30e-04 | 84 |
| GO:000632510 | Oral cavity | OSCC | chromatin organization | 190/7305 | 409/18723 | 1.17e-03 | 5.97e-03 | 190 |
| GO:000626011 | Oral cavity | LP | DNA replication | 97/4623 | 260/18723 | 3.67e-06 | 7.75e-05 | 97 |
| GO:000632515 | Oral cavity | EOLP | chromatin organization | 84/2218 | 409/18723 | 2.68e-07 | 8.16e-06 | 84 |
| Page: 1 2 |
| Pathway ID | Tissue | Disease Stage | Description | Gene Ratio | Bg Ratio | pvalue | p.adjust | qvalue | Count |
| Page: 1 |
Top |
Cell-cell communication analysis |
| Identification of potential cell-cell interactions between two cell types and their ligand-receptor pairs for different disease states |
| Ligand | Receptor | LRpair | Pathway | Tissue | Disease Stage |
| Page: 1 |
Top |
Single-cell gene regulatory network inference analysis |
| Find out the significant the regulons (TFs) and the target genes of each regulon across cell types for different disease states |
| TF | Cell Type | Tissue | Disease Stage | Target Gene | RSS | Regulon Activity |
| ∗The dot plots of a searched regulon are shown for all cell subpopulations in each disease state of each tissue based on the regulon specific score inferred using pySCENIC and by calculating the average expression. |
| Page: 1 |
Top |
Somatic mutation of malignant transformation related genes |
| Annotation of somatic variants for genes involved in malignant transformation |
| Hugo Symbol | Variant Class | Variant Classification | dbSNP RS | HGVSc | HGVSp | HGVSp Short | SWISSPROT | BIOTYPE | SIFT | PolyPhen | Tumor Sample Barcode | Tissue | Histology | Sex | Age | Stage | Therapy Types | Drugs | Outcome |
| BAZ1A | SNV | Missense_Mutation | c.3244N>G | p.Met1082Val | p.M1082V | Q9NRL2 | protein_coding | tolerated(0.29) | benign(0.003) | TCGA-A8-A076-01 | Breast | breast invasive carcinoma | Female | >=65 | I/II | Hormone Therapy | anastrozole | SD | |
| BAZ1A | SNV | Missense_Mutation | c.3839N>G | p.Ser1280Cys | p.S1280C | Q9NRL2 | protein_coding | deleterious_low_confidence(0.05) | benign(0.237) | TCGA-A8-A081-01 | Breast | breast invasive carcinoma | Female | >=65 | I/II | Unknown | Unknown | SD | |
| BAZ1A | SNV | Missense_Mutation | novel | c.3035G>C | p.Ser1012Thr | p.S1012T | Q9NRL2 | protein_coding | tolerated(0.11) | benign(0.021) | TCGA-AC-A2FO-01 | Breast | breast invasive carcinoma | Female | >=65 | I/II | Chemotherapy | chemo | CR |
| BAZ1A | SNV | Missense_Mutation | c.3371N>T | p.Ala1124Val | p.A1124V | Q9NRL2 | protein_coding | deleterious(0.03) | benign(0.138) | TCGA-AN-A0AK-01 | Breast | breast invasive carcinoma | Female | >=65 | I/II | Unknown | Unknown | SD | |
| BAZ1A | SNV | Missense_Mutation | c.2848N>C | p.Asp950His | p.D950H | Q9NRL2 | protein_coding | tolerated(0.07) | possibly_damaging(0.786) | TCGA-AN-A0AL-01 | Breast | breast invasive carcinoma | Female | <65 | III/IV | Unknown | Unknown | SD | |
| BAZ1A | SNV | Missense_Mutation | novel | c.1014G>T | p.Lys338Asn | p.K338N | Q9NRL2 | protein_coding | deleterious(0.03) | benign(0.101) | TCGA-AQ-A54O-01 | Breast | breast invasive carcinoma | Male | <65 | I/II | Chemotherapy | adriamycin | CR |
| BAZ1A | SNV | Missense_Mutation | c.2362G>A | p.Glu788Lys | p.E788K | Q9NRL2 | protein_coding | deleterious(0) | possibly_damaging(0.516) | TCGA-B6-A0RE-01 | Breast | breast invasive carcinoma | Female | <65 | I/II | Unknown | Unknown | SD | |
| BAZ1A | SNV | Missense_Mutation | rs750237626 | c.4169C>T | p.Ser1390Phe | p.S1390F | Q9NRL2 | protein_coding | tolerated_low_confidence(0.06) | benign(0) | TCGA-BH-A0B4-01 | Breast | breast invasive carcinoma | Male | >=65 | III/IV | Hormone Therapy | tamoxiphen | SD |
| BAZ1A | SNV | Missense_Mutation | c.1384N>C | p.Val462Leu | p.V462L | Q9NRL2 | protein_coding | tolerated(0.21) | probably_damaging(0.994) | TCGA-D8-A1JA-01 | Breast | breast invasive carcinoma | Female | <65 | III/IV | Chemotherapy | adriamycin | PD | |
| BAZ1A | SNV | Missense_Mutation | c.1834N>A | p.Glu612Lys | p.E612K | Q9NRL2 | protein_coding | deleterious(0.01) | probably_damaging(0.986) | TCGA-EW-A1PB-01 | Breast | breast invasive carcinoma | Female | >=65 | III/IV | Unknown | Unknown | SD |
| Page: 1 2 3 4 5 6 7 8 9 10 11 12 13 |
Top |
Related drugs of malignant transformation related genes |
| Identification of chemicals and drugs interact with genes involved in malignant transfromation |
| (DGIdb 4.0) |
| Entrez ID | Symbol | Category | Interaction Types | Drug Claim Name | Drug Name | PMIDs |
| Page: 1 |

Copyright 2023-Present -The University of Texas Health Science Center at Houston |